

TokenOps
Track AI token usage, cost, and rate with CoreStack TokenOps. Analyze AI service spend, drill into accounts, and subscribe to scheduled spend reports.
Feature Overview
TokenOps is a dashboard in CoreStack’s FinOps module that tracks token-level usage, cost, and rate for the AI services onboarded to the platform. It opens from its own TokenOps entry under FinOps in the left navigation. Use it when you need to monitor AI spend alongside the rest of your cloud costs, or attribute that spend to accounts and models.
TokenOps is designed for FinOps Practitioners and FinOps Admins who track AI spend and consumption patterns across models. It does not track Claude API usage by Agent or API key. That attribution is available under Governance > AI Services > Frontier AI, which is documented separately.
Note: Widgets show Usage and Rate only when a token-based Consumed Unit is set on them. Without one, a widget shows Cost only. See Configuring a Token-Based Consumed Unit.
How It Works
CoreStack auto-discovers usage from your onboarded AI services and surfaces it in the TokenOps dashboard. The dashboard uses Platform widgets, which now include AI services in cost trend and forecast views. A cost-by-dimension widget breaks AI spend down by your business dimensions, such as account. When a widget has a token-based Consumed Unit, Usage shows token counts and Rate shows the average cost per token unit. From any chart, you can drill into a data point and subscribe to that drilldown as a scheduled email report.
Prerequisites
Before you begin, ensure the following:
-
Role: You have the FinOps Practitioner or FinOps Admin role assigned in CoreStack.
-
Prior setup: An AWS account with Bedrock enabled is onboarded to CoreStack. Bedrock usage is auto-discovered within 24 hours of activity, with no additional connector required.
-
Access: You can access
FinOps > TokenOpsin the CoreStack navigation. -
Permissions: To configure widgets, you have permission to add and edit dashboard widgets. To create subscriptions, your role has the Subscribe access right.
Key Capabilities
TokenOps provides the following capabilities:
-
TokenOps Menu — A dedicated TokenOps entry under FinOps opens the TokenOps dashboard directly from the left navigation.
-
AI Services in Platform Widgets — The Platform cost trend and forecast widgets support AI services. You can view AI spend and AI spend forecasts alongside the rest of your platform costs.
-
Cost by Dimension — A cost-by-dimension widget breaks AI services spend down by your business dimensions, so you can attribute costs accurately.
-
Additional Chart Types — More chart types are available for visualizing AI services data.
-
Drilldown and Subscriptions — Select a data point to open a drilldown. Subscribe to the drilldown to receive it as a scheduled report.
-
Token-Based Consumed Units — Each provider’s token-bearing Consumed Unit becomes its own summary card:
| Provider | Consumed Units |
|---|---|
| AWS | Units, 1K Tokens, 1M Tokens |
| Azure | 1K, 1M, 1/Month (for PTU — Provisioned Throughput Units), 1/Hour (for Provisioned Managed Global Unit) |
| GCP | Count |
Note: Azure and GCP Consumed Units are active for normal onboarded cloud accounts. They are not gated by AI Service integration status. CoreStack supports this Consumed Unit mechanism for AWS, Azure, and GCP accounts.
-
Consumed Unit Configuration — Set a Consumed Unit from the widget’s Data Binding tab. Turn on Override Filters to reveal a filter Key/Value pair. Set the Key to Consumed Unit and the Value to the token unit for the provider. Usage and Rate then show token counts instead of a cloud-usage unit such as GB, Hrs, or vCPU-Hours.
-
Primary/Secondary Metric Selection — Choose Cost, Usage, or Rate as the Primary metric on the Cost Trend (New) widget. This differs from the standard Cost Trend widget. The Primary metric renders as the main bar graph, and the other two render as secondary lines on the same chart. For TokenOps widgets, add all three metrics as visible.
-
Breakdown by AI Model — Group data by a dimension, such as AI Model Name. This isolates a model’s consumption, cost, or rate over a selected time range.
-
Rate as an Average — Rate is the average cost per unit of consumption, for example per 1,000 or 1 million tokens. CoreStack recalculates it for the selected Time Range and Granularity.
-
Provider Scope — The widgets support all supported AI services. For AI Services integrations, Consumed Units are confirmed for AWS Bedrock today. Anthropic Claude API usage is tracked separately under Frontier AI.
Accessing the TokenOps Dashboard
Navigate to FinOps > TokenOps > Dashboard. The dashboard opens in your current view, with the Filter bar at the top and the AI spend widgets below it.
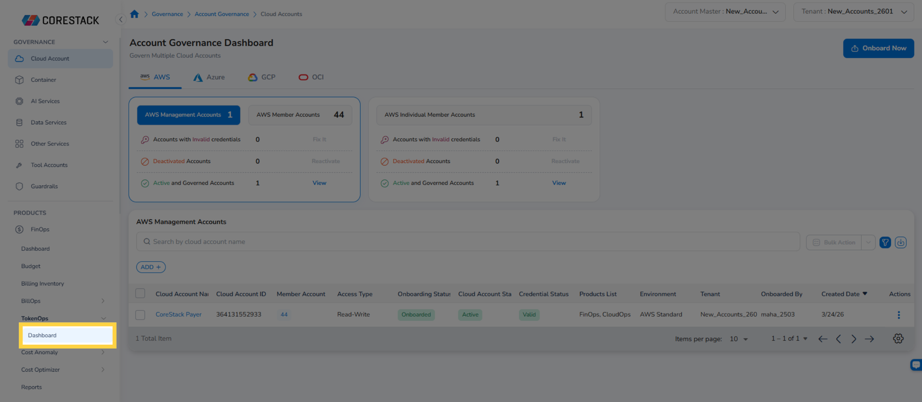
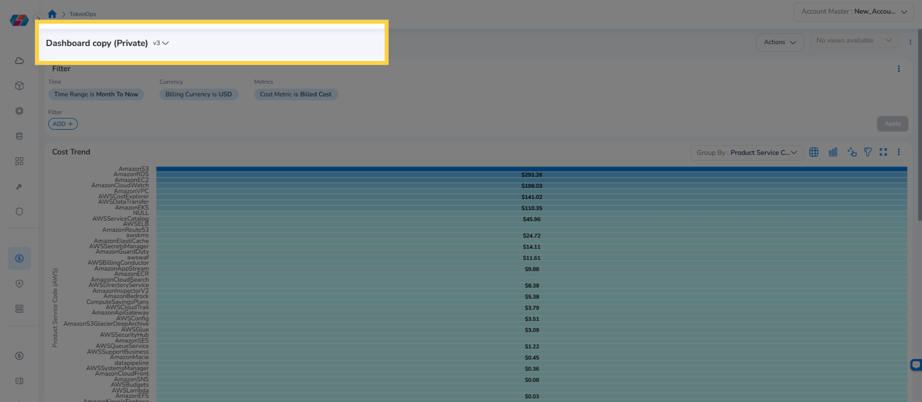
To switch views, click the view name at the top of the page, such as Dashboard copy (Private). Then select another view from the list.
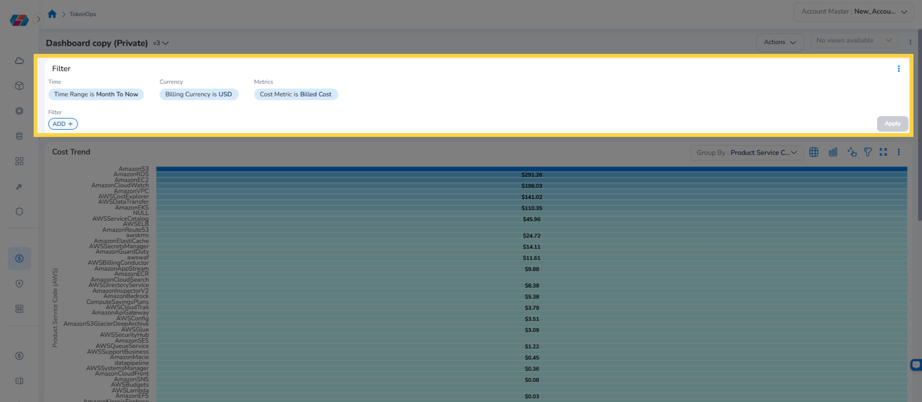
The Filter bar shows the time range, billing currency, and cost metric applied to every widget on the dashboard. By default, these are Time Range is Month To Now, Billing Currency is USD, and Cost Metric is Billed Cost.
Filtering AI Spend Data
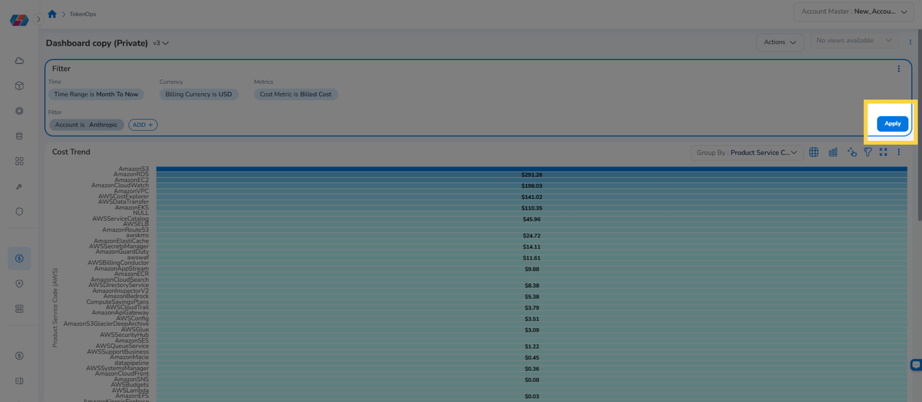
Add a filter to limit every widget on the dashboard to specific data, such as a single account. Follow these steps:
Step 1: Open the filter field list
Click Add in the Filter bar. A list of filter fields opens, such as Account, Provider, and Service Name.
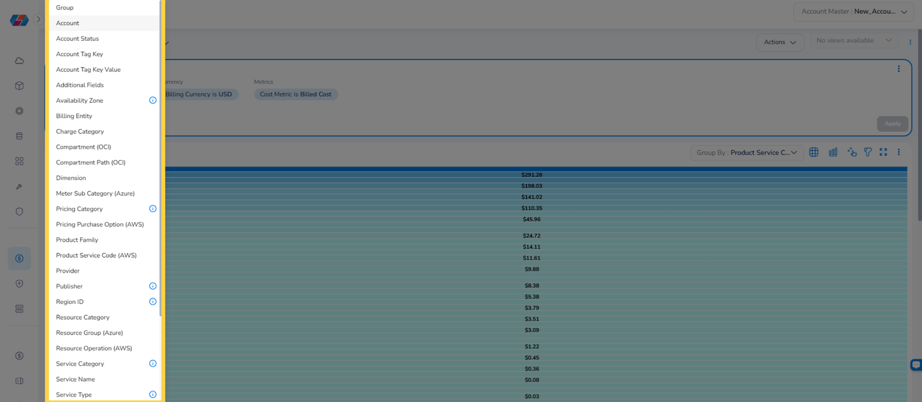
Step 2: Select a field and value
Select the field to filter by, then select the value to include.
Step 3: Apply the filter
Click Apply. The new filter appears in the Filter bar, and all widgets refresh to show only the matching data.
Analyzing AI Spend by Dimension
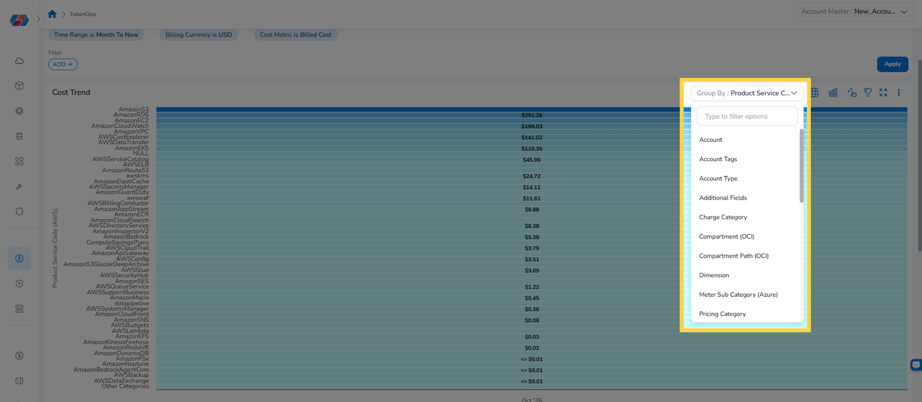
The Cost Trend widget shows spend over the selected time range. Group it by a dimension to see which services, models, or accounts drive your AI spend. Follow these steps:
Step 1: Open the Group By list
Click Group By in the Cost Trend widget header. The list of available dimensions opens.
Step 2: Select a dimension
Select a dimension, such as AI Model Name or Account. The chart regroups, and the vertical axis lists one item from that dimension per bar.
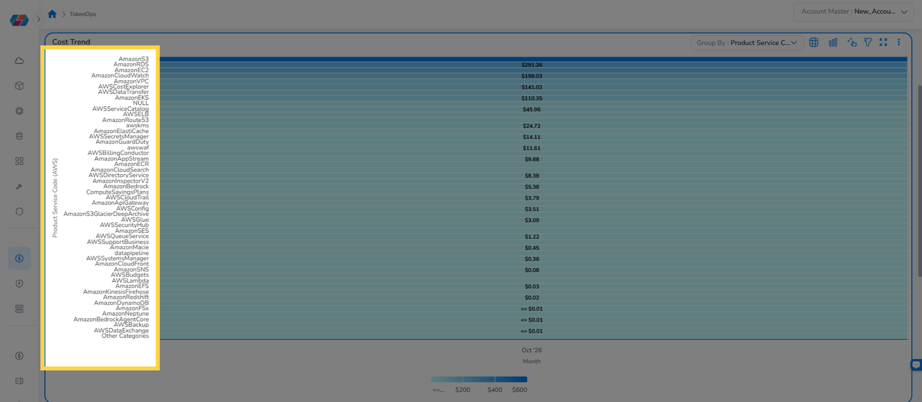
Tip: Hover over any bar to see the exact cost and usage period for that item.
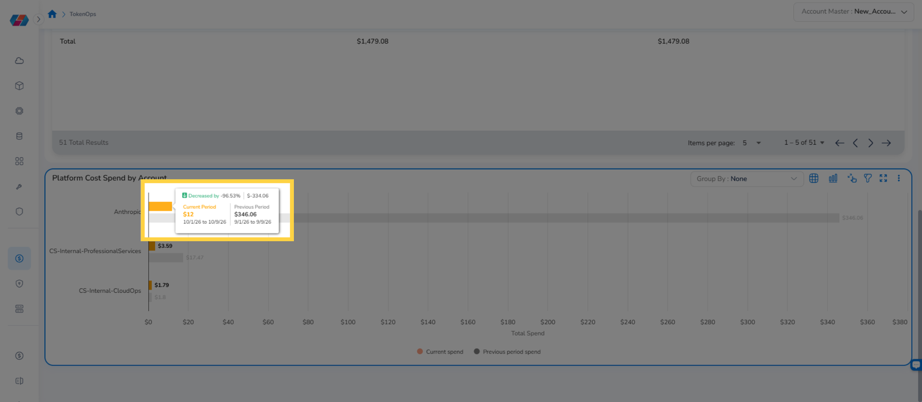
The Platform Cost Spend by Account widget, further down the dashboard, compares current period spend with previous period spend for each account. Hover over a bar to see both amounts, their date ranges, and the change between them.
Drilling Down Into AI Spend
Drill into a bar to see how that item’s spend is distributed across accounts. Click a bar in the Cost Trend widget. The Cost Trend Drilldown panel opens with the Cost Spend by Account widget.
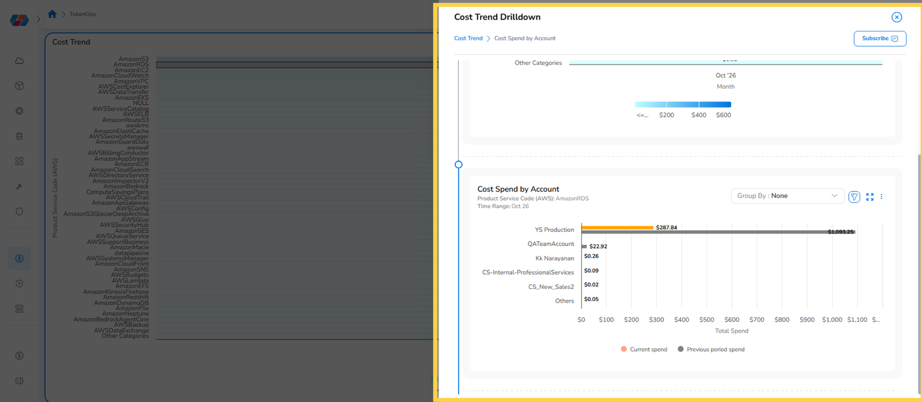
The widget compares current spend with previous period spend for each account, for the item and time range you selected. Its header shows the selected item and time range. Use the breadcrumb at the top of the panel, such as `Cost Trend > Cost Spend by Account, to see your drilldown path.
Subscribing to a Drilldown Report
Subscribe to a drilldown to receive it by email on a schedule. Open the drilldown you want to receive, then follow these steps:
Step 1: Open the subscription form
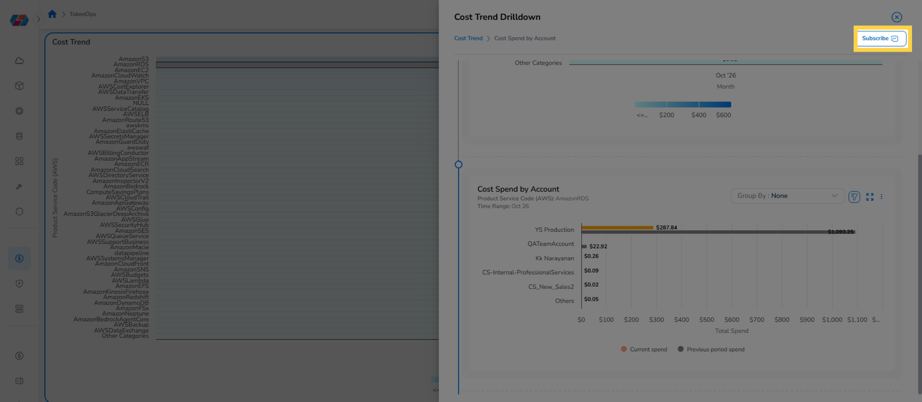
Click Subscribe at the top right of the Cost Trend Drilldown panel. The Subscribe Drilldown form opens, showing the name of the drilldown you are subscribing to.
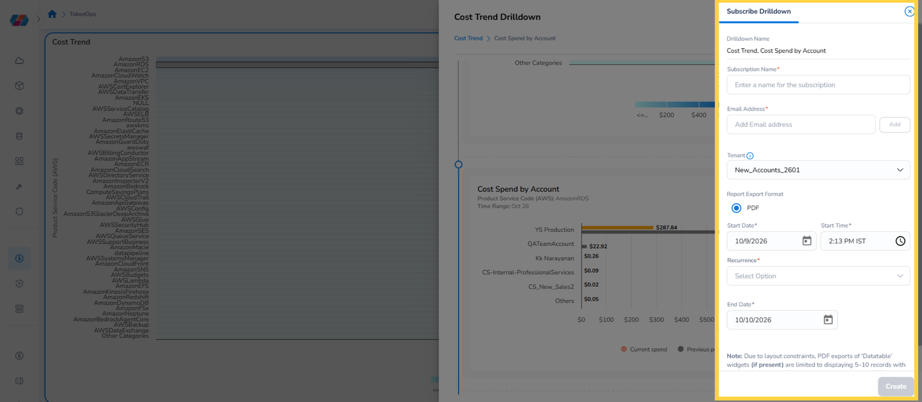
Step 2: Enter the subscription details
Enter the following details. Fields marked with an asterisk are required.
-
Subscription Name: A name that identifies this subscription.
-
Email Address: Each recipient’s email address. Click Add after each address.
-
Tenant: The tenant whose data the report includes.
-
Report Export Format: The report format. Chart widgets export as PDF.
-
Start Date and Start Time: When the first report is sent.
-
Recurrence: How often the report is sent.
-
End Date: The last date on which the report is sent.
Note: PDF exports of Datatable widgets are limited to a small number of records due to layout constraints.
Step 3: Save the subscription
Click Create. CoreStack saves the subscription and sends the report to your recipients on the schedule you set.
Tip: For dashboard-level subscriptions and recurrence options, see Subscribe, Edit, and Unsubscribe Dashboard Email.
Configuring a Token-Based Consumed Unit
Set a Consumed Unit on a Platform Cost Trend (New) or Platform Summary widget to show Usage and Rate as token counts. Each widget supports one Consumed Unit. Follow these steps:
Step 1: Open the widget configuration
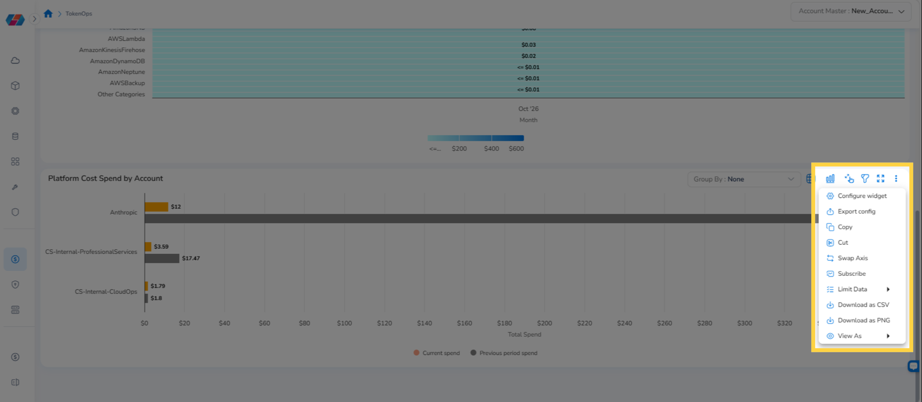
Click the vertical ellipsis (⋮) in the widget header, then select Configure widget.
Step 2: Enable Override Filters
Open the Data Binding tab and turn on Override Filters. A filter Key/Value pair appears.
Step 3: Select the Consumed Unit
Set the Key to Consumed Unit. Set the Value to the token unit for your provider, from the table below.
| Provider | Consumed Unit values |
|---|---|
| AWS | Units, 1K Tokens, 1M Tokens |
| Azure | 1K, 1M, 1/Month (for PTU — Provisioned Throughput Units), 1/Hour (for Provisioned Managed Global Unit) |
| GCP | Count |
Note: Azure and GCP Consumed Units are active for standard onboarded cloud accounts, regardless of AI Service integration status. For AI Services integrations, Consumed Units are confirmed for AWS Bedrock.
Step 4: Set the Primary metric
On the Cost Trend (New) widget, select Cost, Usage, or Rate as the Primary metric. The Primary metric renders as bars, and the other two render as lines. Keep all three visible for token analysis.
Step 5: Save the configuration
Save the widget configuration. Usage and Rate now show token counts instead of cloud-usage units such as GB or vCPU-Hours.
Widget Controls
The following controls are available in the header of both the Cost Trend and Platform Cost Spend by Account widgets.
| Control | What it does |
|---|---|
| Table View | Shows the widget data as a table. |
| Chart View | Returns the widget to the chart display. |
| Drilldown | Lets you select a data point to drill down and refine the data. |
| Filter | Narrows the data shown in the widget. |
| Expand | Opens the widget in a larger view to show data hidden by limited space. |
| More actions (⋮) | Opens Configure widget, Export config, Copy, Cut, Swap Axis, Subscribe, Limit Data, Download as CSV, Download as PNG, and View As. |
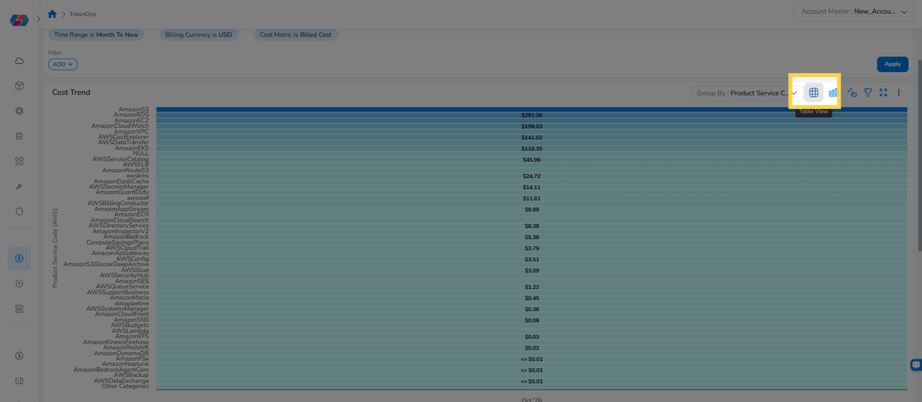
Use View As to switch chart types for AI services data.
Frequently Asked Questions
Q: Why don’t I see Usage or Rate on my AI service widget?
The widget has no Consumed Unit set, so it shows Cost only. Set one by following Configuring a Token-Based Consumed Unit.
Q: How do I see spend for a single AI model?
Click Group By in the Cost Trend widget and select AI Model Name. Each bar then shows one model. Click a bar to drill into that model’s spend by account.
Q: What does the Rate metric represent?
Rate is the average cost per unit of consumption, such as cost per 1,000 or 1 million tokens. It is recalculated for the Time Range and Granularity you select.
Q: Can I track more than one Consumed Unit in the same widget?
No. Each widget supports one Key/Value pair in Override Filters. Add a separate widget for each Consumed Unit you want to compare.
Q: Does a drilldown subscription include the whole dashboard?
No. It includes only the drilldown you subscribed from, such as Cost Trend > Cost Spend by Account. To receive the full dashboard, use a dashboard-level subscription instead.
Q: Why isn’t my Claude API usage broken down by Agent or API key?
TokenOps does not attribute Claude API usage to Agents or API keys. Use Governance > AI Services > Frontier AI for that view.
Troubleshooting
No data appears on the widget
Cause: The widget has no Consumed Unit selected, or the AI service account hasn’t finished onboarding.
Solution:
-
Confirm that the AWS account with Bedrock enabled is onboarded and active in CoreStack.
-
Allow up to 24 hours for auto-discovery to complete.
-
Open the widget’s Data Binding tab and confirm that Override Filters is on, with Consumed Unit and a Value selected.
If the issue persists, contact CoreStack support with the dashboard name, the AWS account ID, and the Consumed Unit value you selected.
Rate shows no variation over time
Cause: Pricing hasn’t changed for the selected model in the chosen time range, or the Granularity is too coarse to show short-term changes.
Solution:
-
Group by AI Model Name to isolate a single model’s rate trend.
-
Select a finer granularity, such as daily instead of monthly.
The Subscribe button is not available
Cause: Your role doesn’t have the Subscribe access right.
Solution:
-
Ask a FinOps Account Admin or FinOps Tenant Admin to add the Subscribe access right to your role under
Settings > Roles. -
Reopen the drilldown panel. The Subscribe button now appears.
If the issue persists, contact CoreStack support with your role name, tenant name, and a screenshot of the drilldown panel.
TokenOps is missing from the FinOps menu
Cause: Your role doesn’t include FinOps access, or FinOps isn’t enabled for your tenant.
Solution:
-
Confirm that you have the FinOps Practitioner or FinOps Admin role.
-
Ask your FinOps Account Admin to confirm that FinOps is enabled for your tenant.
Updated about 1 month ago