

Monitoring and Alerts
Introduction
Monitoring your cloud resources is critical to ensuring the availability of your resources and positioning yourself to take proactive action before failure scenarios occur. The platform helps in automatically configuring monitoring metrics in your cloud native monitoring mechanisms (e.g. Amazon CloudWatch, Azure Monitor) for all your resources. What's more, you will also get alerts from the platform when the set thresholds are exceeded.
This user guide covers the configurations associated with managing monitoring and alert rules for cloud resources.
The platform helps with automated configuration of alerts in your native cloud monitoring solution, and sends alerts in scenarios where set threshold limits are exceeded for the associated cloud account.
Let’s use CPU Utilization as an example. You can set an alert stating that CPU Utilization above a threshold limit of 90% should be flagged. This alert will be sent as an email to the configured mail addresses.
You can create alert rules for one or more specific resource activities with preferred threshold limits.
Navigation
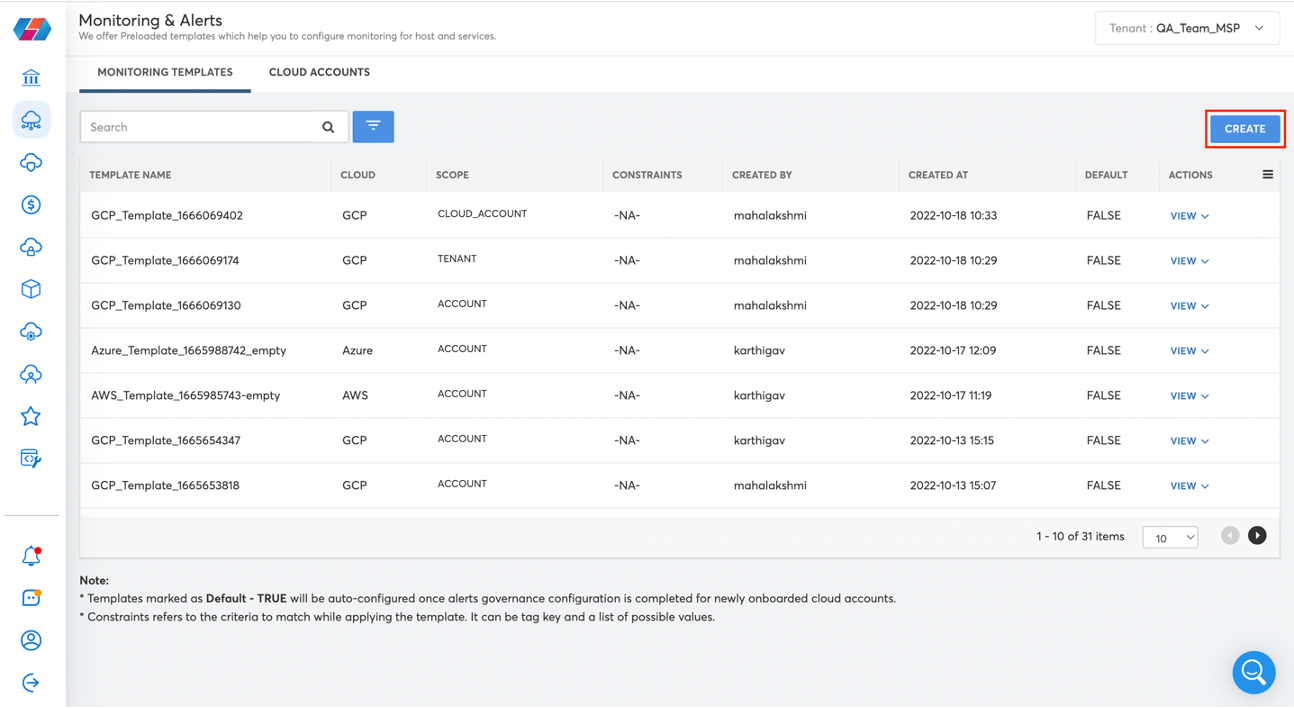
Click on Operations in the left navigation menu and select Monitoring & Alerts to view the Monitoring Services – Alert Rules screen.
Creating a New Monitoring Template
- To create a new monitoring template, click Create.
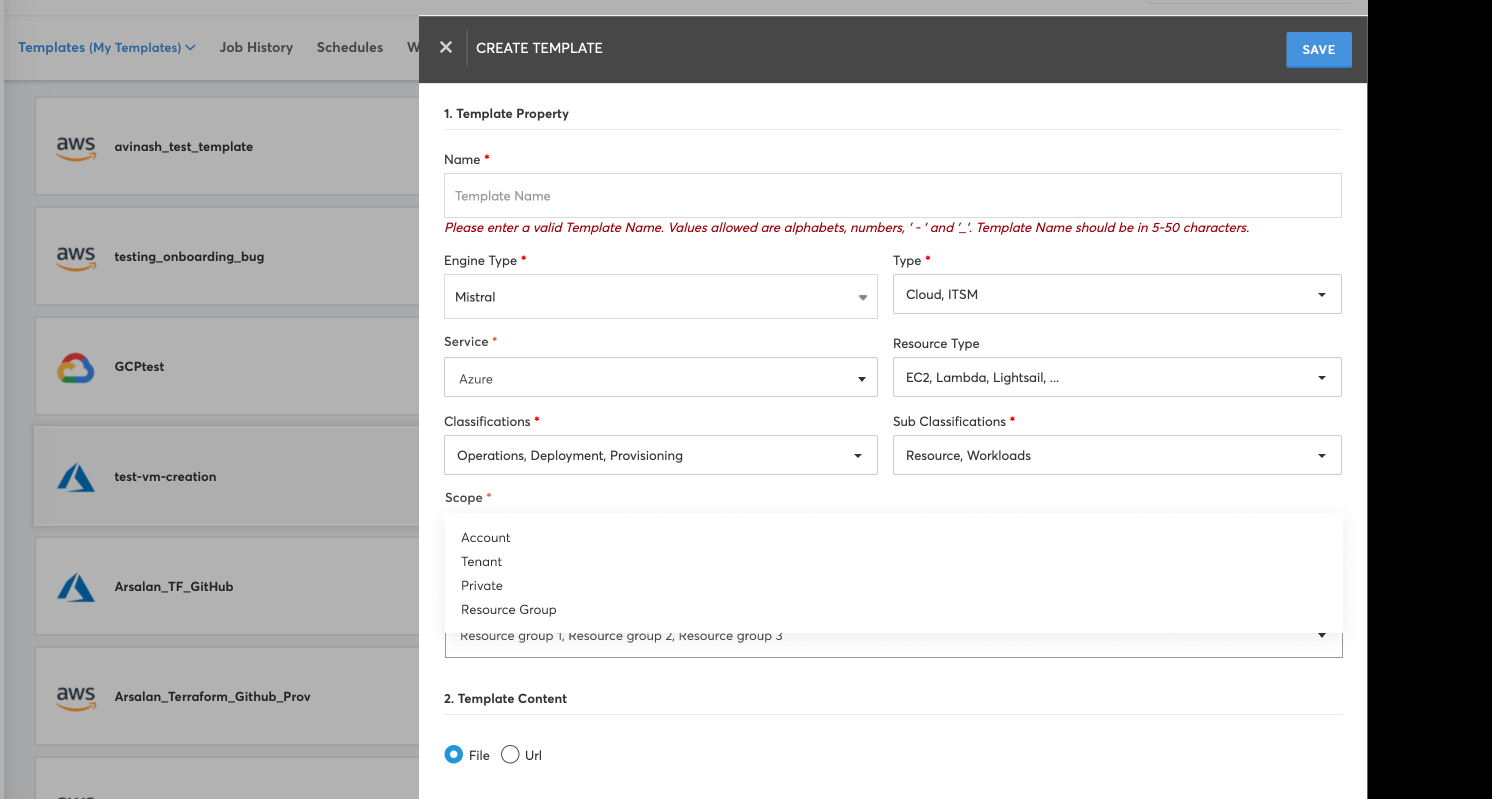
The CREATE TEMPLATE dialog box will display now.
- The following information needs to be entered to create a new monitoring template.
| Field | Description |
|---|---|
| Name | Type the template name. |
| Engine Type | Select the type of engine for the template. |
| Type | Select the relevant option. |
| Service | Select the type of cloud provider. |
| Resource Type | Select the types of resources. |
| Classification | Select the options for template classification. |
| Sub Classifications | Select the sub-classification. |
| Scope | Select the scope for the template. For AWS, the option Region, and for Azure, the option Resource Group have been newly added. |
| Template Content | Select either File or URL. |
-
When checked, the Mark as Default option will consider the newly created template as the default template, and it will be applied whenever a new cloud account is onboarded.
-
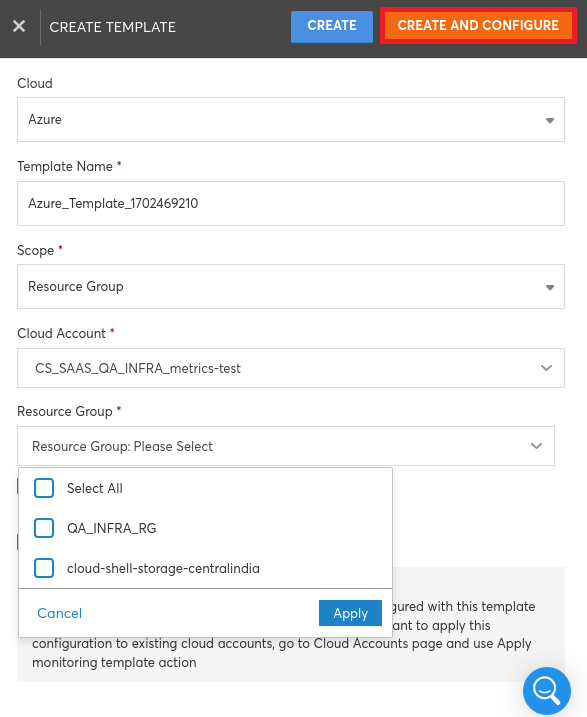
Click Create and Configure to create the template and go to the next page to configure the alerts.
-
Alerts can be configured for different categories as shown in the below image.
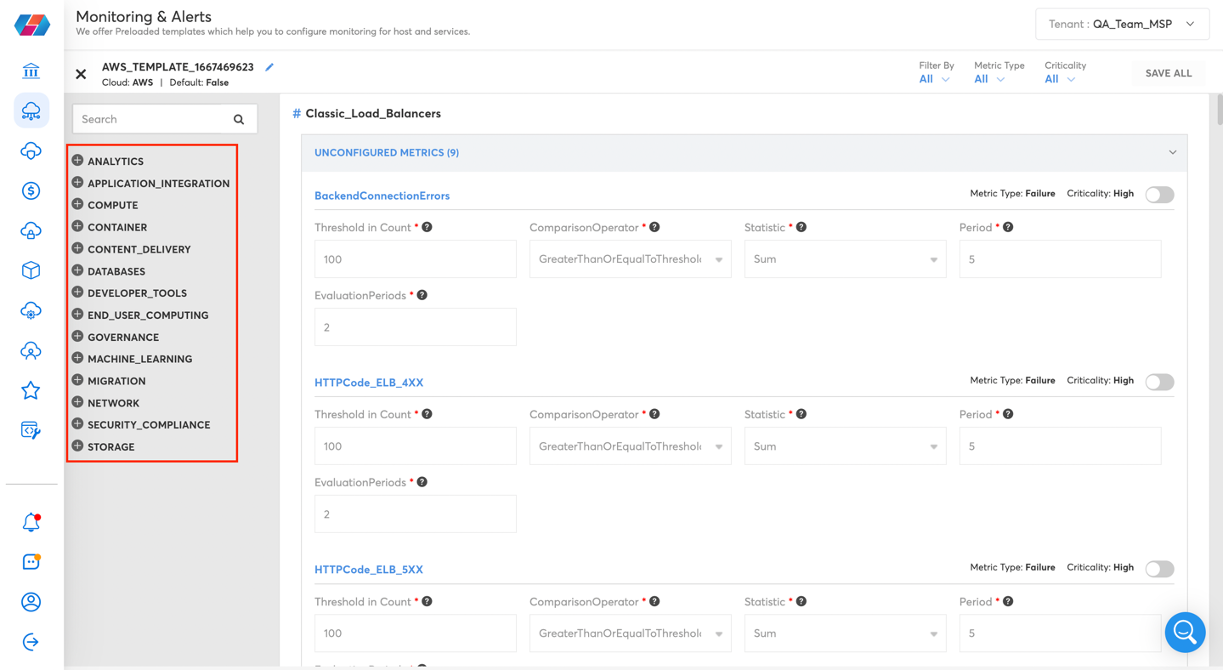
-
The required alert can be enabled and configured by switching the toggle switch.
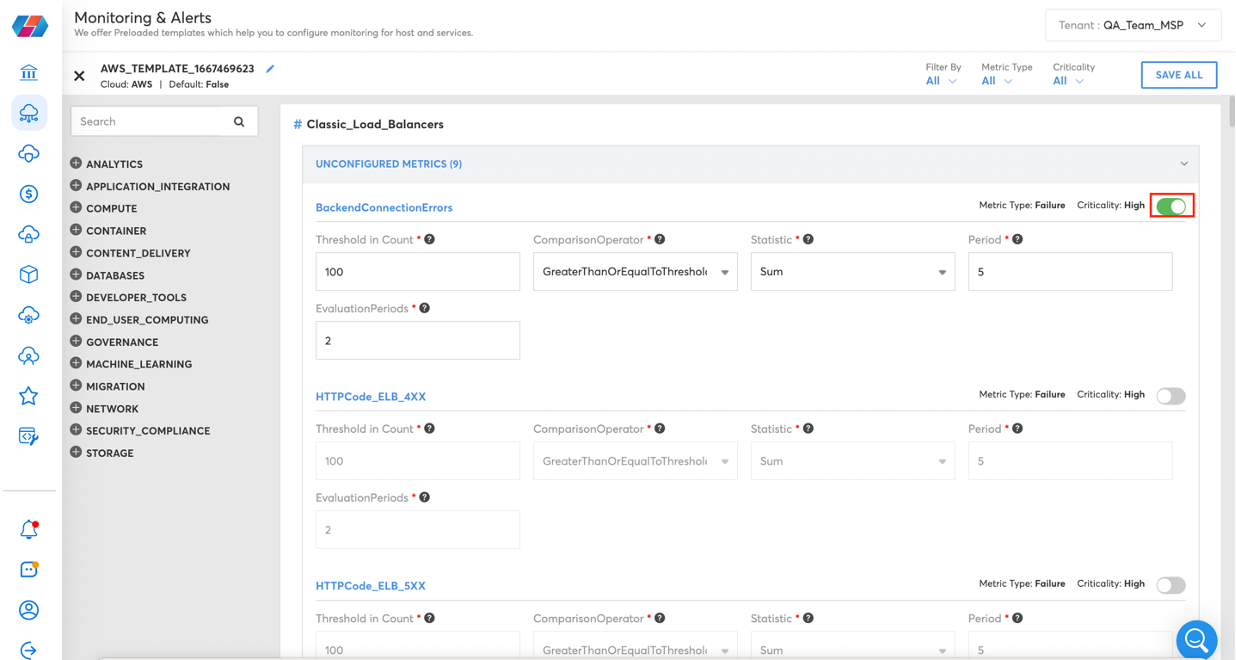
-
After the required alerts are enabled and configured, click SAVE ALL to save the alerts in the template that is created.
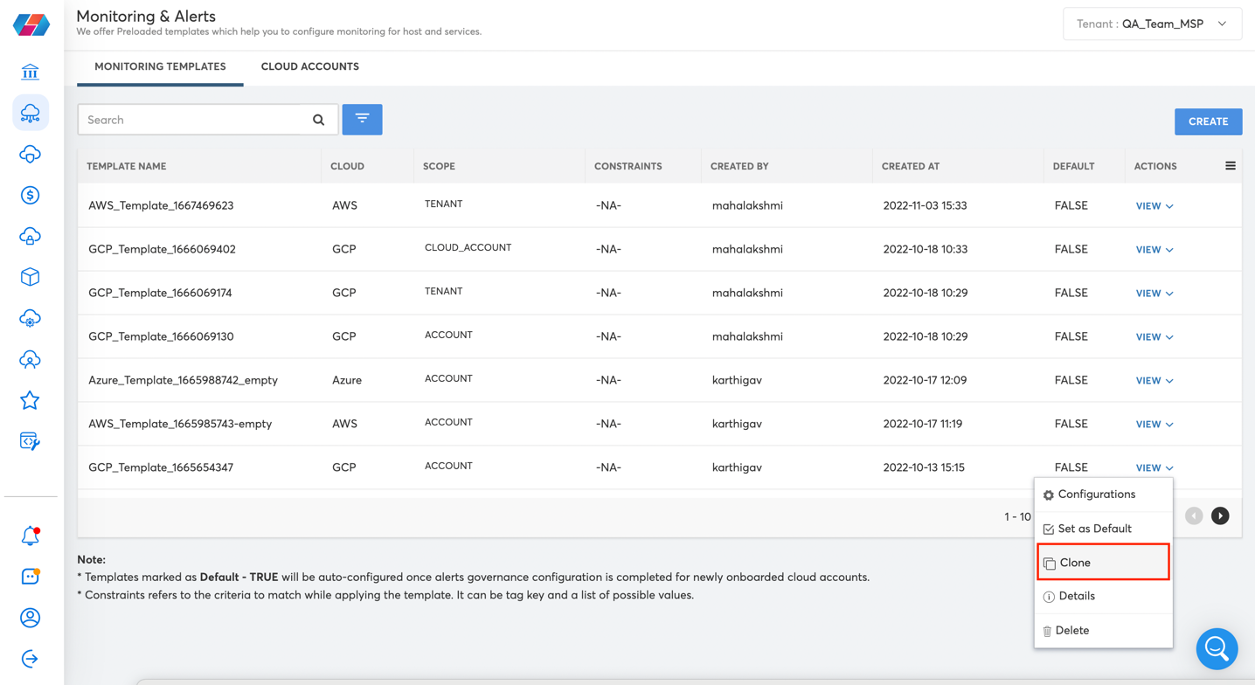
Cloning a Monitoring Template
An existing template can be cloned and edited to create a new template with a customized configuration.
To clone a template, the following steps need to be followed:
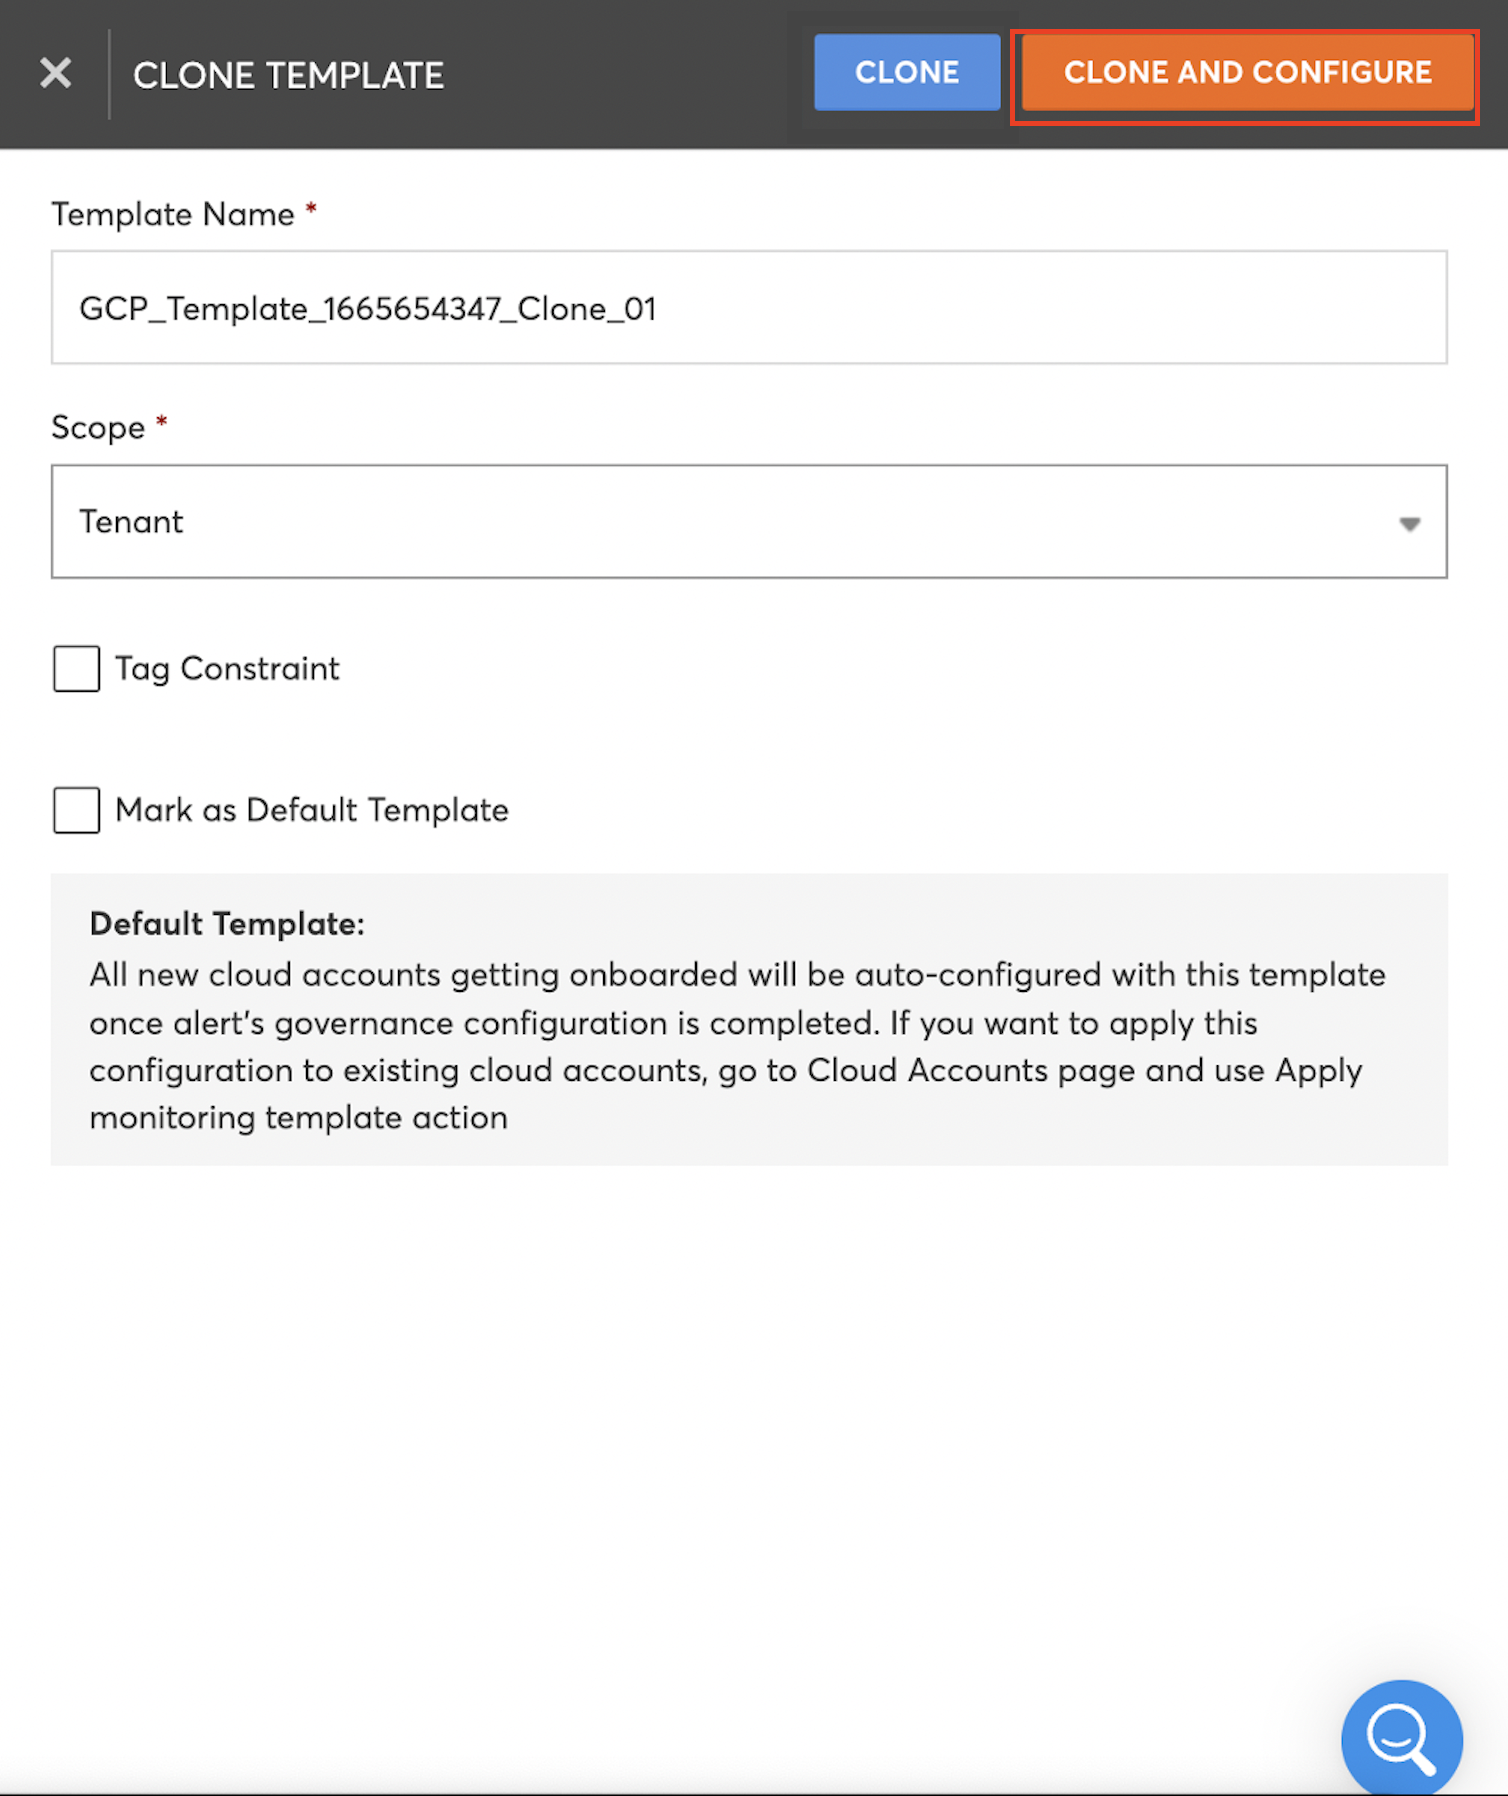
-
In the Actions column for a listed template, click on the “View” option and then click on the “Clone” option.
-
Enter the name of the cloned template and update the scope, select the “Tag Constraint”, and ”Mark as Default Template” if required.
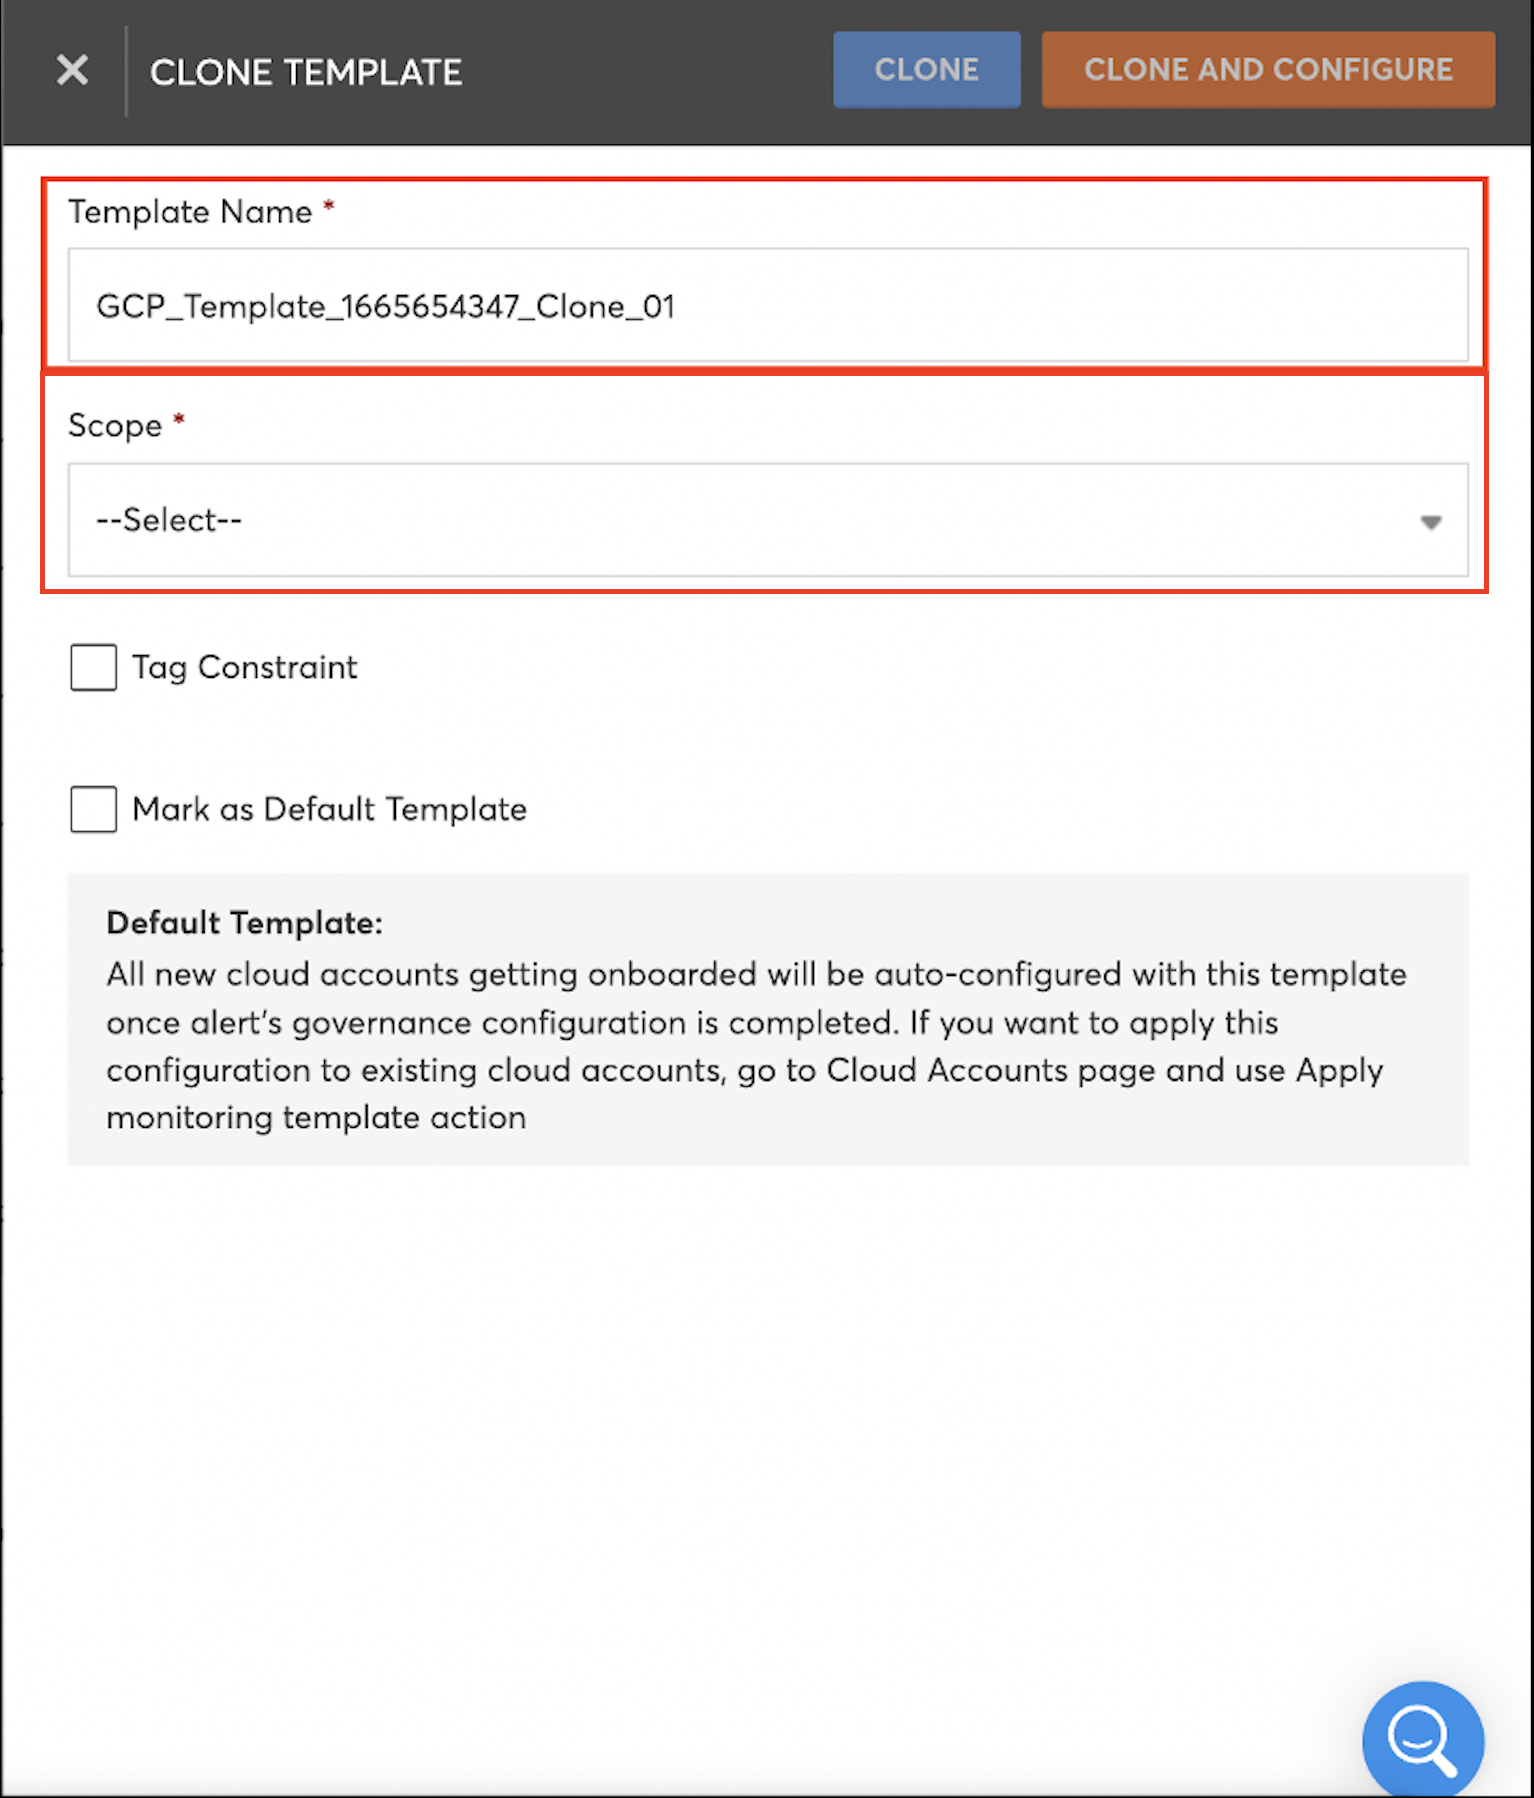
Note: Detailed explanations of “ Tag Constraint” and “ Mark as Default Template” can be found in the “Creating a Monitoring Template” section.
-
Click on “ Clone” to create the new cloned template.
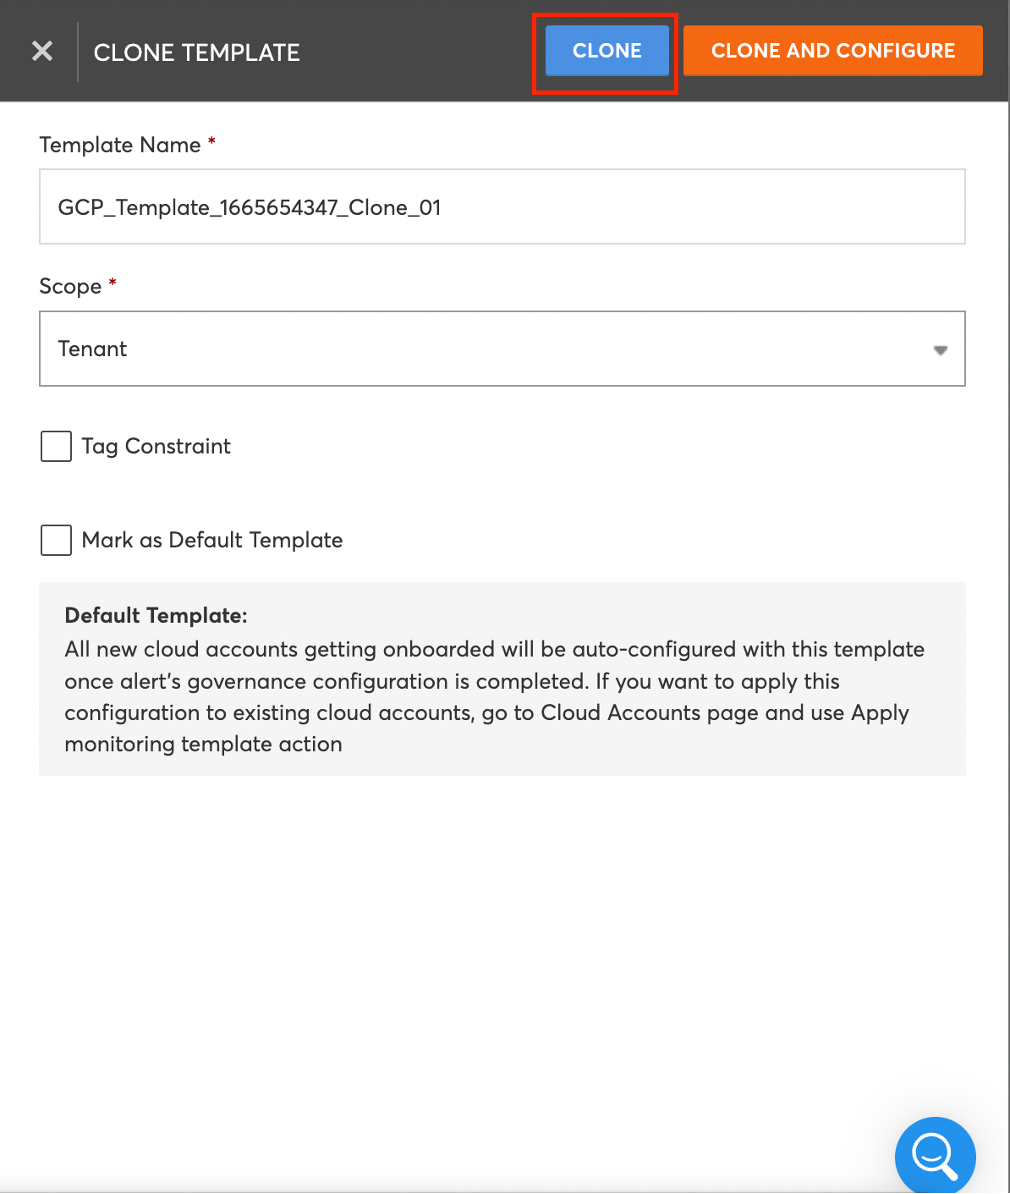
- Click on “Clone and Configure” to create the clone template and then configure the custom alert configurations.
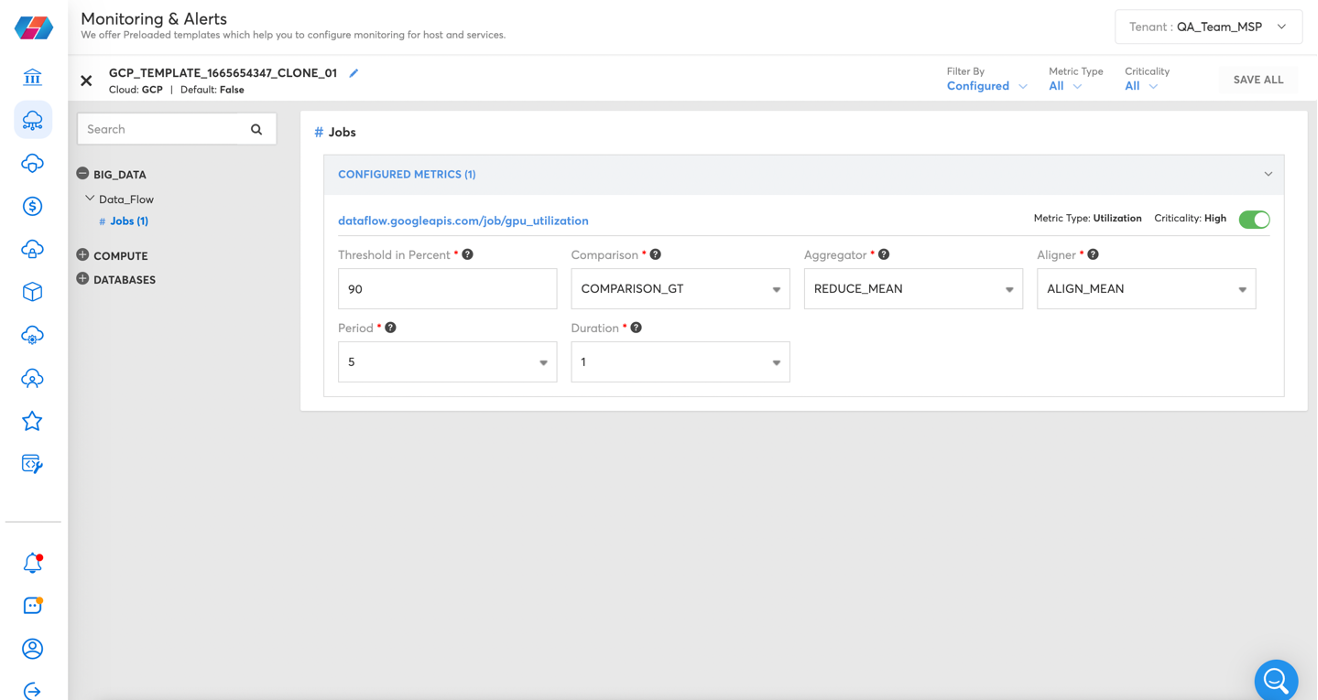
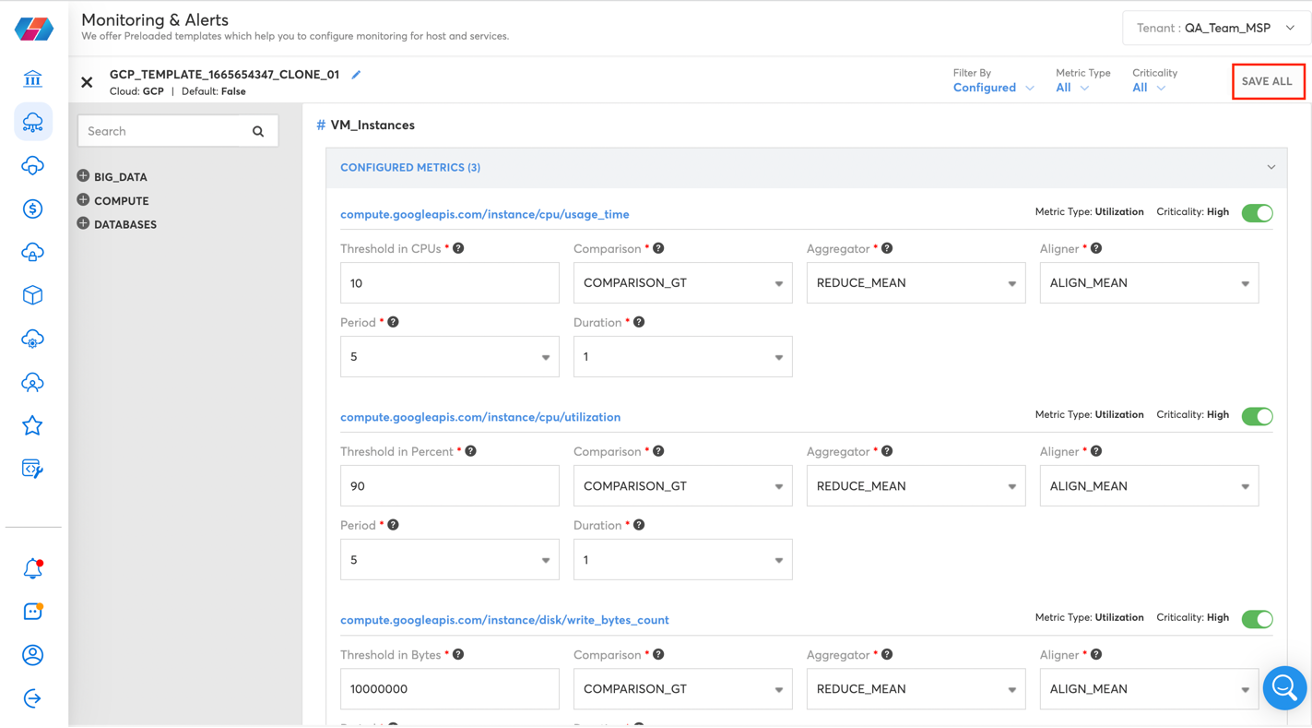
-
Enable and configure the alerts by moving the toggle switch.
-
After the alerts are enabled and configured, click on the “Save All” option to save the alert configuration.
Applying Monitoring Template to Cloud Accounts
Existing monitoring templates can be assigned to cloud accounts. In order to do this, the following steps need to be followed:
-
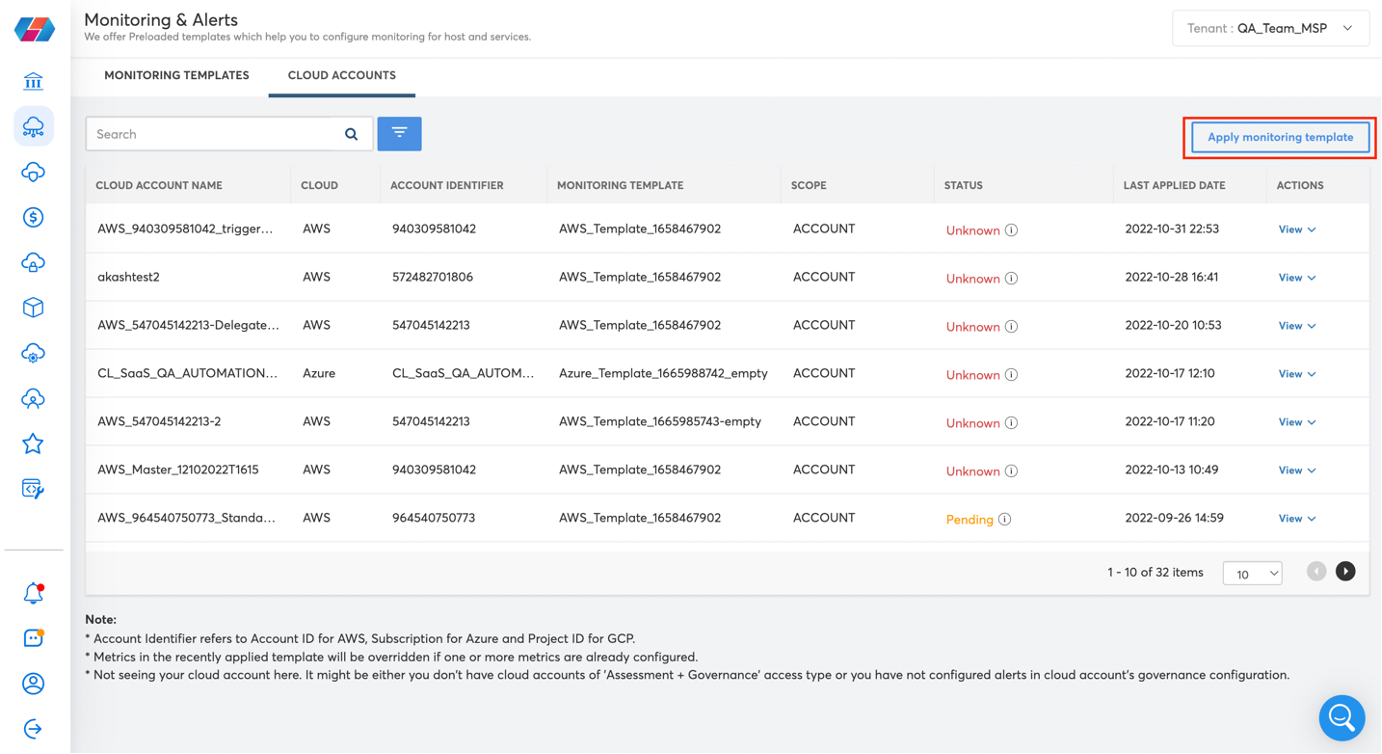
On the Monitoring & Alerts page, click on the “Cloud Accounts” tab as shown below.
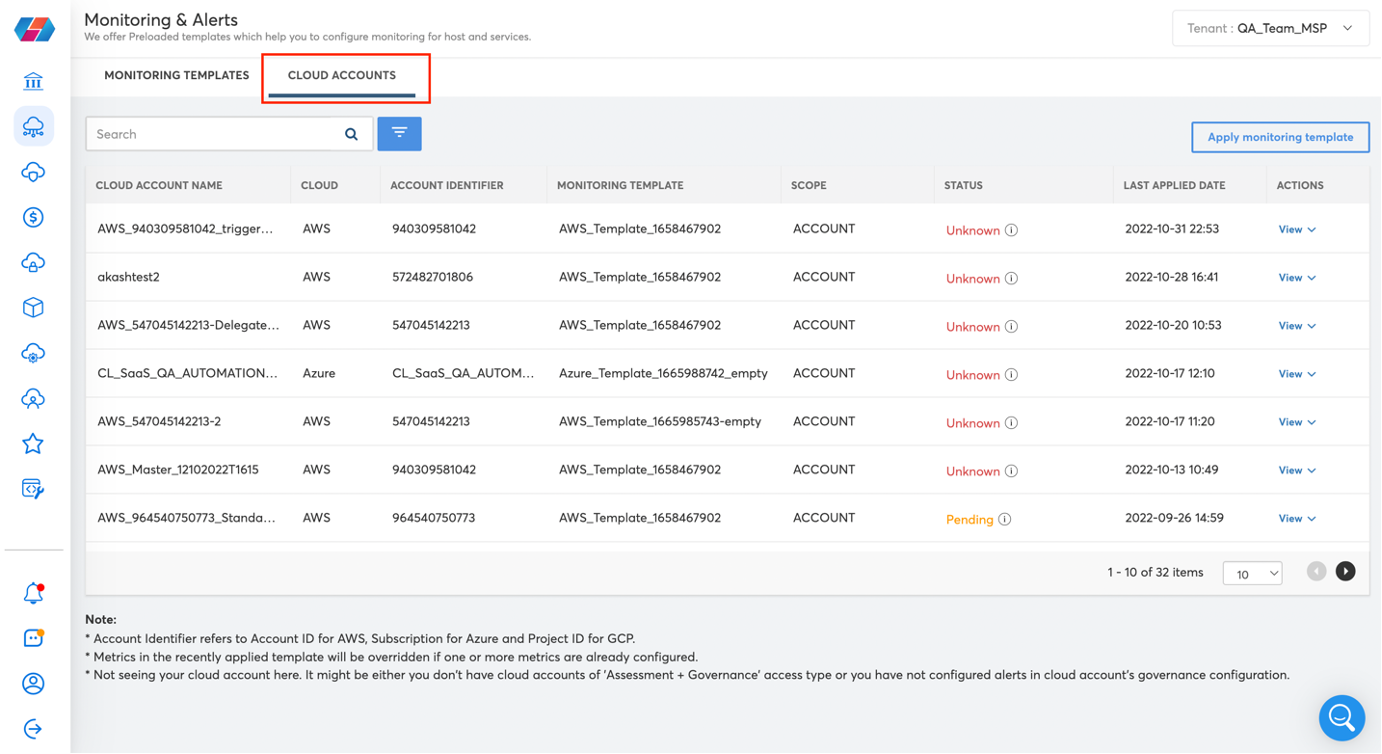
-
Select “ Apply monitoring template”.
-
After clicking “Apply Monitoring Template,” the below screen will be displayed and the necessary information will need to be entered.
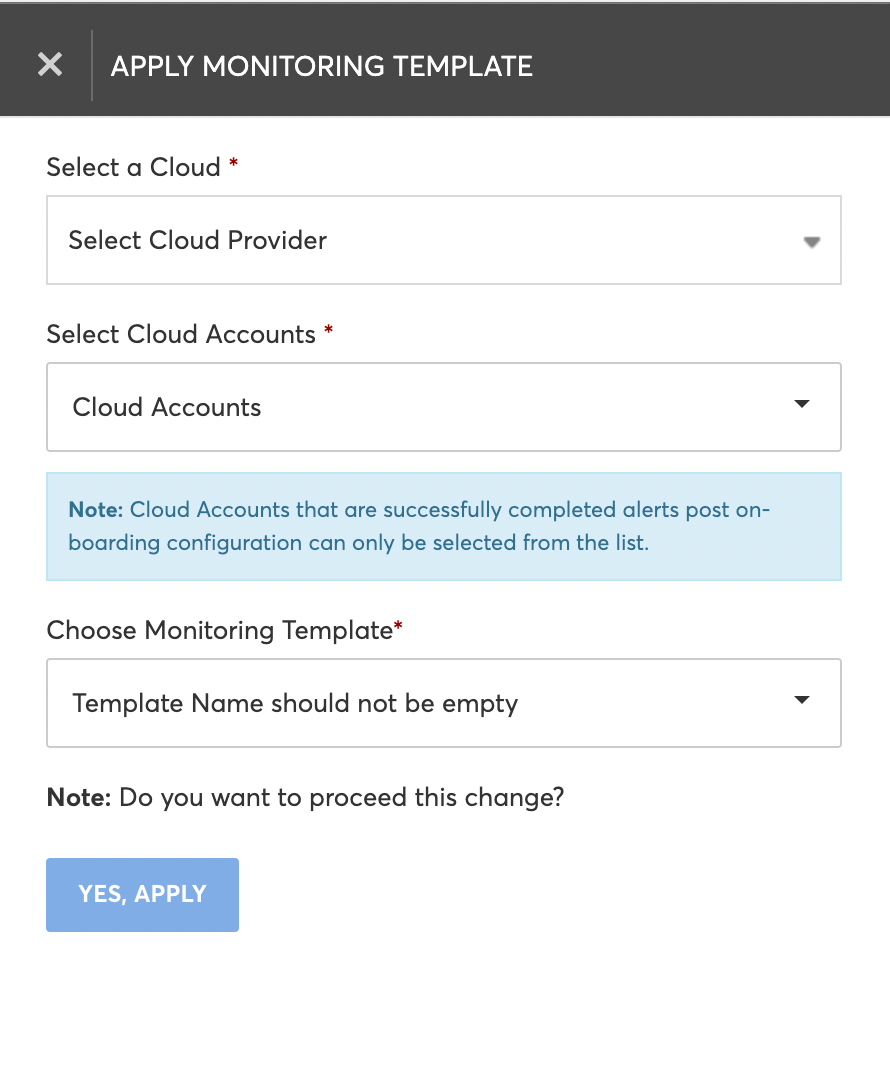
| Field | Description |
|---|---|
| Select a Cloud | Select the required cloud provider from the drop-down list. |
| Select a Cloud account | Select the cloud account to which the template needs to be added. |
| Choose Monitoring template | Select the monitoring template which needs to be assigned to the cloud account. |
- After the required information is entered, click on “Yes, Apply” and the monitoring template will be added to the cloud account.
Viewing Monitoring Alerts
You can view the monitoring alerts in the following places:
- By receiving email alerts when the specified thresholds are exceeded.
- By receiving alerts in other applications configured using the webhook option.
- The Operations Posture Dashboard lists the monitoring alerts that were activated and unresolved within the last 24 hours. You can view these at the Tenant or Cloud Account level and drill down further to view more details.
- The Reports option in the Left navigation menu has the following reports in the Monitoring Analytics section. These reports provide a view of all monitoring alerts that happened in your cloud accounts for any selected time period. You can further slice and dice the data presented in these analytics reports and export as CSV file if required.
- AWS Monitoring Alerts
- Azure Monitoring Alerts
- Multi-Cloud Monitoring Alerts
Alarm Suppression and ITSM Suppression
In the platform, users can set up alarms for different scenarios. Users also have the functionality to suppress alarms for incidents.
Every alarm set up in the platform triggers alerts, and those alert instances are logged in an ITSM tool. All incidents are sent to users as notifications through emails and ITSM tickets integrated with the platform, so users can take further actions to resolve any issues. For instances where alarms need to be suppressed, users can select a particular alarm or select a group of alarms and suppress them.
Suppressing the alarm will suppress alerts and will also suppress the creation of incident tickets in the ITSM tool. An alarm that is suppressed can be activated later.
Perform the following steps to suppress alarms:
-
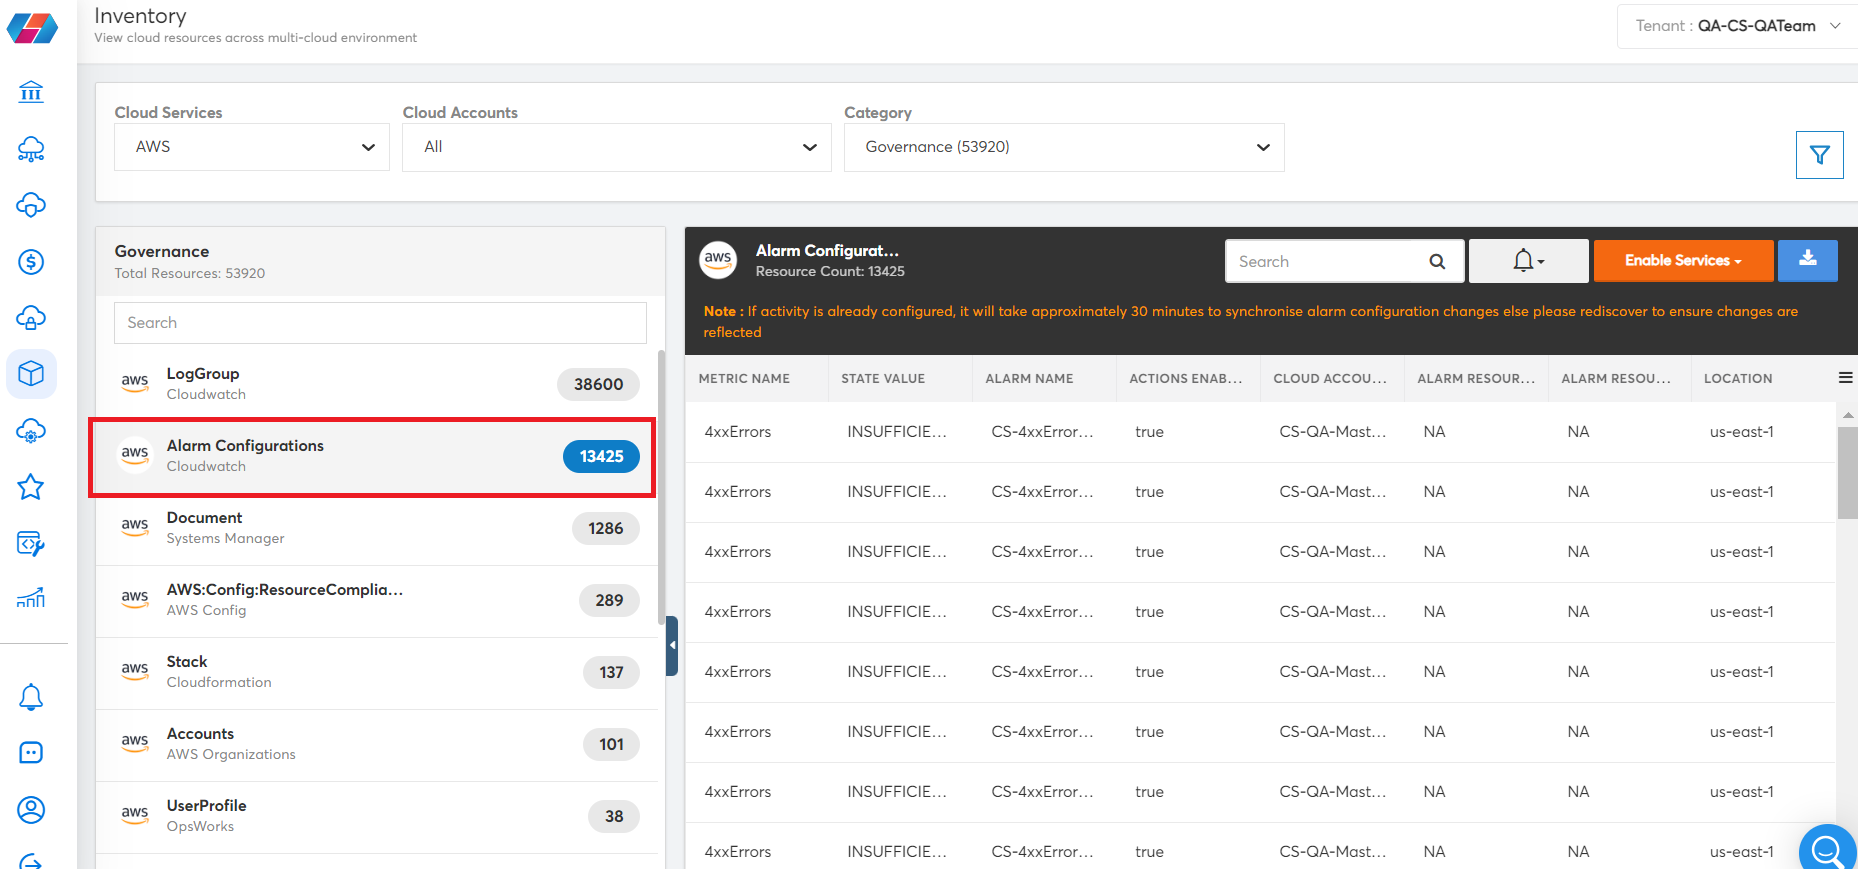
Login to the platform and go to Resources > Inventory.
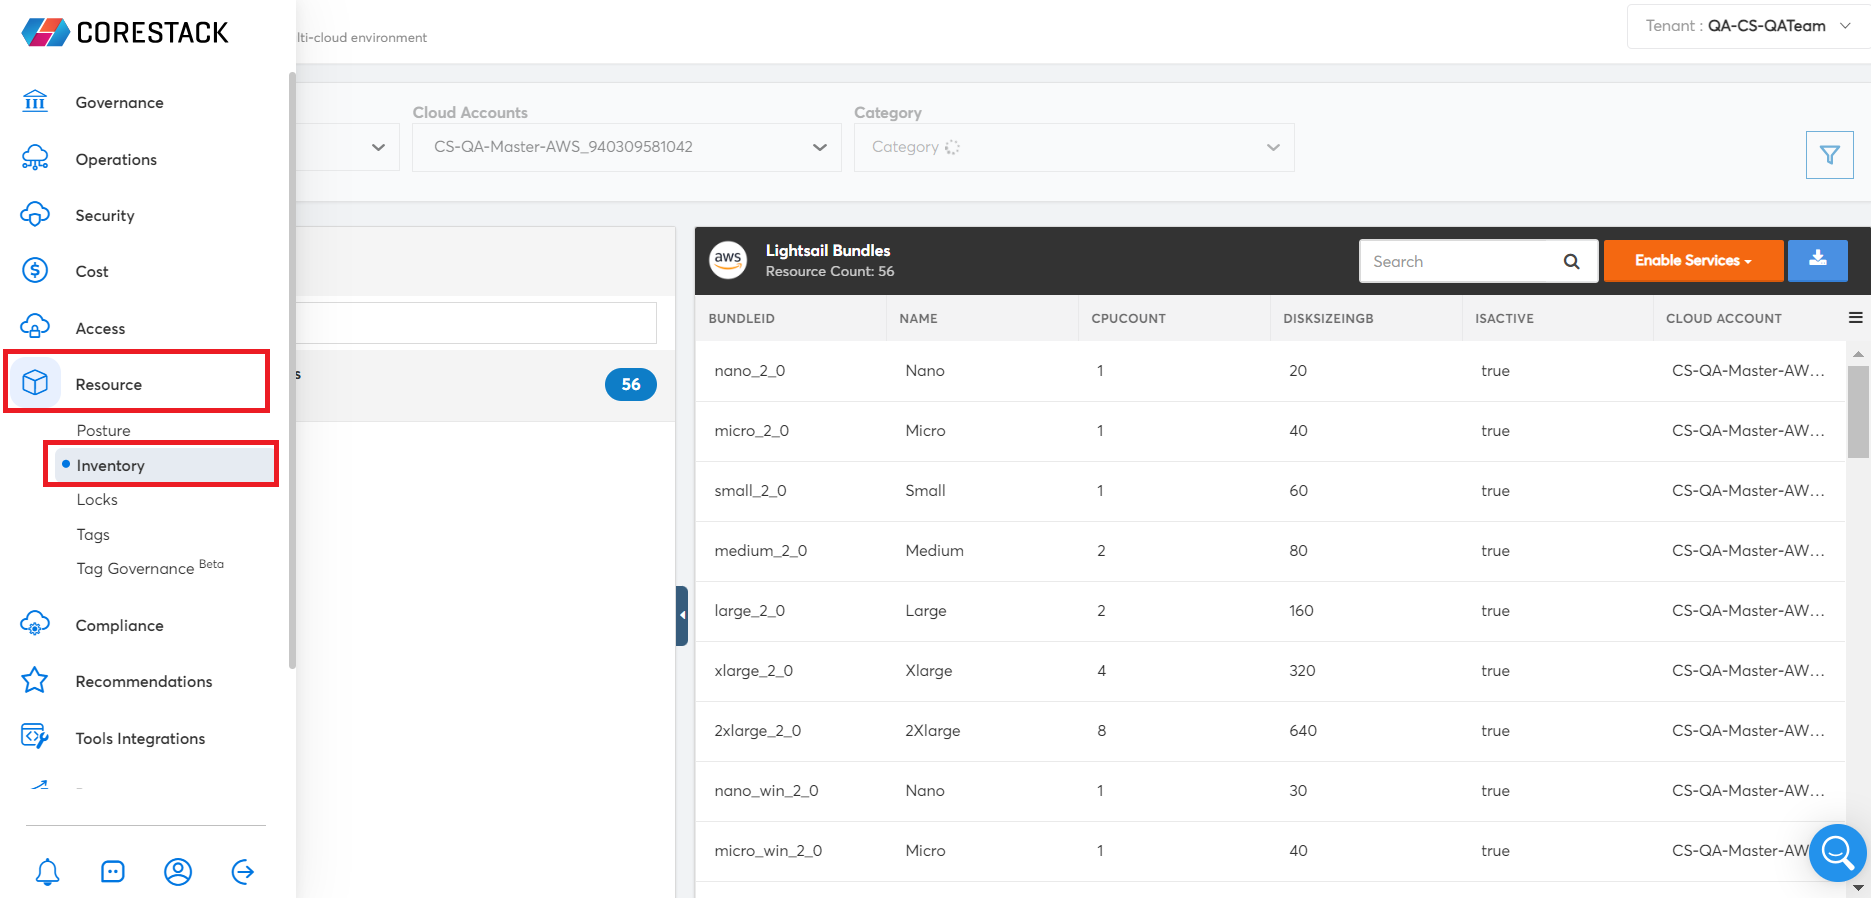
-
In the Cloud Services list, click to select AWS and click Apply, if not selected already.
-
In the Category list, click to select Governance, and click Apply.
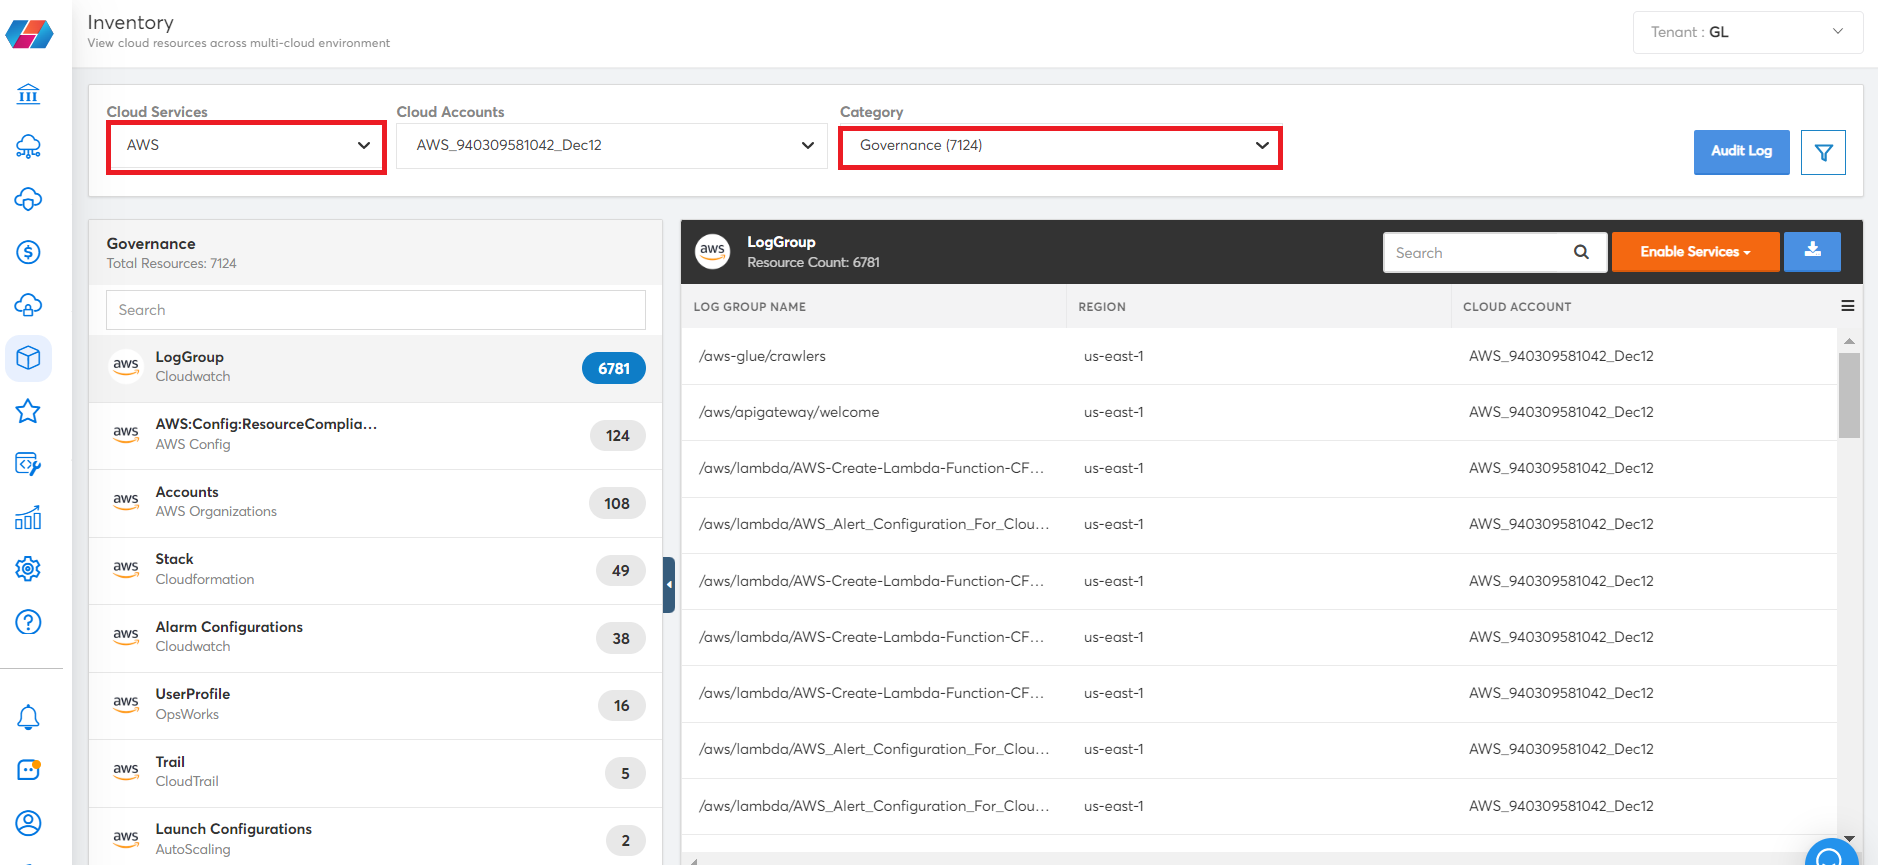
-
On the left pane, click to select Alarm Configurations.
-
Click the bell symbol and then click Disable(50).
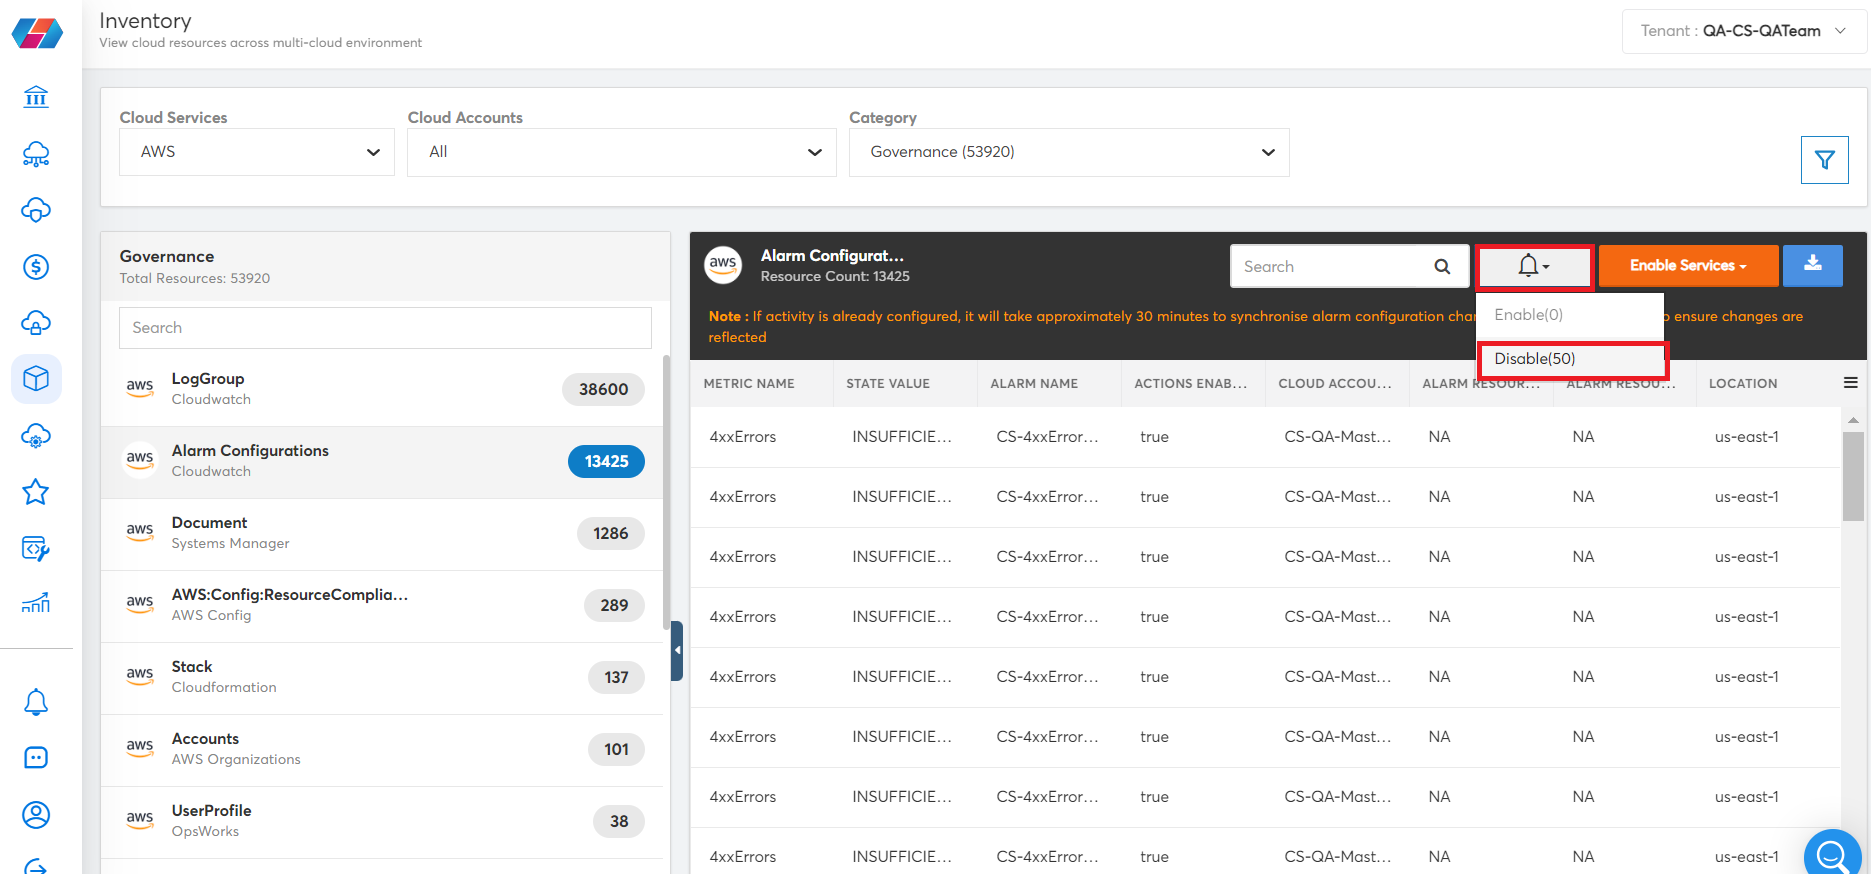
The Disable Alarm configurations dialog box appears.
- Fill the following fields in the dialog box and click Disable.
- In the Region list, click to select a region and click Apply.
- In the Alarm Configurations list, click to select the alarms that need to be suppressed and click Apply. You can choose the Select All option from the list to suppress all alarms in the list.
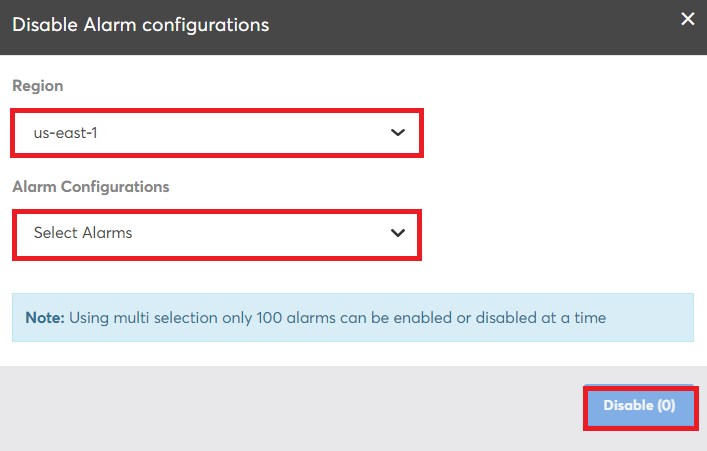
This configuration suppresses the selected alarms. Note that only 100 alarms can be suppressed at a time.
- Click the arrow at the bottom-right corner of the screen to navigate to the next page and view the next 50 alarms.
- Follow the above steps to suppress all relevant alarms.
Users can also click an alarm and in the ACTIONS list, select Disable Alarm Actions to disable or suppress the selected alarm.
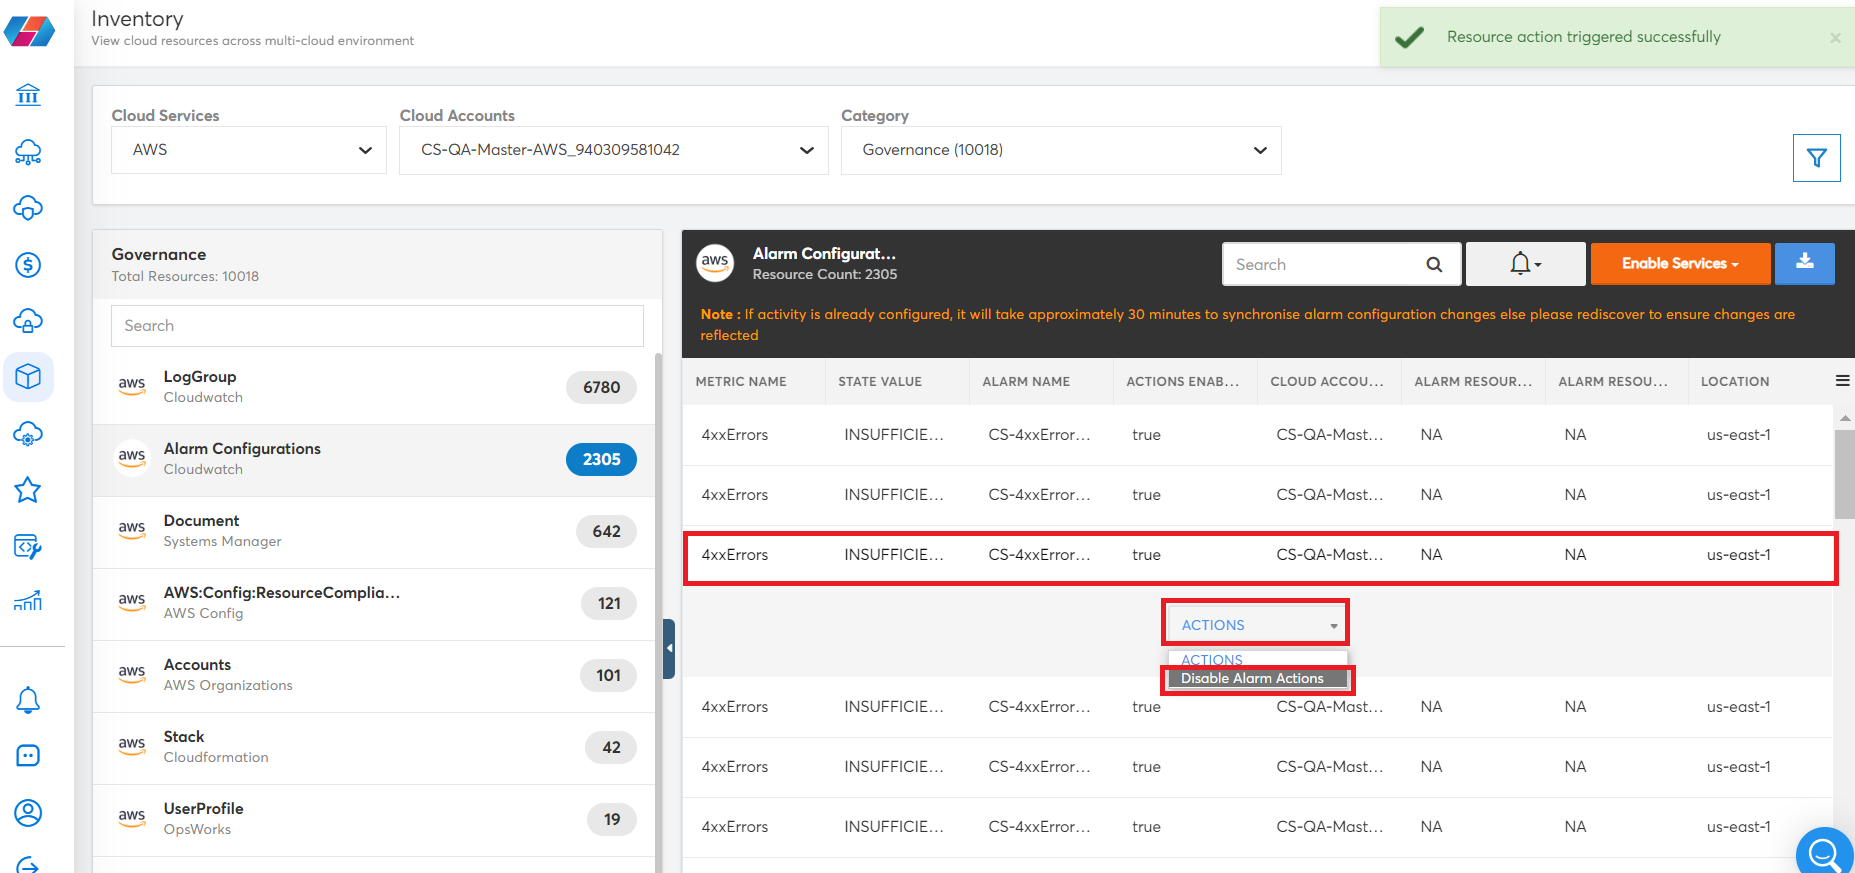
Note:It will take approximately 30 minutes for alarm configuration changes to synchronize and be reflected in the system.
Updated 9 months ago