

Infrastructure Issues - by Severity and Account
This user guide provides step-by-step instructions to investigate cloud security issues by account using CoreStack Graphion Infrastructure Dashboard.
Feature Overview
The Infrastructure Issues – by Severity and Account widget is an interactive heatmap within CoreStack's Graphion module that displays security issue counts across cloud accounts, segmented by issue type — Vulnerabilities, Misconfigurations, and Threats. It is most relevant when security and operations teams need a consolidated, at-a-glance view of risk concentration across multiple cloud accounts without switching between individual account views.
This feature is most valuable to Security Analysts and SOC Engineers identifying high-risk accounts for immediate review, Cloud Account Owners and DevOps Leads monitoring their account's security posture, and CISOs and Security Managers requiring executive-level visibility into account-level risk distribution. The widget is a visualization and navigation tool — it does not perform remediation or automated response.
Note: The steps in this guide use Vulnerabilities as an example. The same workflow applies when navigating from Misconfigurations or Threats cells.
Note: Infrastructure Issues - by Severity and Account widget your organization has the appropriate product bundle and you have been assigned the appropriate roles and permissions. If the widget does not appear on the Cloud Security Dashboard, contact your Tenant Admin to confirm bundle activation and role assignment.
How It Works
CoreStack aggregates security issue counts from connected cloud accounts on a scheduled basis and surfaces them in the Infrastructure Issues – by Severity and Account widget as a colour-coded heatmap. Each row represents a cloud account, and each column represents an issue type — Vulnerabilities, Misconfigurations, or Threats. Colour intensity indicates count density, with darker cells reflecting higher issue concentrations. Hovering over a cell reveals a tooltip showing the account name, total count, and a severity breakdown. Selecting a cell navigates to the respective explorer for that issue type, pre-filtered for the selected account, where individual security issues can be reviewed, scored, and investigated for prevalence across the cloud estate.
Prerequisites
Before you begin, ensure the following:
- Roles and Permissions: You have the necessary roles and permissions assigned in CoreStack under the appropriate bundles.
- Cloud Accounts: At least one cloud account (AWS, Azure, or OCI) has been onboarded and scanned in CoreStack.
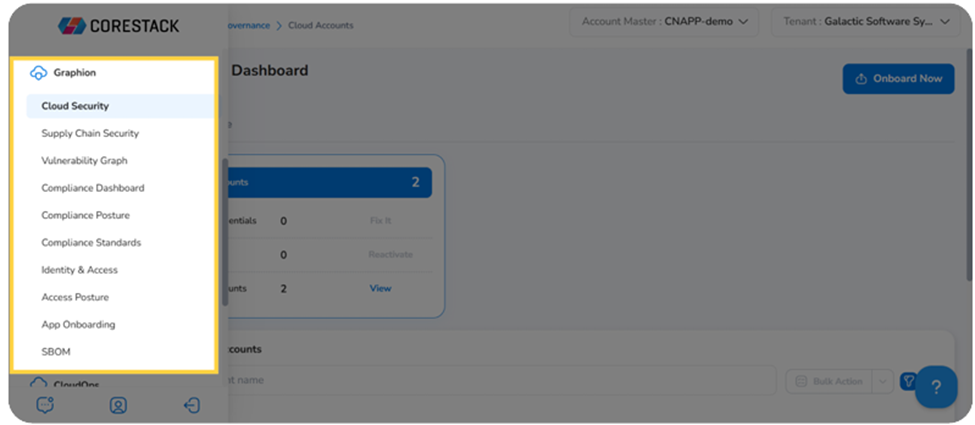
- Access: You can navigate to Graphion > Cloud Security > Cloud Security Dashboard using the CoreStack left navigation sidebar.
Using the Infrastructure Issues – by Severity and Account Widget
Navigate to Graphion > Cloud Security > Cloud Security Dashboard using the left navigation sidebar, then select Infrastructure Dashboard from the dashboard dropdown at the top of the page.
Scroll down to the Infrastructure Issues – by Severity and Account widget. The heatmap displays all active cloud accounts with non-zero issue counts, with columns for Vulnerabilities, Misconfigurations, and Threats.
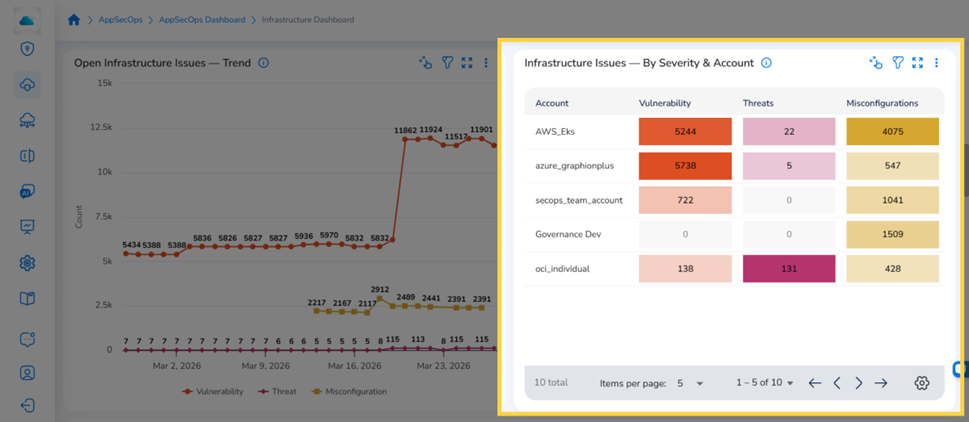
Infrastructure Issues – by Severity and Account widget displaying accounts with colour-coded issue counts
Step 1: View an Account's Security Issue Summary
Hover over any cell in the heatmap to see a tooltip showing the account name, total issue count for that cell, and a severity breakdown — Critical, High, Medium, and Low — along with a count of resources with no issues.
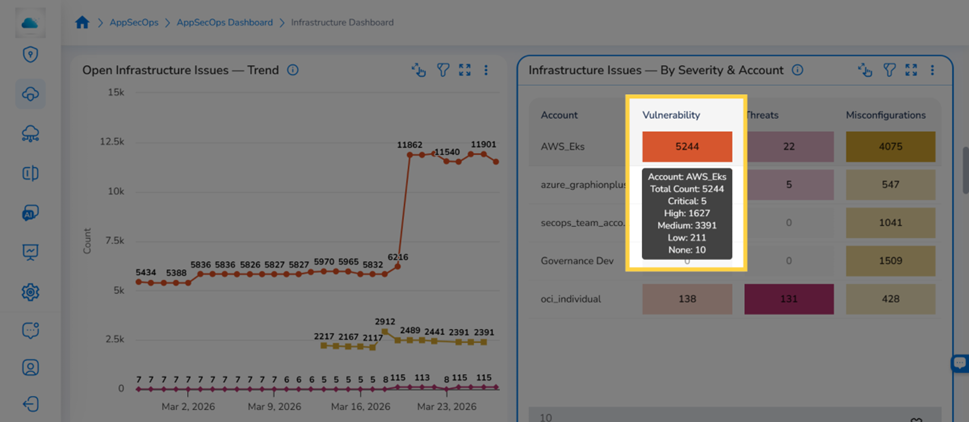
Tooltip showing account name, total count, and severity breakdown for a hovered cell
Step 2: Open the Security Issues Explorer for an Account
Select a cell under any issue type column for the account to investigate. The respective explorer opens, pre-filtered for the selected account. In this example, selecting a cell under Vulnerabilities opens the Infrastructural Vulnerabilities – Explorer.
The Explorer displays a full table of individual security issues. For Vulnerabilities, the columns include: Issue ID, Title, Finding ID, Issue Type, CVSS, Severity, EPSS, Is KEV, Description, Resource Category, Resource Type, Resource ID, Resource Name, Resource Group, Cloud Account, Region, Fix Availability, Prevalence, Recommendation, Detected At, Created Date, Modified Date, and Ingested Date.
In the Explorer table, locate the issue to investigate. Under the Actions column on the right side of the page, select View Details. The issue detail page opens.
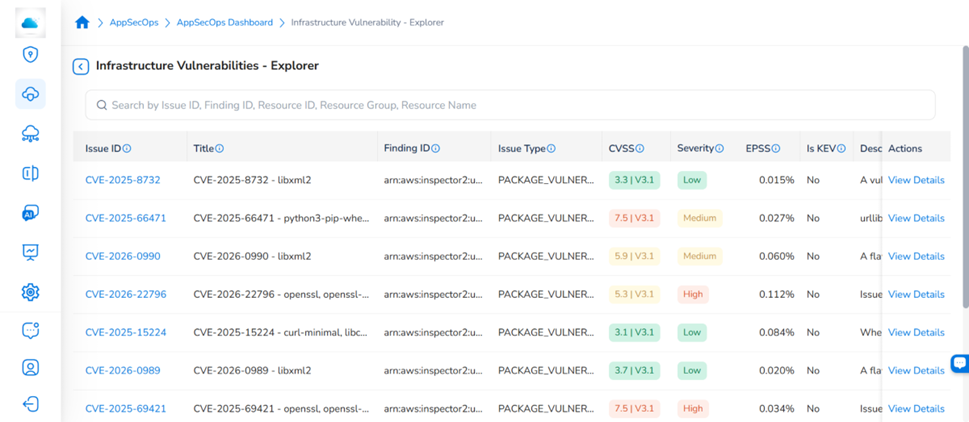
Infrastructural Vulnerabilities – Explorer displaying security issues for the selected account
For full guidance on navigating the explorers, reviewing finding details, and taking remediation actions, see the Infrastructure Explorers user guide
Widget Actions
Apply Filters
Select the Filter icon at the top of the widget to open the filter panel. The available filters are:
- Tenant: Filter by tenant (for multi-tenant environments)
- Cloud Account: Filter by one or more onboarded cloud accounts
- Issue Type: Filter by issue type (Vulnerabilities, Misconfigurations, Threats)
- Severity: Filter by severity level (Critical, High, Medium, Low)
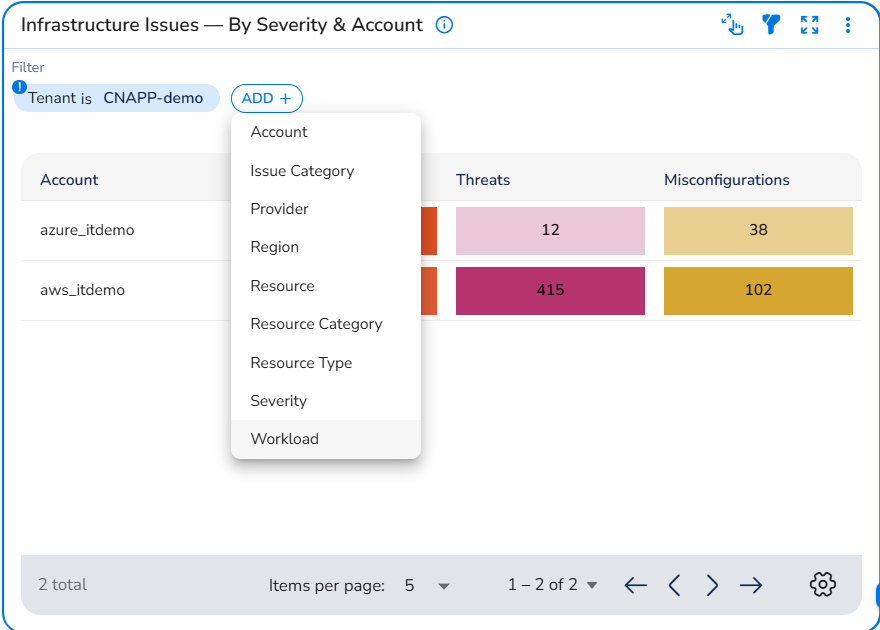
Select ADD+ to add a custom filter condition, then select the filter type and values from the dropdown that appears. Select the Filter icon again to hide the panel.
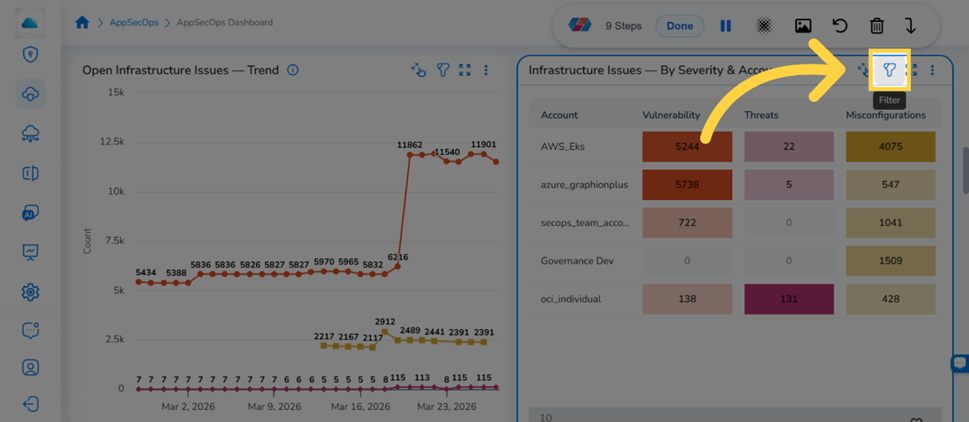
Filter icon on the Infrastructure Issues – by Severity and Account widget
Note: The Workload Filter is available as a widget-level filter on the Infrastructure Issues – by Severity and Account widget. Each workload in CoreStack corresponds to an onboarded cloud account and is created automatically — no manual setup is required. Applying a Workload filter scopes the heatmap to display only the security issue counts associated with the selected cloud account, reducing the heatmap to that account's rows across all three issue type columns — Vulnerabilities, Misconfigurations, and Threats.
Use the Workload filter when you need to:
- Focus the heatmap on a single cloud account to review its severity distribution across all three issue types
- Reduce visual noise in large multi-account environments where many accounts are displayed simultaneously
- Isolate a specific account's risk profile before clicking into its explorer for deeper investigation
To apply the filter, click the Filter icon on the widget, select Workload from the filter attribute dropdown, choose the workload from the value list, and click Ok. The heatmap refreshes immediately to reflect only the selected workload's data.
Expand the Widget View
Select the Expand View icon at the top of the widget to open the heatmap in a full-screen view. Select the icon again to return to the standard dashboard view.
Use the Actions Menu
Select the ellipsis icon (⋮) at the top of the widget to open the actions menu and take the relevant action on the widget.
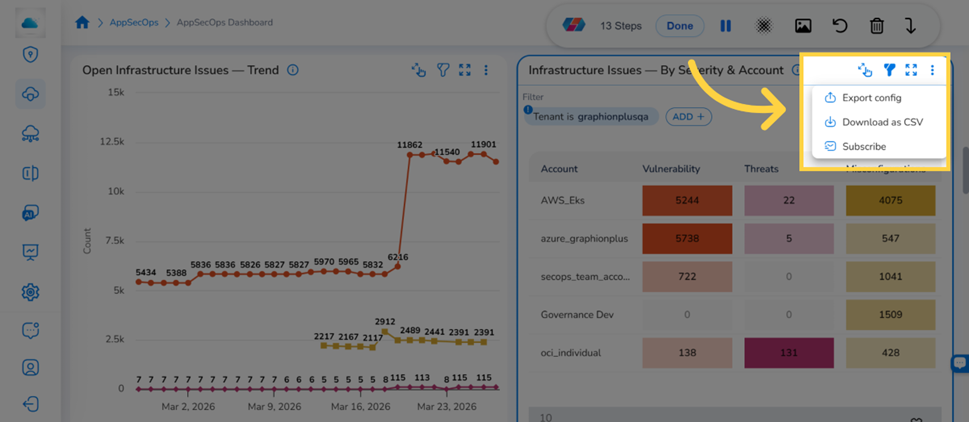
Actions menu options: Export config, Download as CSV, and Subscribe
Frequently Asked Questions
Q: Can users select cells for all three issue types — Vulnerabilities, Misconfigurations, and Threats?
Yes. Selecting a cell under any of the three issue type columns navigates to the respective explorer for that issue type, pre-filtered for the selected account. The steps in this guide use Vulnerabilities as an example, but the same workflow applies for Misconfigurations and Threats.
Q: Why does the widget show no data for some accounts?
An account with no visible cells either has no connected cloud account data, has not completed a security scan, or has zero issues recorded in the current scan cycle. Verify that the account is onboarded and that at least one scan has completed. If the account appears elsewhere in the dashboard but not in this widget, check whether active filters are excluding it — clear all filters and reload.
Q: Do the filters applied in the widget carry over when an explorer opens?
Yes. When users select an issue type cell, the selected cloud account is applied as a filter in the respective explorer automatically. Additional filters can be added or modified within the explorer using its own filter panel.
Q: How current is the data shown in the heatmap?
The heatmap reflects results from the most recent completed security scan for each connected account. It is not a real-time view — data updates after each scheduled scan cycle completes. If data appears outdated, confirm that recent scans have completed successfully.
Troubleshooting
The Cloud Security Dashboard or widget is not visible
Cause: The user role may not include Graphion permissions, or the Graphion module may not be enabled for the organization.
Solution:
- Confirm with a CoreStack administrator if you have the necessary roles and permissions assigned under the appropriate bundles.
- Ask the administrator to verify that the Graphion module is enabled for the organization.
- Log out and back in to refresh the session after any role changes.
- If the module is enabled and the role is correct but the widget remains invisible, contact CoreStack support with the account ID and the role currently assigned to the user.
Selecting a cell does not open the explorer
Cause: The cell may have a zero count, or there may be a session or loading issue preventing navigation.
Solution:
- Confirm that the selected cell has a non-zero issue count — cells with zero counts are not navigable.
- Refresh the page, navigate back to the Infrastructure Dashboard, and try selecting the cell again.
- If the issue persists on cells with non-zero counts, contact CoreStack support with the account name, the issue type column selected, and the approximate timestamp of the attempt.
The explorer opens but shows no results
Cause: The account filter carried from the widget may not match any records in the current scan data, or the most recent scan may not have completed for that account.
Solution:
- In the explorer, open the filter panel and review the active filter conditions. Remove or broaden any filters that may be excluding results.
- Confirm that a scan has completed recently for the selected cloud account.
- If issues are expected but remain absent after clearing all filters, contact CoreStack support with the account ID, the issue type selected, and the approximate timestamp of the most recent scan.
Updated 10 days ago