

Dimension Support for Cost Anomaly
This user guide takes you through Dimension Anomaly Summary dashboard in CoreStack.
Introduction
In this user guide, you will learn how to navigate through the interface and understand the Dimension Anomaly Summary dashboard to analyze cost anomalies effectively.
View Dimension Anomaly Summary Dashboard
Perform the following steps to view the details in the Dimension Anomaly Summary dashboard:
1. Select "FinOps" Module
In the CoreStack application, on the left navigation menu, click FinOps.
2. Navigate to "Cost Anomaly"
Click to expand Cost Anomaly.
3. Click "Dimension Anomaly Summary"
Click to select Dimension Anomaly Summary sub-menu to view the summarized anomaly data by dimension.

4. View "Dimension Anomaly Summary" Dashboard
The Dimension Anomaly Summary page shows the following:
- Global filters and custom filters
- Summary of dimension anomalies
- Cost Trend By Dimension Group widget
- Cost Impact By Dimension Group widget

5. View Global Filters
The global filters are displayed on the top of the screen. The available global filters are -- Time, Granularity, Currency, and Metrics.

6. Select Another Value for Filter
You cannot add or remove a global filter, but can change its value. For example, in the Granularity filter, change the value to "Month" from "Day".
7. Change Value for "Time Range" Filter
In the Time Range filter, select another option and click Ok. The details in the widget will be displayed accordingly.
Note: While creating dimension, priority will be given for the date range that is selected.

8. Add Custom Filter
To add a custom filter, click ADD+.
9. Select Account Filter
In this case, select the Account to filter anomalies by account.
10. Select Values for Account Filter
To add values for the Account filter, click the drop-down list, select applicable values, and click Ok.

11. Dimension Filter
The Filter section shows the Dimension filter that is a pre-defined filter in the Dimension Anomaly Summary Dashboard. Users can select values for it as per which the details will be displayed in the widgets.

12. Select Value(s) for "Dimension" and "Name"
The Dimension and Name filters are related to each other, hence they are grouped. Based on the value selected in the Dimension filter, related values will be displayed in the "Name of" filter and users can select all applicable options and click Ok.

13. View Cost Summary Details
Users can view the summary of cost in these widgets -- Total Cost Impact, Total Cost Spend, Total Anomalies, and Dimension Group With Most Anomalies.

14. Open Drilldown Details
In the Total Cost Spend widget, click on the arrow or cost amount to open the drilldown screen.
15. View Drilldown Details
The Total Cost Spend Drilldown screen appears and shows the drilldown details.

16. View "Cost Trend By Dimension Group" Widget
View the Cost Trend By Dimension Group widget. This widget shows the cost trend as per dimension group.

17. View "Cost Impact By Dimension Group" Widget
View the Cost Impact By Dimension Group widget that shows the cost impact as per dimension group.
Additional Actions on Widgets
Perform the following steps to take additional actions on widgets:
1. Maximize the Widget View
Click this expand icon to maximize the widget view and you can click back this icon to see the normal view.

2. Export Config
Click the ellipses on the widget and select the option Export Config to download the widget details.
3. Swap Axis
Click the ellipses on the widget and select the option Swap Axis to interchange the display of details in horizontal and vertical axis.

4. Subscribe
Click the ellipses on the widget and select the option Subscribe to make updates to the subscription details.
5. Make Updates to Subscription
Make updates to the subscription details as per which emails will be sent to recipients.

6. Limit Data
Click the ellipses on the widget and select the option Limit Data as per which selective details will be displayed on the widget. The available options are -- All Data, Top 5, Top 5 Plus Others, Top 10, Top 10 Plus Others, Bottom 5, and Bottom 5 Plus Other.

7. Download as PNG or CSV
To download widget details, click the ellipses on the widget and select the relevant option from -- Download as CSV and Download as PNG.
8. View As
Click the ellipses on the widget and select the option View As to change the widget type. After this, select one option from the available options -- in this case, select either Datatable or Line. The widget type will change as per the selected option and will display details.
9. Click a Data-Point to View Dimension Anomaly Summary
In the Cost Trend By Dimension Group widget, hover the mouse pointer over a data-point to see information about it and then you can click on that data-point to view the Dimension Anomaly Summary of that point.

10. View "Dimension Anomaly Details"
The Dimension Anomaly Details tab displays the anomaly details for the selected data-point. Users can view the dimension anomaly summary details in the top cards -- Total Cost Impact, Total Cost Spend, and Total Anomalies. The detailed information about the dimension anomaly is shown in these columns -- Anomaly Date, Processed On, Status, Dimension Group, Dimension, Cloud Account, Resource Category, Cloud Provider, Cloud Spend, Expected Cost, Cost Impact, Cost Impact %, and Action.
Configure Notification Webhooks
Perform the following steps to configure webhook notification channels for cost anomaly detection through the Dimension settings in CoreStack.
1. Access Account Governance Settings
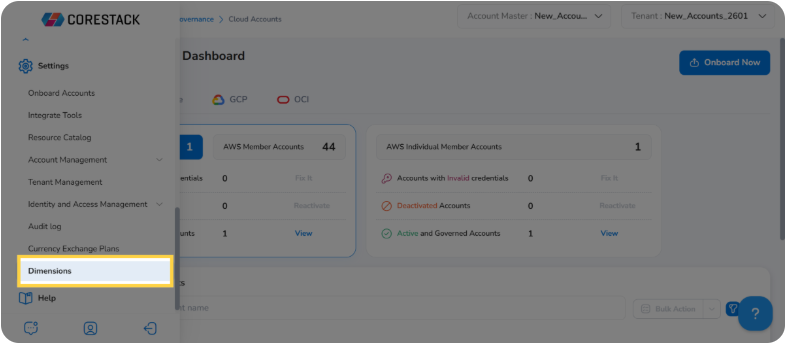
Click Settings in the side panel to open the Account Governance configuration options.
2. Open Dimensions Section
Click Dimensions to open the dimension management page, where you can view and configure your organization's dimension grouping rules.
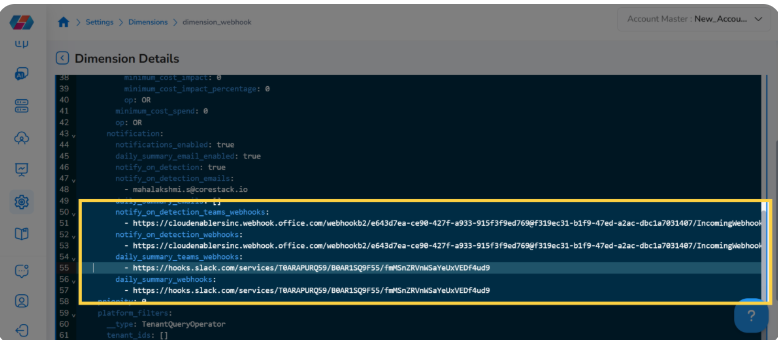
3. Select the Target Dimension
Click the name of the dimension you want to configure — in this example, dimension_webhook— to open its Dimension Details view.
4. Configure Webhook Notification URLs
The Dimension Details notification block displays all configured notification channel endpoints. Click any webhook URL to edit it inline — the block holds the Generic Webhook, Microsoft Teams Webhook, and Slack Webhook endpoints. Each channel operates independently, so a failure on one does not block delivery to the others.
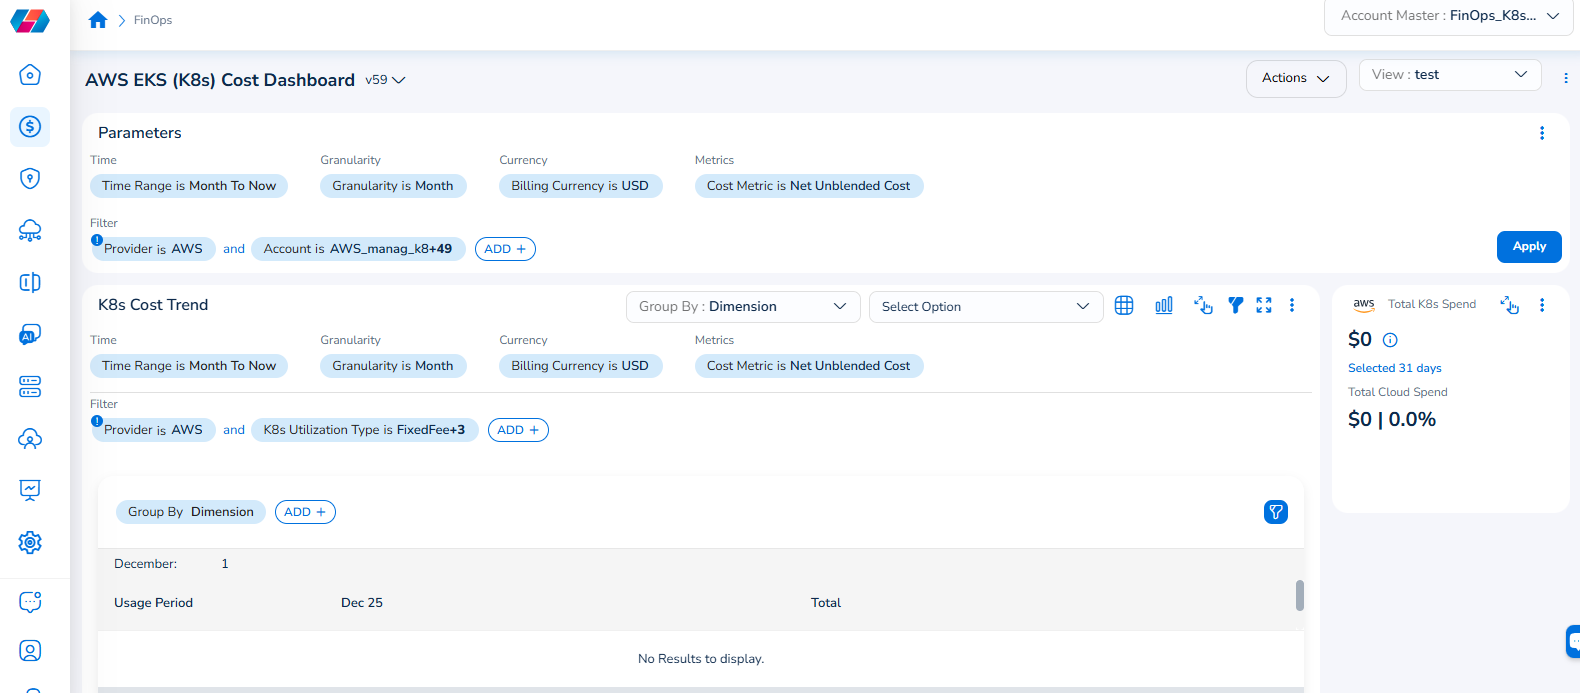
Note that the Cloud Account filter has been renamed to Account, and the Cloud Provider filter has been renamed to Provider.
For example, if you see the dashboard shown in the screenshot below, the Parameters > Filter section shows the Provider filter for which the value selected is AWS.
To add the Account filter, users can click ADD+ and select Account. In the drop-down list that appears, users can select all applicable values, and click Ok. Details will be displayed in widgets as per the selected filter(s).
In every widget that is available within a dashboard, users can click the Filter icon that appears on the top-right side of the widget and view the pre-defined filters. The Provider filter appears as a pre-defined filter. Users can use the ADD+ option to add custom filters and they have the option to add the Account filter from here.
Updated 2 months ago