

Cost Forecasting
Introduction
Enhanced Spend Forecasting has been added to empower users with a flexible and precise tool to forecast cloud spend, enabling more confident financial decisions. Designed to meet diverse forecasting requirements, it delivers improved accuracy through advanced AI algorithms and supports multi-dimensional analysis for tailored insights.
- Flexible Forecasting Across Multiple Dimensions: Generate forecasts for various business contexts, including tenants, cloud accounts, regions, tags, and charge types.
- Context-Aware Forecasting: Forecasts adapt dynamically based on applied filters, ensuring insights remain relevant to the specific business context.
- Extended Forecasting Horizons: Plan with monthly granularity up to 13 months ahead and daily granularity up to 14 days into the future, supporting better financial strategies and resource allocation. Based on the forecast requested, the platform auto adjusts look back period up to 12 months of daily granularity data to get the best median accuracy.
- AI-Powered Accuracy: Advanced AI algorithms enhance accuracy, aligning forecasts with actual trends and providing reliable predictions that minimize uncertainty.
- Contextual Flexibility: Easily adjust forecasts by including or excluding specific costs or credits to meet reporting and budgeting objectives, ensuring tailored and actionable insights.
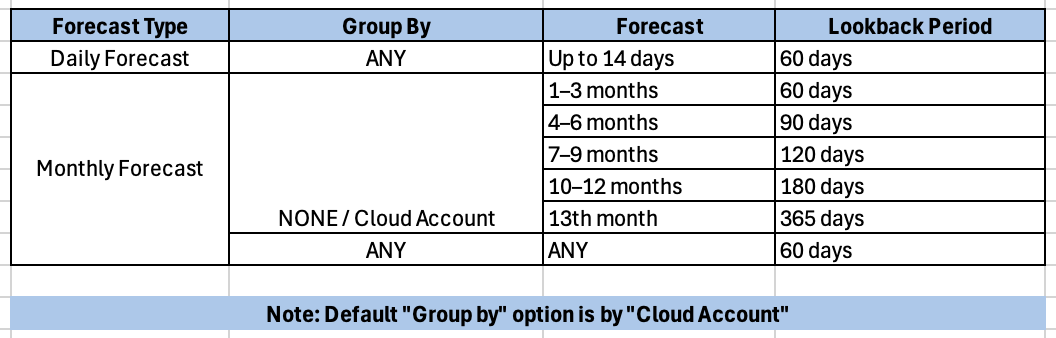
Cost forecasts at different granularities are based on the lookback period defined below. The lookback period refers to the number of past days used to calculate the forecast. Forecasts for the same month may vary depending on the number of forecast months selected, as the lookback period changes accordingly.
Forecast Filter - Cost Trend Forecast Widget
The Forecast filter option (formerly available in the Cost Trend Widget) has been removed from the Cost Trend Widget in all default dashboards.
Instead, a dedicated dashboard featuring the new "Cost Trend Forecast (New)" widget has been created, which supports the use of the Forecast filter. Users can include this widget in their custom dashboards as needed. The newly added Cost Trend Forecast widget shows the following:
- View Mode: Currently, the widget supports only the table view.
- Cloud Account Limit: Displays data for up to 10 cloud accounts. It fetches all relevant data, sorts it in descending order, and then displays the top 10 accounts.
- Lookback Period: Fixed at 60 days, regardless of the forecast duration selected. This is a change from the previous system, which allowed a variable lookback period.
These changes aim to streamline the forecasting process and provide users with a more focused and manageable view of their cost trends.
Adding and Configuring the Cost Trend Forecast Widget
1. Navigate to the FinOps Dashboard
In the left-nav menu, select the FinOps option and then select Dashboard.
2. Add a dashboard.
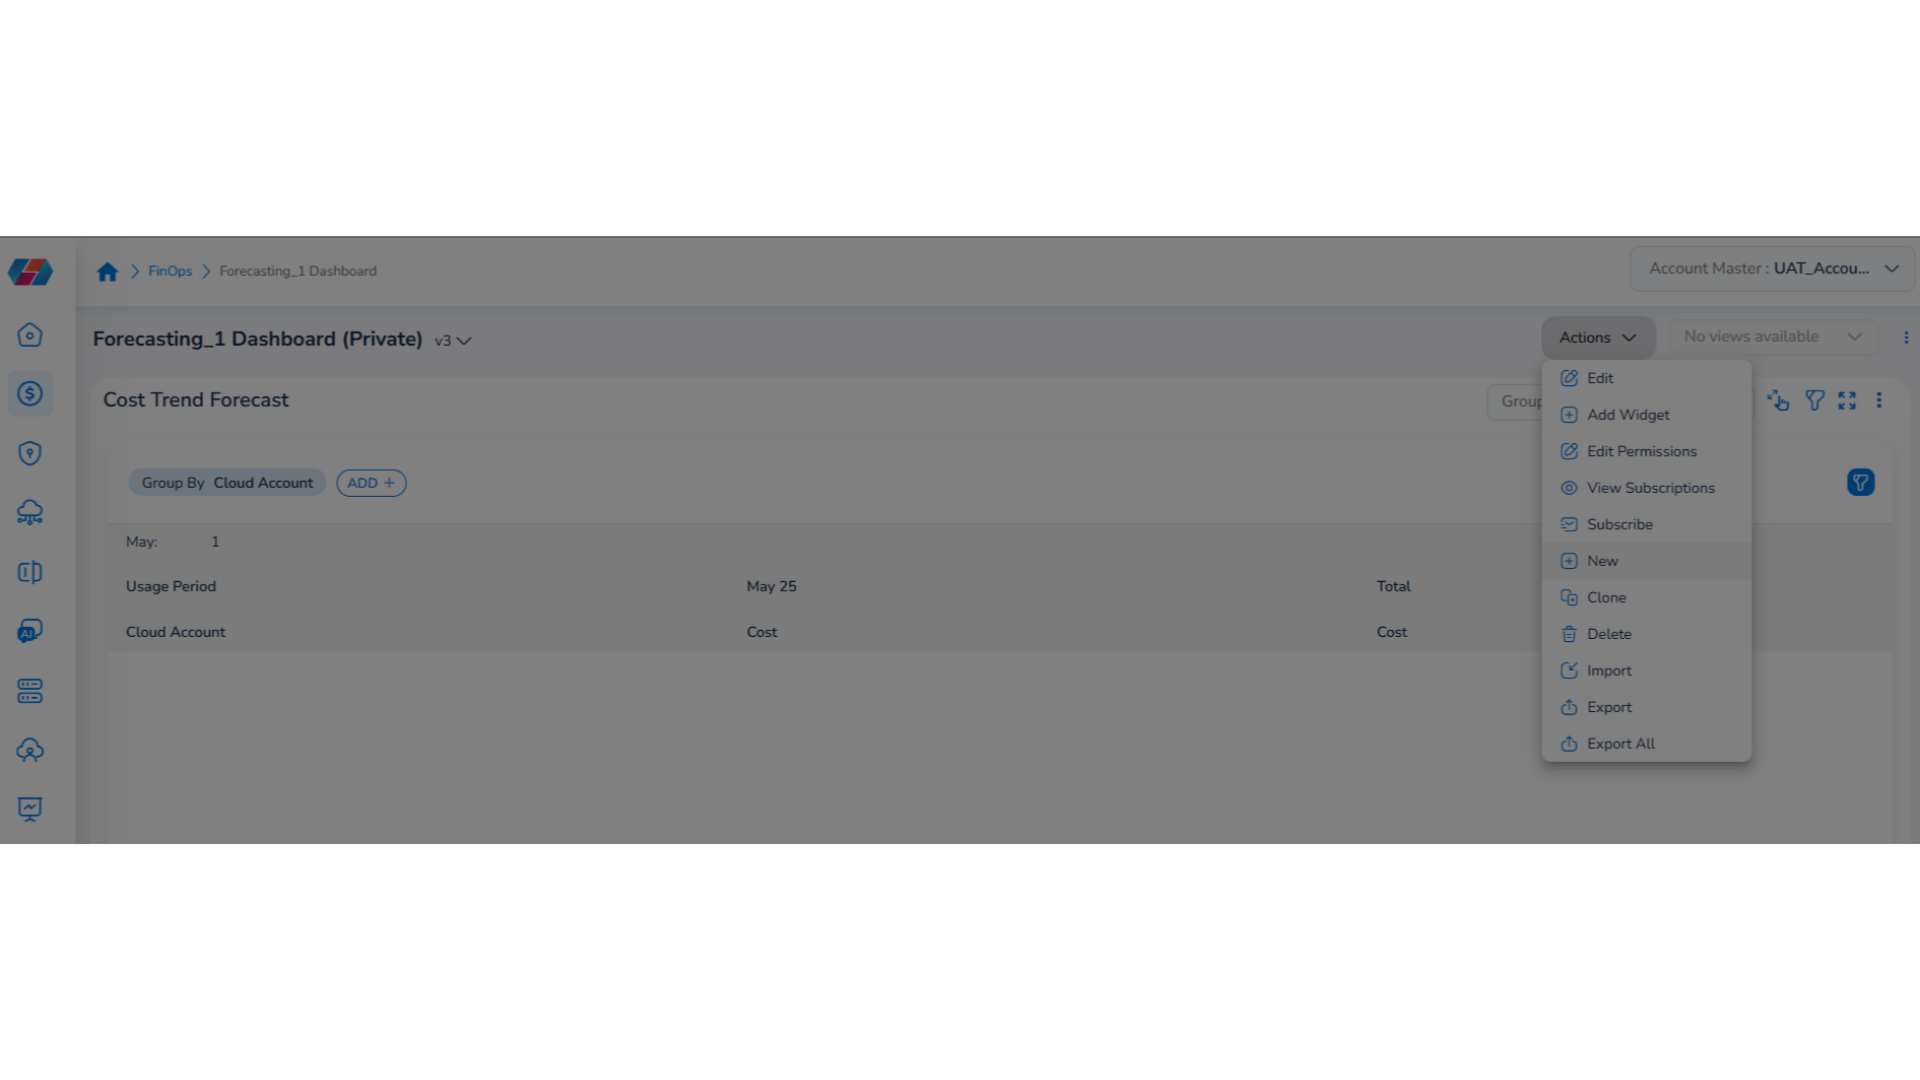
Users must create a new dashboard and then add the Cost Trend Forecast widget. To create a new dashboard, click Actions > New.
The Create New Dashbord dialog box appears where the user must do the following:
- In the Dashboard Type field, select FinOps Dashboard.
- In the Targeting for field, select either Multiple Cloud or Single Cloud.
- Click Continue.
3. Add general widget.
Before adding a Cost Trend Forecast widget, you can add a general widget. To add a general widget, click Actions > Add Widget > Grouping Widget > General. Follow the steps and select relevant options to create the widget.
4. Click "Add Widget".
To add a new widget, click Actions > Add Widget.
Alternatively, to add a widget, click Click here to add a widget button.
5. Click "FinOps".
Select the FinOps category to add a widget related to financial operations.
6. Select "Cost Trend Forecast (New)".
Select the Cost Trend Forecast (New) widget from the drop-down list.
7. Click "Next".
Click Next to proceed with widget configuration.
8. Select a filter.
In the Data Binding tab, click the drop-down list and select an option for filter.
9. Enable "Parameters".
To enable the parameters, move the slider towards the right. You can enable parameters as per your need.
10. Enable "Override Granularity".
For example, you can click to enable the parameter Override Granularity.
11. Click "Next".
Click Next to proceed with the configuration steps.
12. Enable "Refresh Rate".
In the Refresh Rate tab, move the slider to enable the Refresh Rate field. This action enables the drop-down that appears below. Users can click the drop-down list and select a time period for automatic refresh.
13. Click "Next".
Click Next to move to the next step.
14. Select an option in Group By tab.
In the Group By tab, click the drop-down list and select an option as per which data in the widget will be grouped. After selecting a relevant option, click Next to go to the next step.
15. Select details in the "Legend" tab.
In the Legend tab, select the appropriate orientation options for the widget. If you don't select any option, then the default options displayed on the screen are considered for widget orientation.
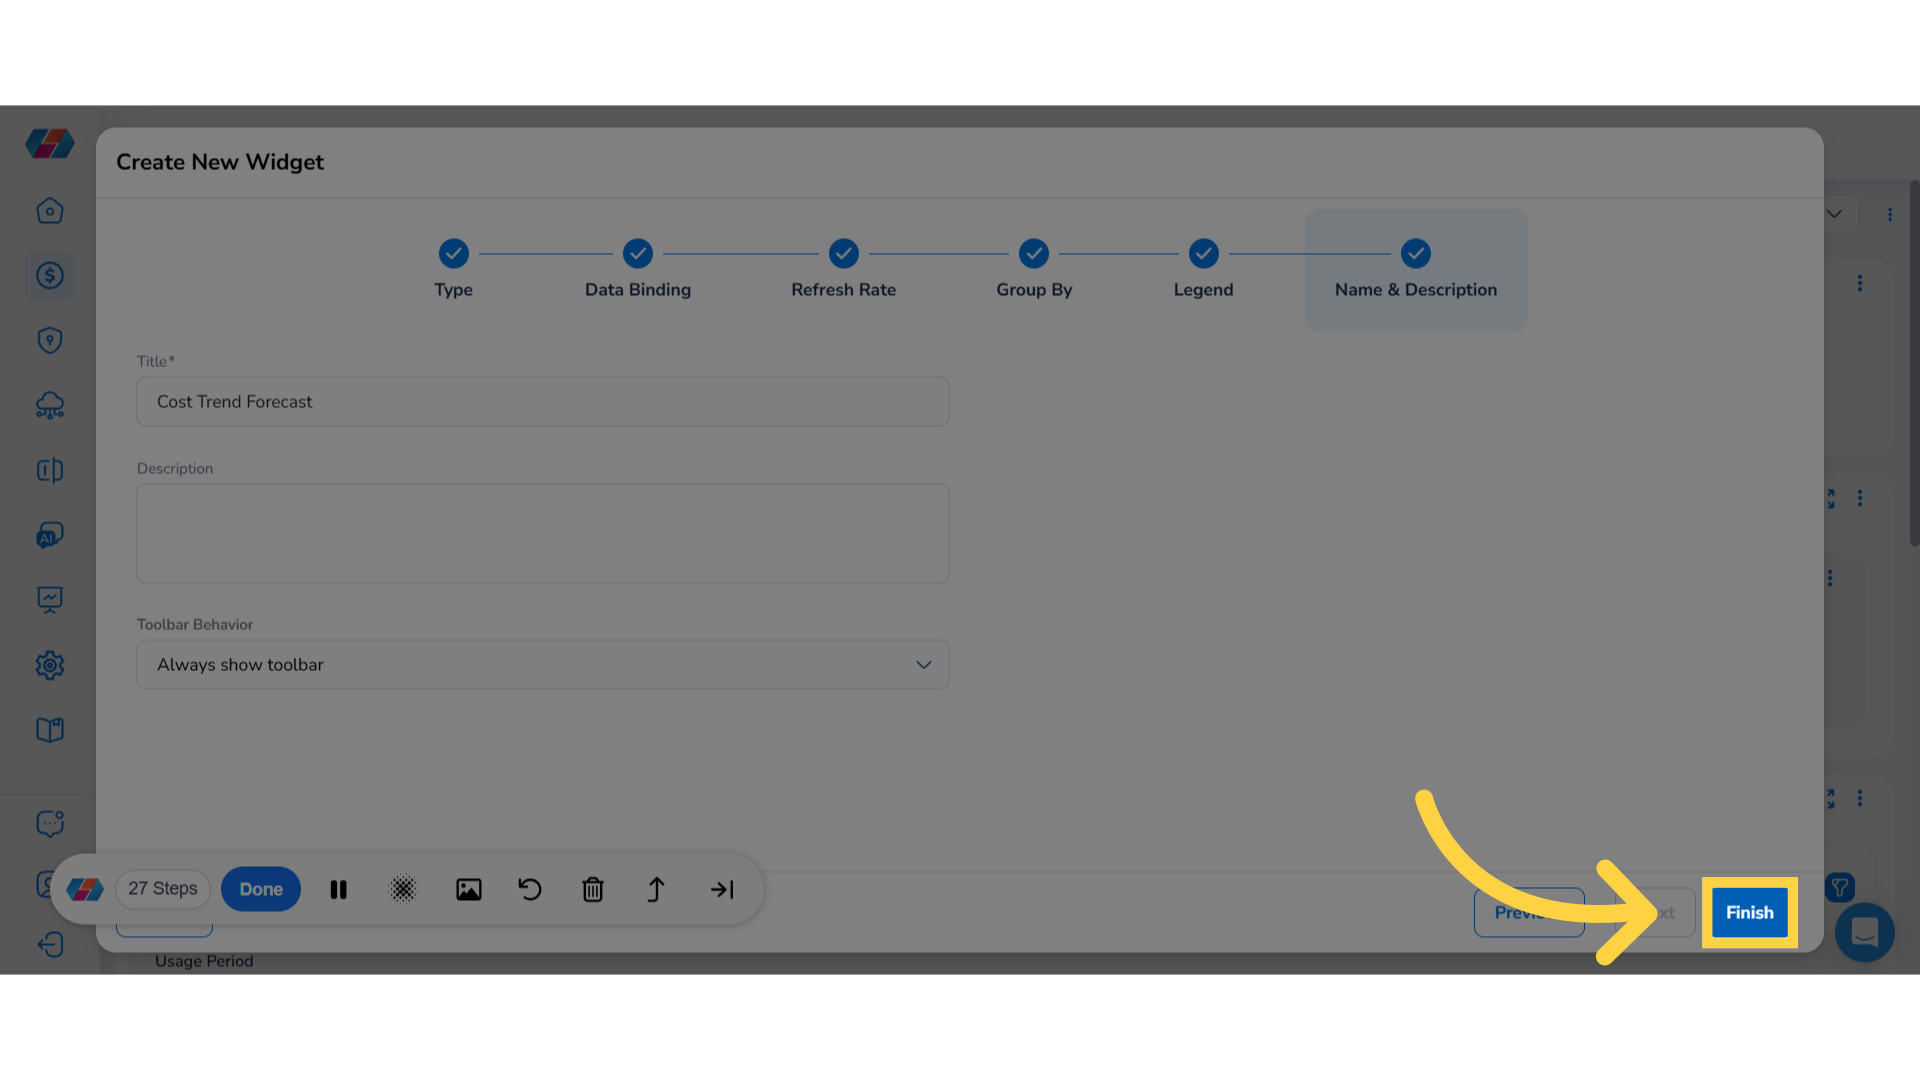
16. Add details in "Name & Description" tab.
In the Name & Description tab, in the Title box, enter the widget title.
If needed, you can enter a description about the widget in the Description text box.
In the Toolbar Behavior drop-down list, you can select the required option. This is not a mandatory field to be filled. So if you don't select anything for Toolbar Behavior, then the default option displayed on the screen is considered for the widget configuration.
17. Adjust the widget size.
Adjust the widget size within the dashboard by dragging the edges or sides.
Add and Configure the Forecast Filter
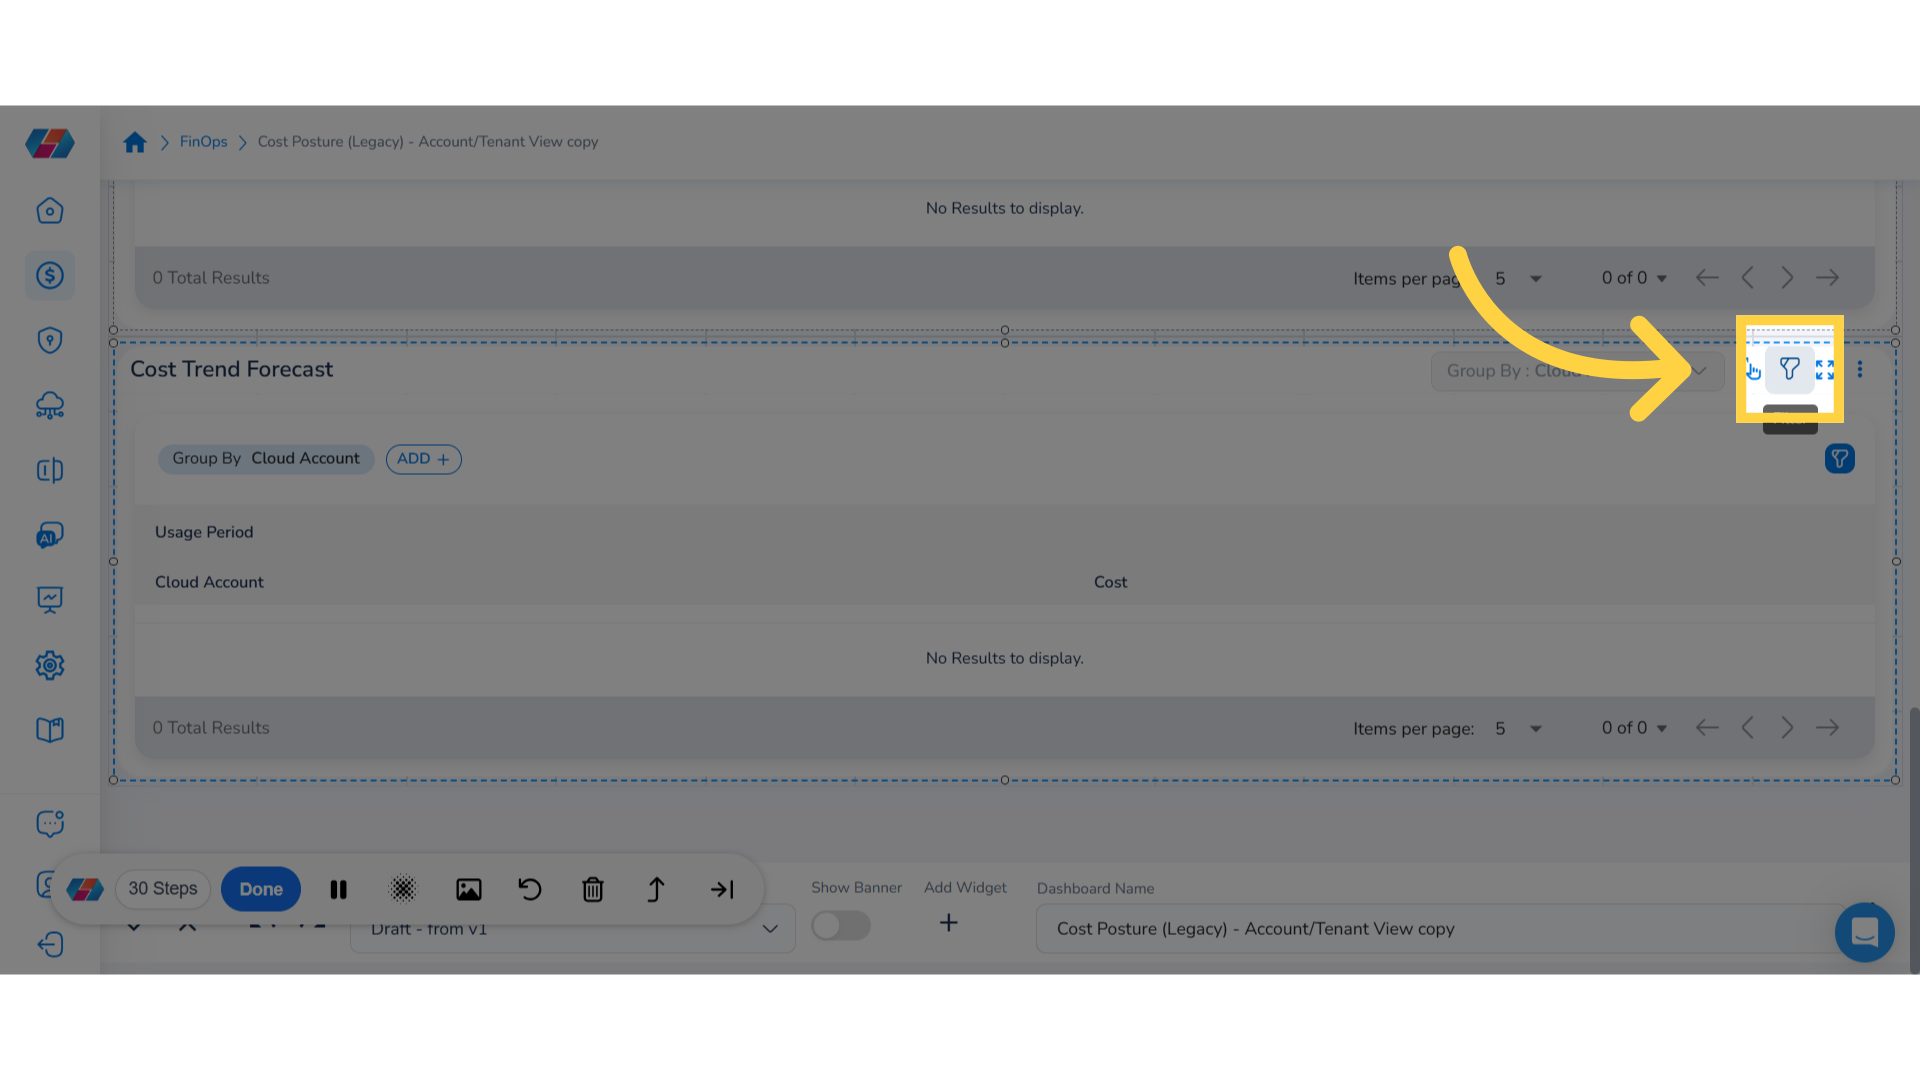
1. Click the filter icon.
In the Cost Trend Forecast widget, click the Filter icon to view the available filters. Users must use all relevant filters and apply values so that they can see the updated widget with details that will help them in their financial strategy.
Note:You can click on the Filter icon again to hide the filters.
2. View Forecast filter.
The Cost Trend Forecast widget shows the Forecast filter along with Time Range, Granularity, and Billing Currency filters. You can also see the values selected for these filters.
Users can use ADD+ and apply custom filters. Any custom filters added by the user can be removed as well. Users can change the values applied for filters anytime.
The Group By filters are also available in the Cost Trend Forecast widget that can be used to group details that can be viewed in the widget. Users can also see a Filter icon on the extreme right side of the Group By filter and they can click on it to show or hide the Group By filter.
3. Select value for "Forecast" filter.
For the Forecast filter, you can click the drop-down and select another value. The details in the widget will be displayed as per the applied filter.
4. Click "ADD+".
To add a custom filter, click ADD+.
5. Select "Cloud Provider".
From the list of available options, select one. For example, you can select Cloud Provider.
After the filter is added, click the drop-down list and select all relevant values. After selecting all required options, click OK. The widget details will be shown as per the applied filter.
6. Apply "Group By" filter.
Click the Filter icon (on the extreme right side of the screen) to hide/show the Group By filters.
For example, to apply the Group By filter, click ADD+ and from the list of options that is displayed, select Product Family. The widget details will be grouped and displayed as per product family. Again, click ADD+ and select Region ID to group the widget details as per region. You can continue to select the required options as per which widget details will be grouped.
7. Additional actions.
Users can take additional actions in the Cost Trend Forecast widget. To take an action, click the ellipses and select an option.
By utilizing the Cost Trend Forecast widget, users can gain valuable insights into their financial data, enabling proactive cost management and strategic planning.
Note: The Cost Trend widget now supports the Line chart option for the View As functionality. The line chart will work with all filters and group-by options, show multiple lines when grouped, support drill-downs, and display the same data labels as the stacked column chart.
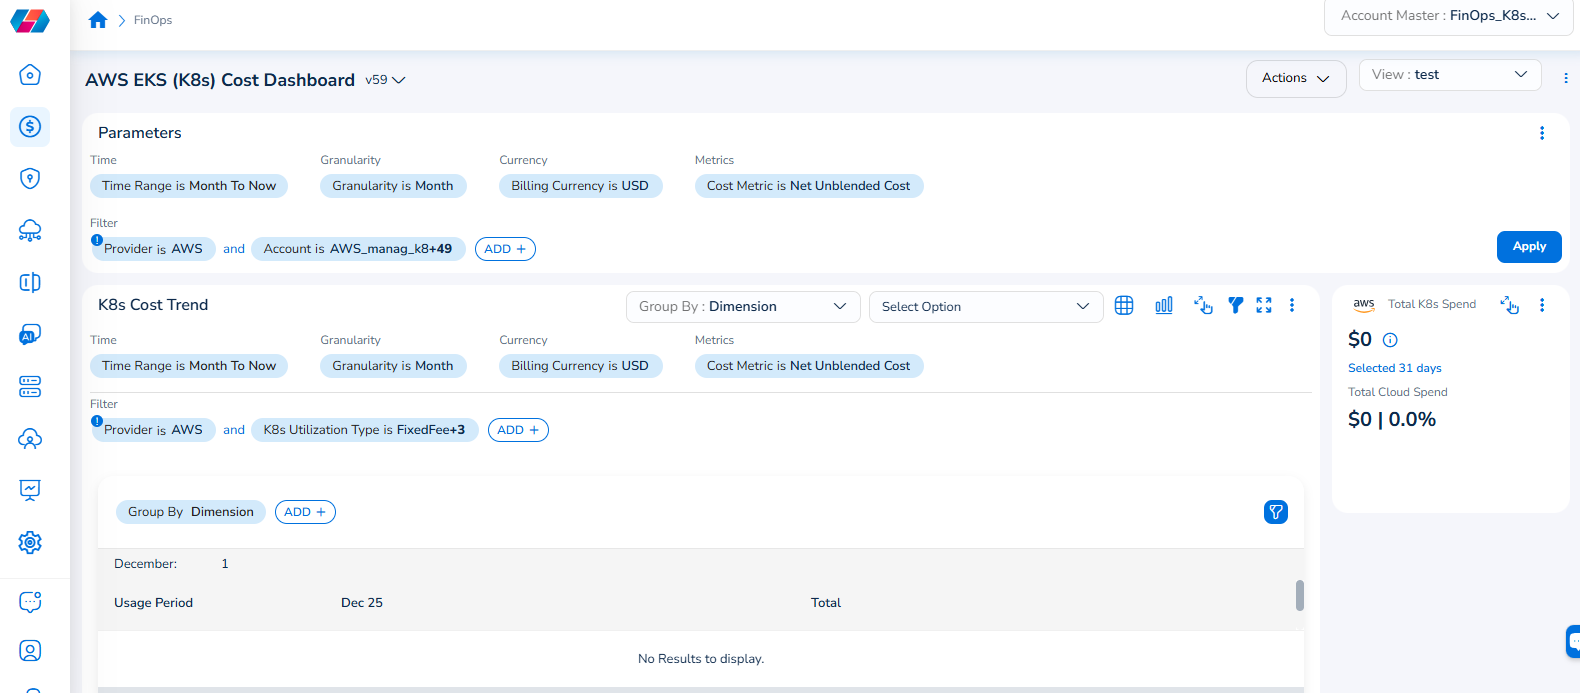
Note that the Cloud Account filter has been renamed to Account, and the Cloud Provider filter has been renamed to Provider.
For example, if you see the dashboard shown in the screenshot below, the Parameters > Filter section shows the Provider filter for which the value selected is AWS.
To add the Account filter, users can click ADD+ and select Account. In the drop-down list that appears, users can select all applicable values, and click Ok. Details will be displayed in widgets as per the selected filter(s).
In every widget that is available within a dashboard, users can click the Filter icon that appears on the top-right side of the widget and view the pre-defined filters. The Provider filter appears as a pre-defined filter. Users can use the ADD+ option to add custom filters and they have the option to add the Account filter from here.
Updated 7 months ago