

Open Infrastructure Issues – Trend
This user guide helps the users learn how to use the Open Infrastructure Issues – Trend widget in CoreStack Graphion to monitor and investigate vulnerabilities, threats, and misconfigurations over time.
Feature Overview
The Open Infrastructure Issues – Trend widget is a line chart within CoreStack's Graphion module that displays the count of open vulnerabilities, threats, and misconfigurations on your infrastructure over a selected time period. It is most relevant when you need to understand whether your security posture is improving, degrading, or staying flat across issue types.
This widget is most valuable to Engineering Leads who need to track issue trends at a glance and to Security Operations Roles who need to investigate and act on those issues.
Note: The Open Infrastructure Issues – Trend widget is only visible if your organization has the appropriate product bundle and you have been assigned the appropriate roles and permissions. If the widget does not appear on the Cloud Security Dashboard, contact your Tenant Admin to confirm bundle activation and role assignment.
How It Works
When CoreStack ingests security data for your connected cloud accounts, it records a snapshot count of open vulnerabilities, threats, and misconfigurations at each point in time (typically daily snapshots). The Open Infrastructure Issues – Trend widget plots these counts as three separate lines on a single chart — Vulnerabilities, Threats, and Misconfigurations — so you can see how each category moves independently over the selected period.
When you hover over a data point, a tooltip shows the issue category, the count, and the date of that snapshot. When you click a data point, an explorer panel opens pre-filtered to that issue type for that date, letting you inspect the individual issues that made up the count. The chart data reflects the granularity and time range you select and is updated on a scheduled ingestion cycle, not in real time.
Prerequisites
Before you begin, ensure the following:
- Roles and Permissions: You have the necessary roles and permissions assigned in CoreStack under the appropriate bundles.
- Cloud Accounts: At least one cloud account (AWS, Azure, GCP, or OCI) has been onboarded and scanned in CoreStack. Security issues appear only after at least one completed scan.
- Access: You can navigate to Graphion > Cloud Security > Cloud Security Dashboard using the CoreStack left navigation sidebar.
Using the Open Infrastructure Issues – Trend Widget
Navigate to Graphion > Cloud Security > Cloud Security Dashboard. The Cloud Security Dashboard loads and the Open Infrastructure Issues – Trend line chart is displayed, showing three series (Vulnerabilities, Threats, Misconfigurations) plotted against the default time range.
Step 1: Read the Trend Lines
Review the three lines on the chart. The Y-axis shows the count of open issues; the X-axis shows the time period. A rising line for a given category indicates that more issues of that type were open at the end of the period than at the start; a falling line indicates remediation progress.
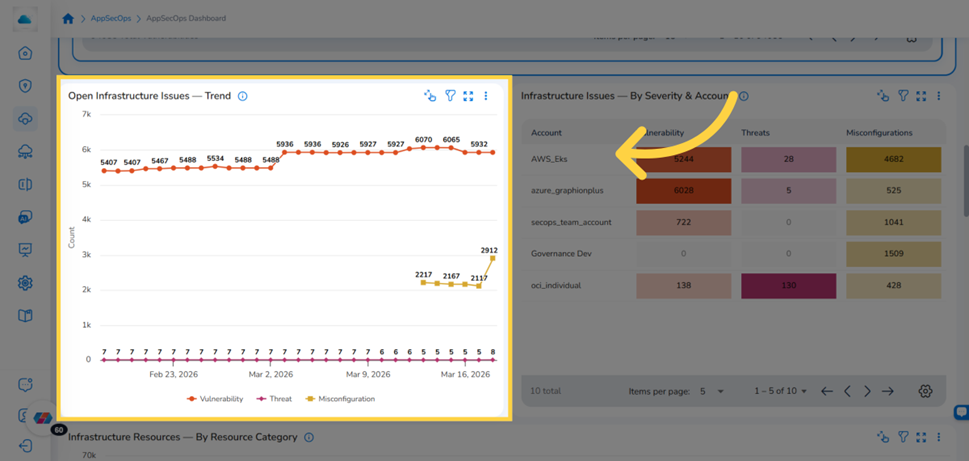
Open Infrastructure Issues – Trend widget showing three trend lines on the Infrastructure Dashboard
Step 2: Hover Over a Data Point to See Snapshot Details
Move your cursor over any point on a trend line. A tooltip appears showing the issue category, the count of open issues, and the date of that snapshot.
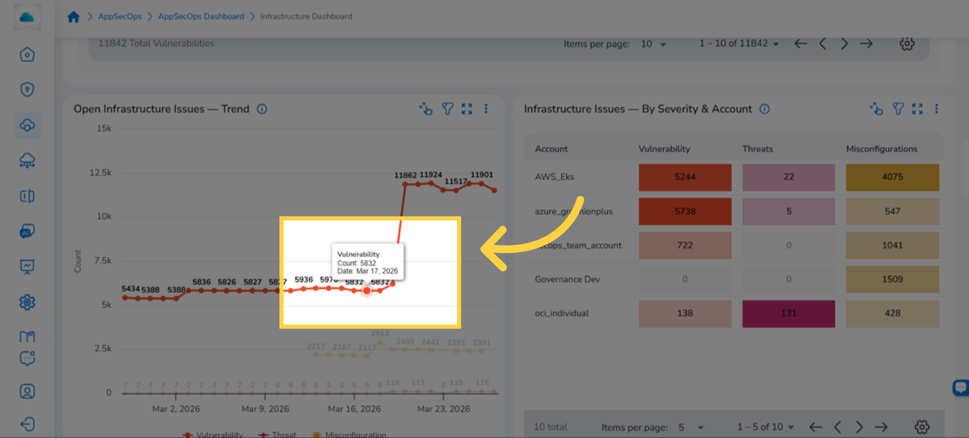
Hovering over a data point reveals a tooltip showing the issue category, count, and date
Step 3: Click a Data Point to Open the Issue Explorer
Click any data point on the chart. A right-side fly-in explorer panel opens, pre-filtered to the issue type and date you selected. The explorer that opens depends on which line you clicked:
- Clicking a Vulnerabilities data point opens the Infrastructural Vulnerabilities – Explorer.
- Clicking a Threats data point opens the Infrastructure Threats – Explorer.
- Clicking a Misconfigurations data point opens the Infrastructure Misconfigurations – Explorer.
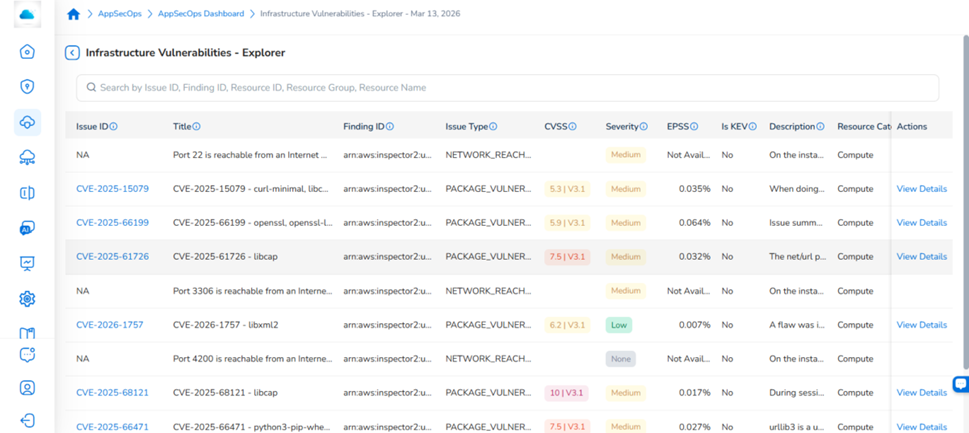
Clicking a Vulnerabilities data point opens the Infrastructural Vulnerabilities – Explorer on the right
For full guidance on navigating the explorers, reviewing finding details, and taking remediation actions, see the Infrastructure Explorers user guide
Widget Actions
Expanding the Explorer View
Click the expand icon in the top-right corner of the explorer panel header to open the explorer in a larger, full-screen view. This is useful when reviewing a large number of issues or when you need to see all columns without scrolling. Click the icon again to return to the standard side-panel view.
Using the Widget Options Menu
Click the ⋮ (options) icon in the top-right corner of the Open Infrastructure Issues – Trend widget header to access additional widget actions. The menu provides options such as downloading the chart, refreshing the widget data, and other widget-level controls. Available options may vary depending on your role and your organisation's configuration.

The ⋮ (options) icon in the Trend widget header provides download, refresh, and other widget-level actions
Adjusting Widget Filters
The trend chart supports both widget-level and dashboard-level filters that control which data is displayed.
Widget-level filters are accessed from the filter icon on the widget itself. You can filter by:
- Tenant
- Cloud Account(s)
- Cloud Provider(s)
- Issue Category (Vulnerabilities, Threats, Misconfigurations)
- Resource Category, Resource Type, Resource, and Resource ID
- Is KEV
- Group Filters: Vulnerability Severity, Misconfiguration Severity, Threat Severity
- Time range (15 presets, up to 365 days)
- Granularity (Days or Month)
Dashboard-level filters (Tenant, Cloud Provider(s), Cloud Account(s)) apply to all widgets on the Infrastructure Dashboard simultaneously.
To reset the widget to its default view, clear all applied filters.
Note: The Workload Filter is available across all widgets on the Cloud Security Dashboard. Each workload in CoreStack corresponds to an onboarded cloud account and is created automatically — no manual setup is required.
Applying a Workload filter scopes the widget's data to the security findings associated with that specific cloud account. On the Open Infrastructure Issues – Trend widget, this means the trend lines for Vulnerabilities, Threats, and Misconfigurations will reflect only the issues detected within the selected workload, rather than across your entire tenant.
Use the Workload filter when you need to:
- Monitor the security trend for a specific cloud account over time
- Isolate whether a spike or improvement in findings is driven by a particular account
- Compare security posture across cloud accounts by applying different workload filters on different widgets simultaneously
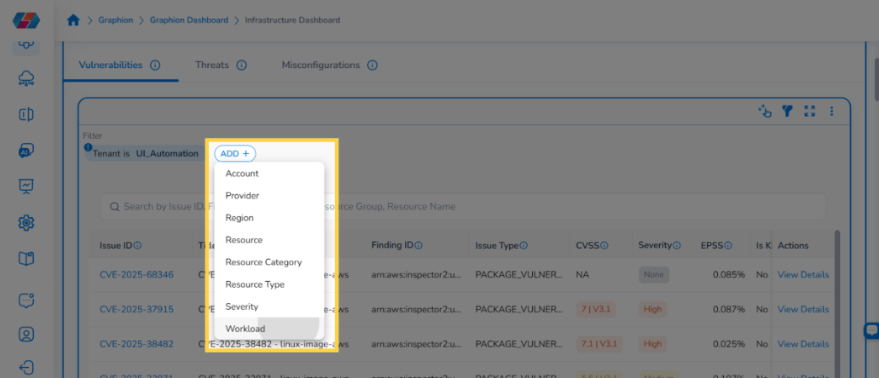
To apply the filter, click the Filter icon on the widget, select Workload from the filter attribute dropdown, choose the workload from the value list, and click Ok. The chart refreshes immediately to reflect the scoped data.
Frequently Asked Questions
Q: Why does the chart show a sudden spike or drop at a specific date?
Spikes and drops typically reflect a bulk ingestion event — for example, a newly connected cloud account being scanned for the first time, a change in scan scope, or a remediation batch that closed many issues simultaneously. Check whether a new cloud account was connected or a scan policy was modified around that date. You can narrow the time range using the widget filter to isolate the change.
Q: Can I see which specific issues drove a count on a particular date?
Yes. Click the data point for the date and issue type you want to investigate. The corresponding explorer opens pre-filtered to that snapshot, listing every issue that contributed to that count.
Q: The chart shows data for a cloud provider I don't manage. How do I filter it out?
Use the dashboard-level Cloud Provider or Cloud Account filter at the top of the Infrastructure Dashboard to limit the view to the accounts you manage. You can also apply the same filters at the widget level using the widget filter panel.
Q: How often is the trend data updated?
The trend chart reflects data from CoreStack's scheduled ingestion cycles. The data is not real time — counts reflect the state of your environment at the time of the last completed scan ingestion. Contact your CoreStack administrator if you believe the data is stale.
Troubleshooting
The trend chart is blank or shows no data
Cause: No cloud accounts have been connected to Graphion, or the connected accounts have not yet completed a scan ingestion cycle.
Solution:
- Navigate to
Graphion > Settingsand confirm that at least one cloud account is connected and shows a successful scan status. - If accounts are connected but no data appears, check whether the selected time range predates the first successful scan. Change the time range to a more recent period.
- If the chart remains blank after confirming accounts and time range, contact CoreStack support with your tenant ID, the cloud accounts connected, and the time range selected.
Clicking a data point does not open an explorer panel
Cause: The data point may represent a zero count, or a browser session issue may be preventing the panel from loading.
Solution:
- Confirm the data point you clicked has a non-zero count by hovering over it first — the tooltip should show a count greater than zero.
- Refresh the page and attempt to click the data point again.
- Clear your browser cache and reload the Infrastructure Dashboard.
- If the panel still does not open, contact CoreStack support with the issue type, the date of the data point, and your browser version.
The explorer shows fewer issues than the count displayed on the chart tooltip
Cause: Dashboard-level or widget-level filters may be active that are reducing the explorer results, or the explorer may be applying default filters that differ from the chart's display filters.
Solution:
- Check the widget filter panel and dashboard-level filters for any active selections that might exclude records.
- Clear all filters on both the widget and the dashboard to see the full unfiltered explorer.
- If the count still does not match after clearing all filters, contact CoreStack support with the expected count from the tooltip, the actual count in the explorer, the issue type, and the date of the data point.
Updated 10 days ago