

Margin Analysis Dashboard
Introduction
BillOps introduces new Margin metrics for Margin Value and Profit Margin, enabling partners and distributors to analyze and compare their buy price vs sell price, along with applicable margins on a month-over-month/day-over-day/year-over-year basis.
Margin analysis is now supported through various configured dashboards and widgets, including the following:
- Trend Widget
- Cost Summary Widgets
- Billing Inventory
- Variation by Dimension Widget
- Variation Widget
- Measure by Dimension Widget
Role-Based Access Control (RBAC) is also now supported for margin visibility in this release. Essentially, if the logged in user does not have access to either of Billed Cost or Contracted Cost, they will not see this option.
As partners and distributors carry out billing and cost usage transformations, they need to continuously analyze, assess, and compare their own spend against customer spend and the corresponding margins on a month-over-month basis.
The Margin Analysis Dashboard, delivered through BillOps, allows users to perform such analysis effectively. It is made available through various pre-configured dashboards, including cost summaries, spend and margin trends, and variance reports.
Margin Analysis Dashboard
Perform the following steps to view and take actions on the Margin Analysis Dashboard:
1. Login to the Platform
You should see a landing page based on your preferences.
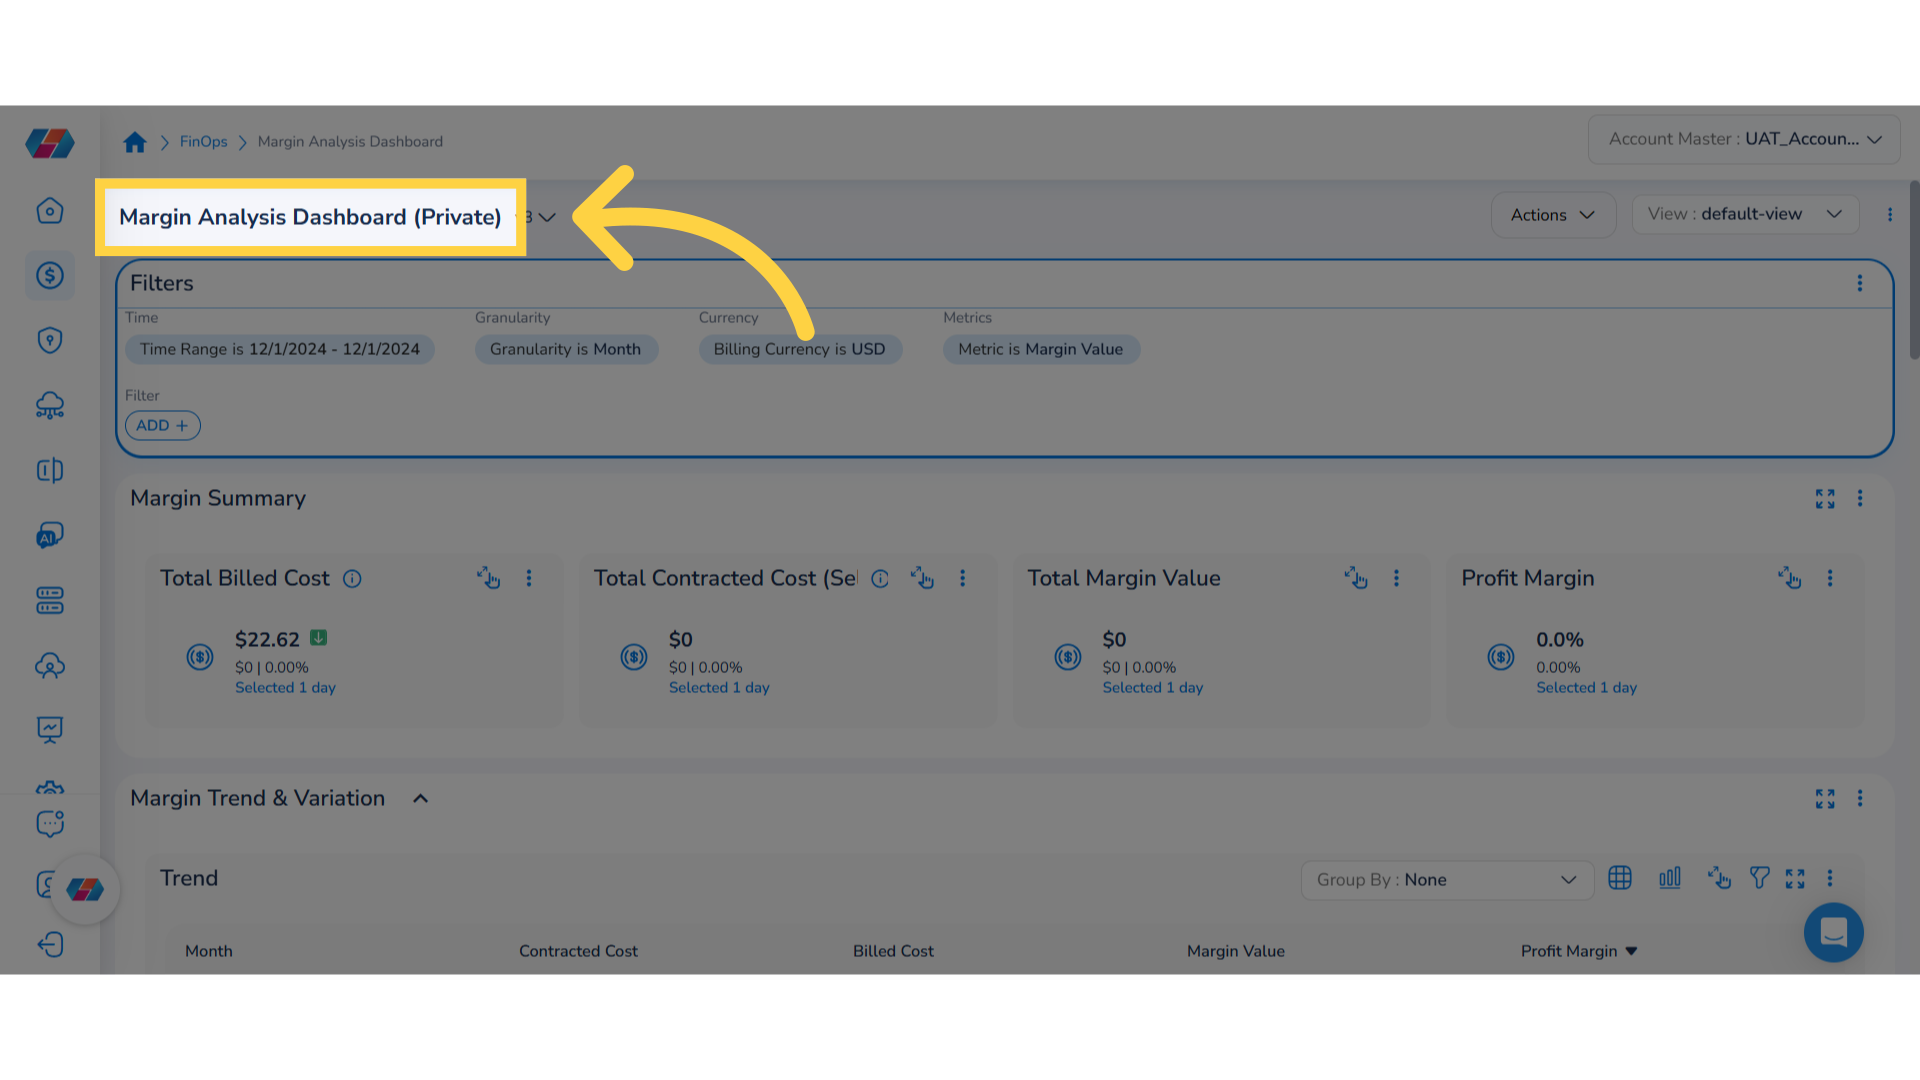
2. Navigate to Margin Analysis Dashboard
On the left navigation pane, click FinOps > Dashboard.
Then, click the drop-down on the top-left side of the screen and select the Margin Analysis Dashboard. The Margin Analysis Dashboard appears and it provides a comprehensive overview of your margins and performance metrics.
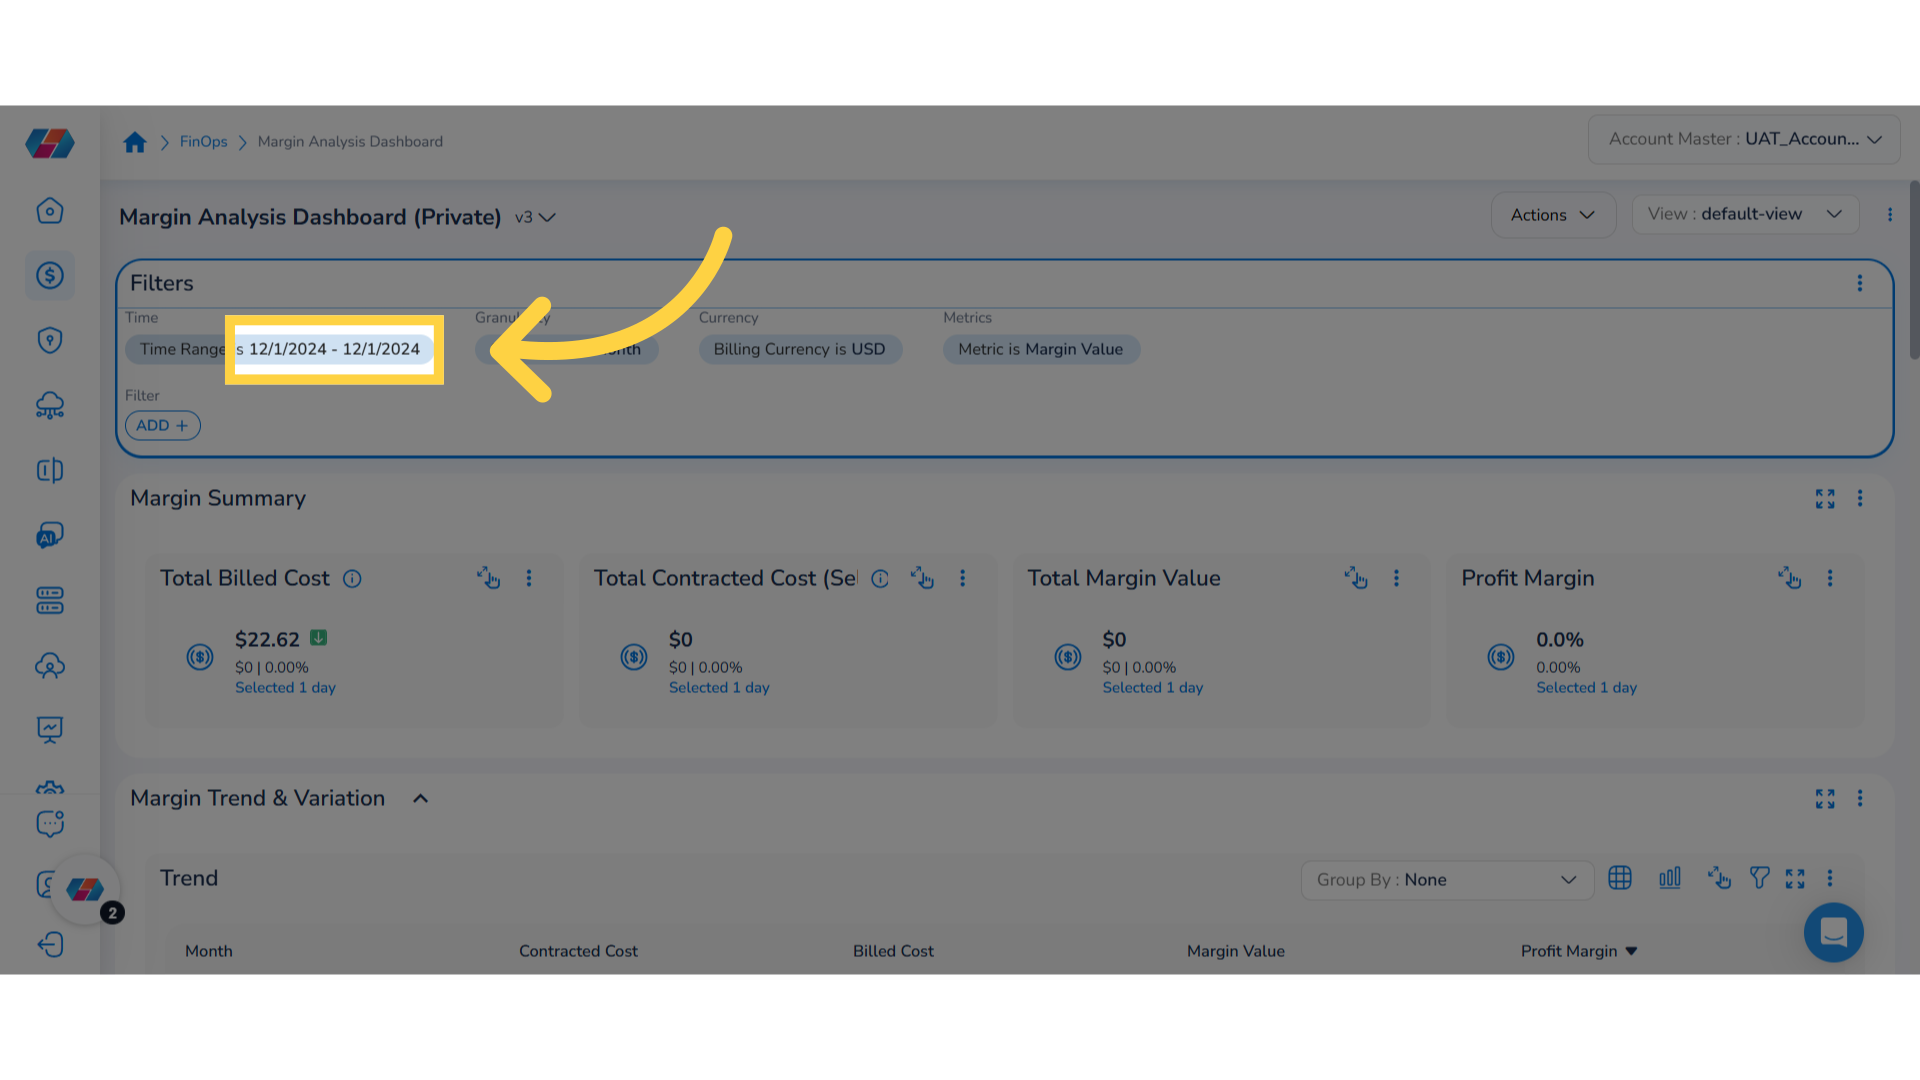
3. Select Value for "Time Range" Filter
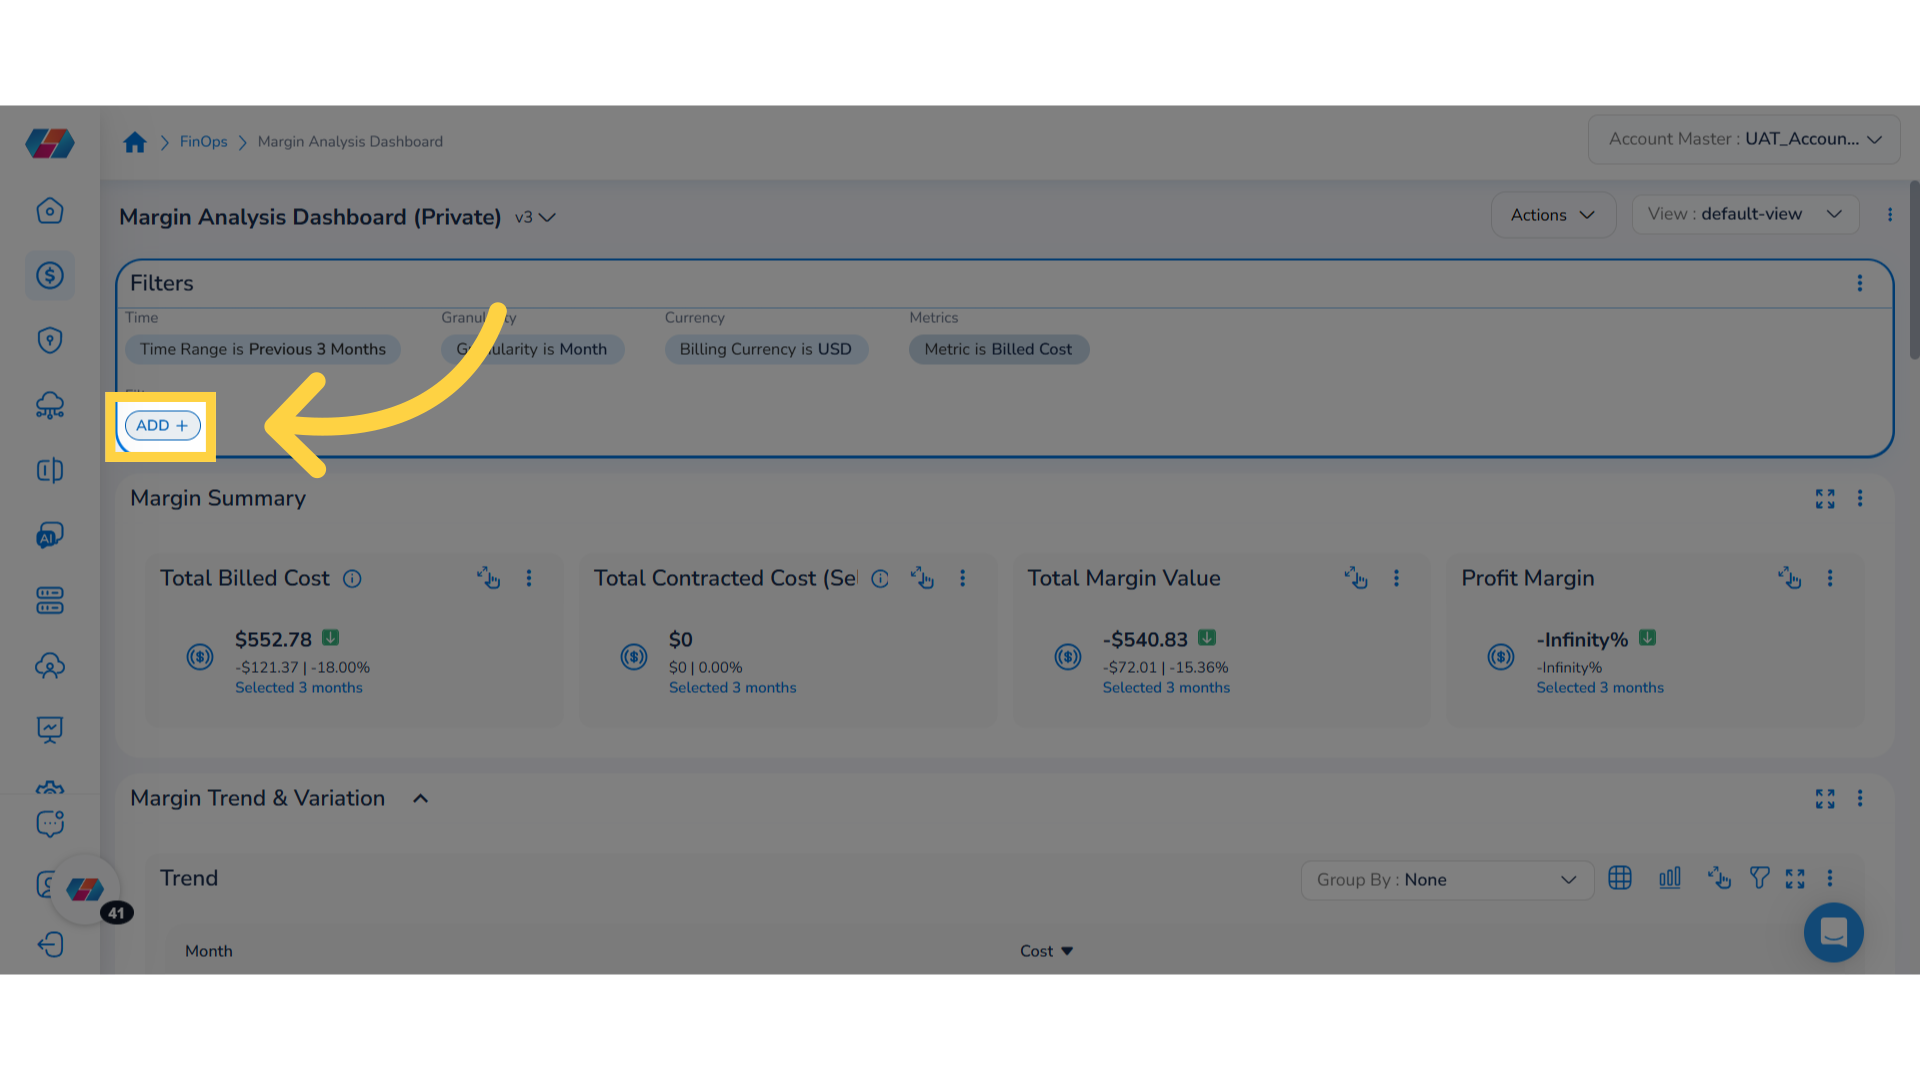
The Filters section shows the standard filters -- Time Range, Granularity, Currency, and Metrics. Users also have the option to add custom filters.
To select another time range, in the Time Range filter, click the drop-down list and select another time range as per which you would like to focus your analysis on.
4. Confirm Your Selection
Click Ok to confirm your selection.
5. Select Custom Range
To narrow down your data set and make your analysis more precise, you can select relevant options in the filters. For example, in the Time Range filter, select the Custom Range option. Next, click the calendar and select a time range, and click Ok to confirm your selection.
6. View Margin Summary
View the Margin Summary widget that shows -- Total Billed Cost, Total Contracted Cost, Total Margin Value, and Profit Margin.
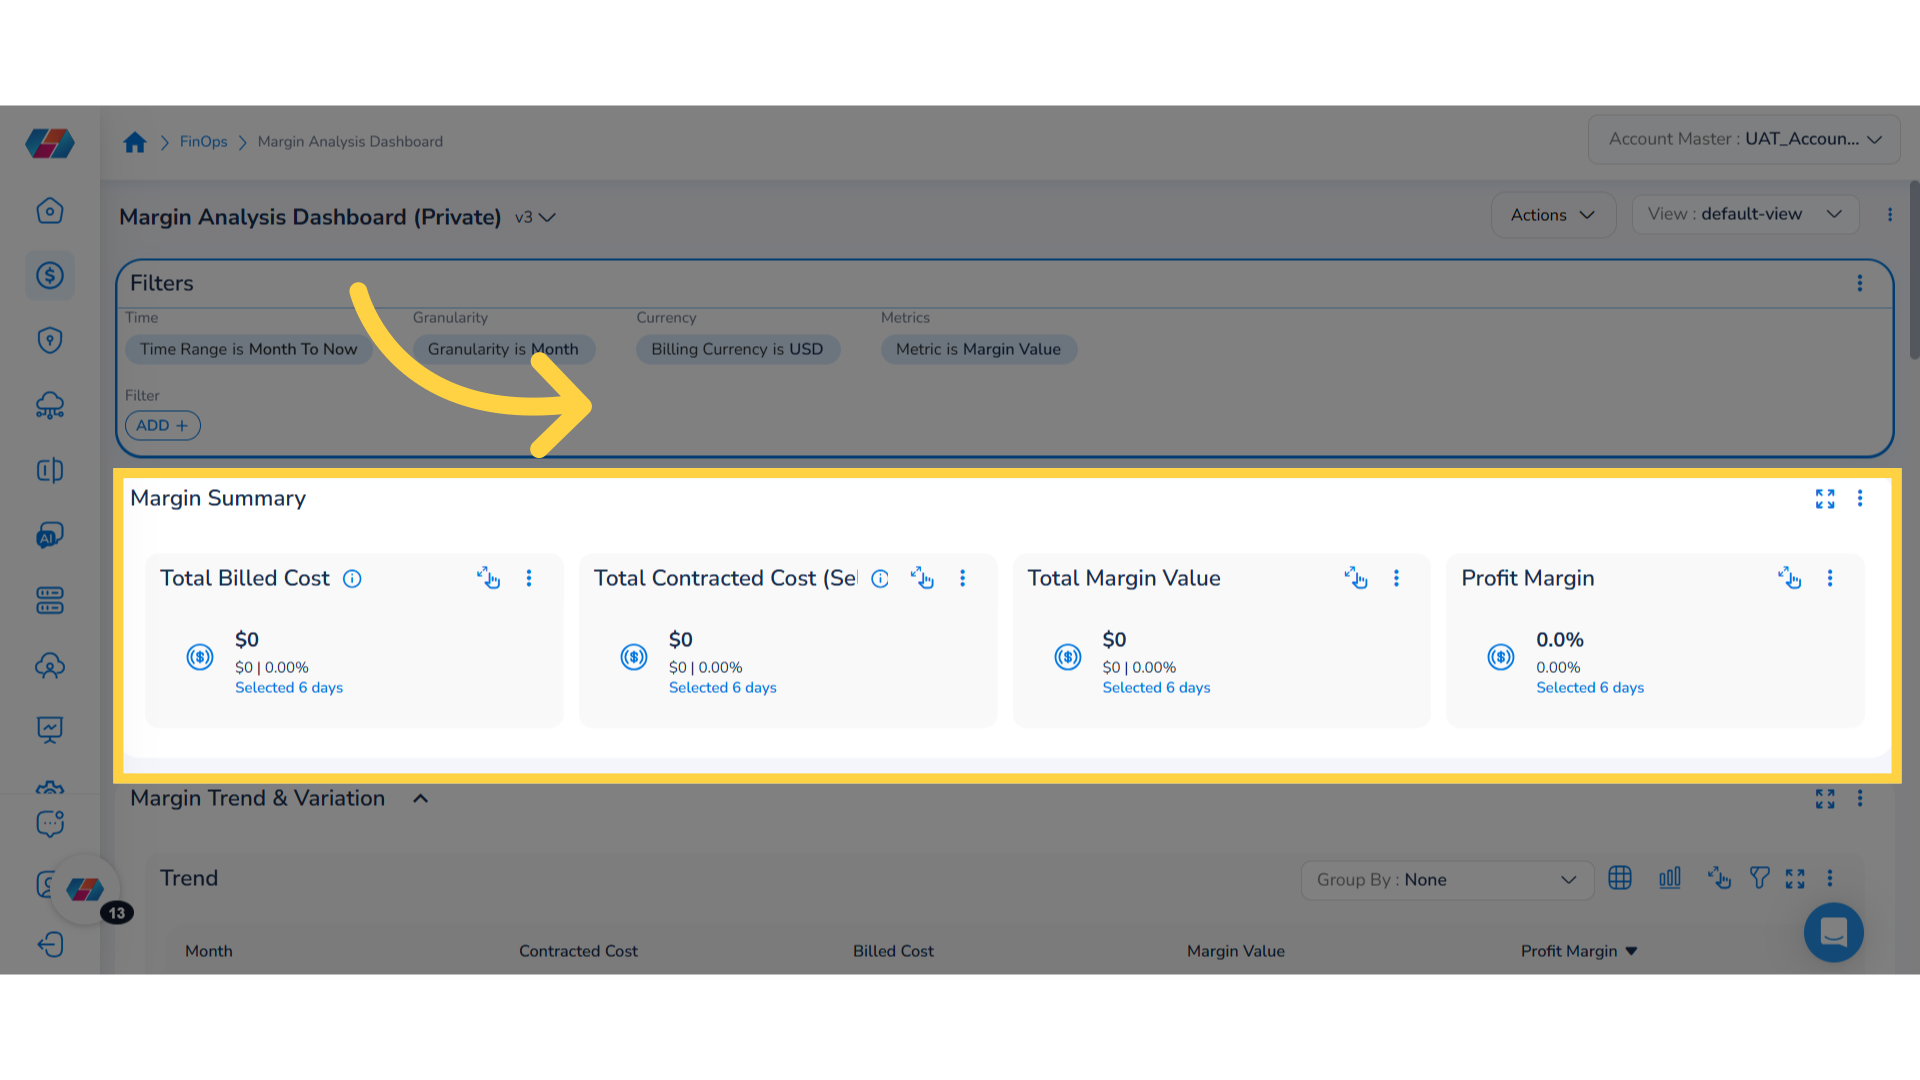
7. Select Options for the Filters
Select any relevant options in the standard filters to apply them to the dashboard.
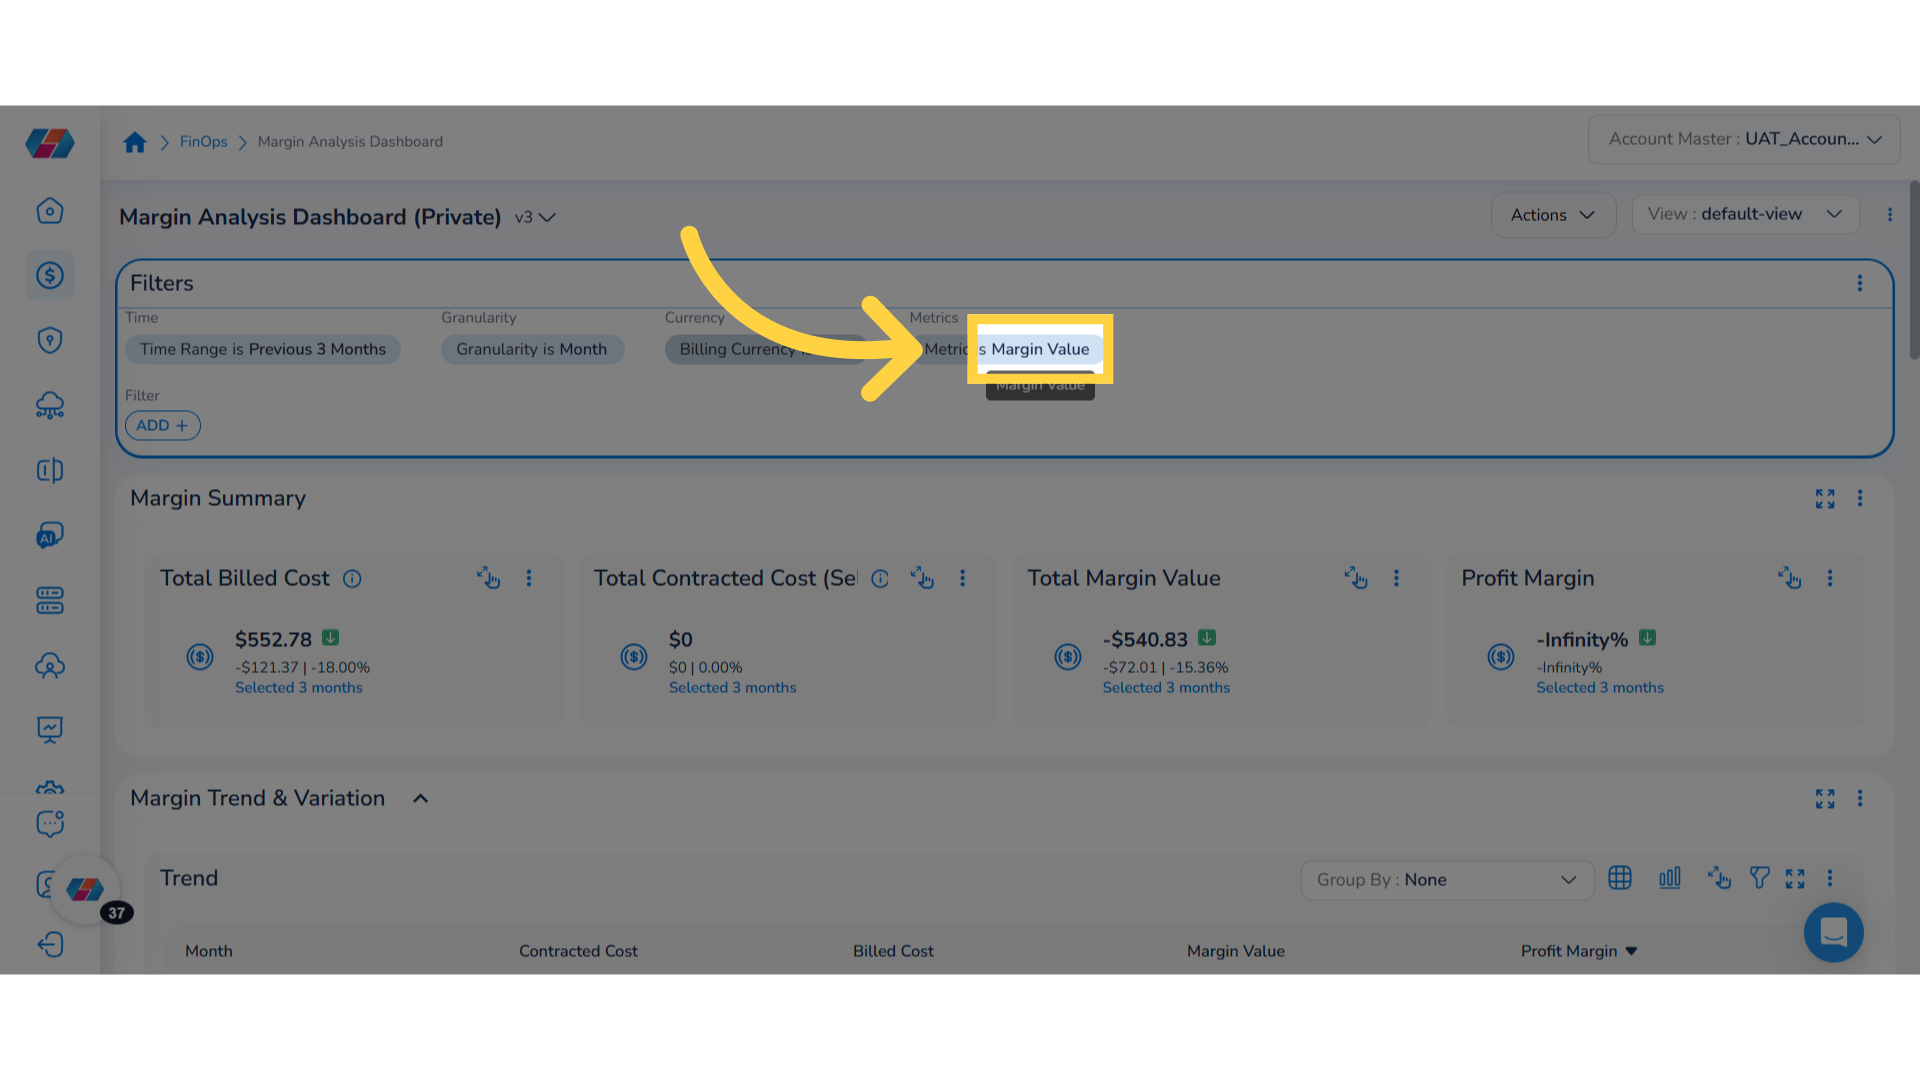
8. Select Value for "Metrics" Filter
For example, click the Metrics filter and select an option. Details will be shown in the dashboard as per the selected option.
9. Add Custom Filter
To add a custom filter, click ADD+.
10. Select "Cloud Provider"
From the list of filter options that appear, select an option. For example, in this case the user selects Cloud Provider.
11. Select Value for the Custom Filter
To add a value for the custom filter, click the drop-down list and select a value.
12. Confirm Your Selection
Click Ok to confirm your selection.
13. Click "Actions"
To take any action in the Margin Analysis Dashboard or widget, click Actions.
14. Select an Action
Users can take any of the following action on the dashboard, based on their need:
- Edit: Refer to this link to know about the steps -- https://docs.corestack.io/docs/create-edit-delete-dashboard#edit-a-dashboard-or-widget
- Add Widget: Refer to this link to know about the steps -- https://docs.corestack.io/docs/create-edit-delete-dashboard#add-a-dashboard-widget
- Edit Permissions: Refer to this link to know about the steps -- https://docs.corestack.io/docs/add-edit-remove-dashboard-permissions#addedit-dashboard-permissions
- View Subscriptions: Refer to this link to know about the steps-- https://docs.corestack.io/docs/subscribe-edit-and-unsubscribe-dashboard-email#edit-subscription
- Subscribe: Refer to this link to know about the steps -- https://docs.corestack.io/docs/subscribe-edit-and-unsubscribe-dashboard-email#subscribe-to-dashboard-email
- New: Refer to this link to know about the steps -- https://docs.corestack.io/docs/create-edit-delete-dashboard#create-a-dashboard
- Clone: Refer to this link to know about the steps -- https://docs.corestack.io/docs/clone-dashboard
- Delete: Refer to this link to know about the steps -- https://docs.corestack.io/docs/create-edit-delete-dashboard#delete-a-dashboard
- Import: Select this option to upload the details to be imported.
- Export: Select this option to export a dashboard.
- Export All: Select this option to export all dashboards.
15. Select Page View
The View drop-down list shows the list of views and users can switch to another page view any time. To change the view, click the drop-down list and select another view. The dashboard details will change and show details as per the slected view. You can click the delete icon to remove a dashboard view.
16. Take Action on a View
Users can click the ellipses and take any of the following action on a page view:
- Reset to View
- Update View
- Create New View
17. Create New View
To create a new dashboard view, click the ellipses and select Create New View.
18. Save New View
In the Create New View dialog box, in the Name box, enter the name of the new dashboard view and click Save.
Note: If you want to make the view as a private view, then select the Private View check box. Private views appear under the Private classification section of the View drop-down menu.
19. Select an Action on Filter Widget
To take any action on the Filter widget, click the ellipses and select any of the following actions:
- Configure widget
- Export config
- Copy
20. Take Action on Margin Summary Widget
To take an action on the Margin Summary widget, click the ellipses and select any of the following actions that you would like to take:
- Add Widget
- Configure Widget
- Export Config
- Copy
- Cut
21. Select "Configure Widget"
To configure widget details, click Configure widget. The Configure widget screen appears where you can make updates to the widget and then click Finish.
22. Enlarge Widget View
Users can click the icon with "four arrows pointing out" to enlarge a widget view and they can click back the icon to view the widget in standard size.
23. Select "Export Config"
Click Export config to export the widget.
24. Copy and Cut Actions
To copy a widget to another location in the dashboard, select the Copy action and to cut a widget, select the Cut option and paste the selected widget in desired location.
25. Hide or Display Filters
Users can click the Filter icon to hide or show the standard and custom filters.
26. View Accumulated Spend
In the Cost Trend widget, click the ellipses and select Accumulated Spend to view accumulated spend details.
27. View Distributed Spend
Again, in the Cost Trend widget, click the ellipses and select Distributed Spend to view the distributed spend.
28. View Drilldown Details
In the Margin Trend & Variation > Trend widget, click on a data point in the graph to view drilldown details. The drilldown details appears in a new pop-up window. In the Margin Variation Drilldown window, click on the data point for which you would like to view detailed information. Keep clicking data points to view detailed information.
29. Select "Limit Data"
In a widget, click the ellipses and select Limit Data, then select any option as per which you would like details to be displayed in the graph.
30. Select "Swap Axis"
In a widget, click the ellipses and select Swap Axis to exchange the horizontal axis with the vertical axis, and vice versa.
31. Select "Table View"
Click the square icon to view the widget details in tabular format.
32. Select "Chart View"
Click the graph icon to view the widget details in chart form.
33. Select "View As"
In the widget, click the ellipses and click View As, then select an option (for example: Stacked Column) to view the graph in different format. You will have to select one format from the list that is being displayed.
34. Additional Actions
Some additional actions that users can take on widget are:
- Subscribe: Refer to this link to know about the steps to subscribe to widget emails -- https://docs.corestack.io/docs/subscribe-edit-and-unsubscribe-dashboard-email#introduction
- Download as CSV: Use this option to download a widget in CSV format.
- Download as PNG: Use this option to download a widget in PNG format.
By effectively utilizing the Margin Analysis Dashboard, users will gain valuable insights into their financial metrics, allowing them to make informed decisions. The feature empowers teams to analyze trends, optimize margins, and ultimately enhance their financial performance, ensuring sustained business success.
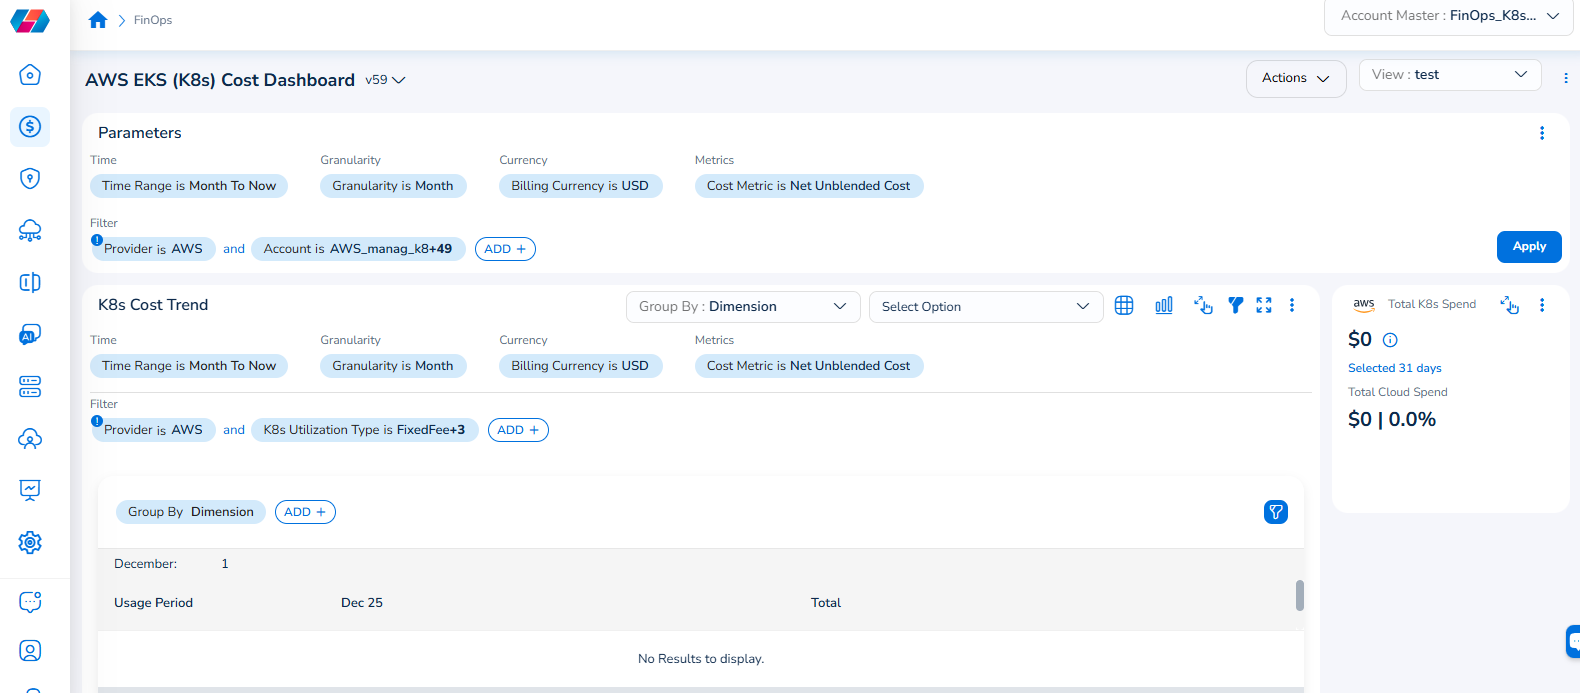
Note that the Cloud Account filter has been renamed to Account, and the Cloud Provider filter has been renamed to Provider.
For example, if you see the dashboard shown in the screenshot below, the Parameters > Filter section shows the Provider filter for which the value selected is AWS.
To add the Account filter, users can click ADD+ and select Account. In the drop-down list that appears, users can select all applicable values, and click Ok. Details will be displayed in widgets as per the selected filter(s).
In every widget that is available within a dashboard, users can click the Filter icon that appears on the top-right side of the widget and view the pre-defined filters. The Provider filter appears as a pre-defined filter. Users can use the ADD+ option to add custom filters and they have the option to add the Account filter from here.
Updated 7 months ago