

NextGen FinOps Report
CoreStack NextGen FinOps Report guide: analyze cloud spend with rate, quantity & UOM data, apply filters, group costs, and export or schedule reports.
Feature Overview
The NextGen FinOps Report is a consolidated charges report within CoreStack’s FinOps module that provides detailed visibility into cloud spend across all onboarded accounts. It is most relevant when you need granular cost analysis beyond what the Executive Dashboard provides — including line-item rate, quantity, and unit of measure data that lets you trace exactly how charges are calculated.
This report is most valuable to FinOps Practitioners and FinOps Admins who need to audit billing data, perform cost allocation, or share scheduled reports with stakeholders. The NextGen FinOps Report is not a dashboard widget — it generates a structured report with exportable output and does not support real-time cost monitoring.
Note: Kubernetes (K8S) cluster accounts are not currently supported in the NextGen FinOps Report. Costs associated with Kubernetes workloads will not appear in report results.
How It Works
When you navigate to the NextGen FinOps Report, CoreStack loads the Consolidated Charges Report view with the same filter set available in the Executive Dashboard. You apply filters and select group-by dimensions to shape the report, then click Apply to generate results. The report output is organized into three sections — Charge Summary, Charge Details, and Applied Filters — giving you a structured view of cost by charge type, grouped cost totals, and a record of the filters used. From the report view, you can download the output directly as PDF or CSV, preview a condensed version, or create a schedule to have the report delivered by email on a recurring basis.
Prerequisites
Before you begin, ensure the following:
-
Role: You have the FinOps Admin or FinOps Practitioner role assigned in CoreStack.
-
Cloud accounts: At least one cloud account (AWS, Azure, GCP, or OCI) is onboarded and actively ingesting billing data.
-
Access: You can navigate to FinOps > Reports in the CoreStack navigation bar.
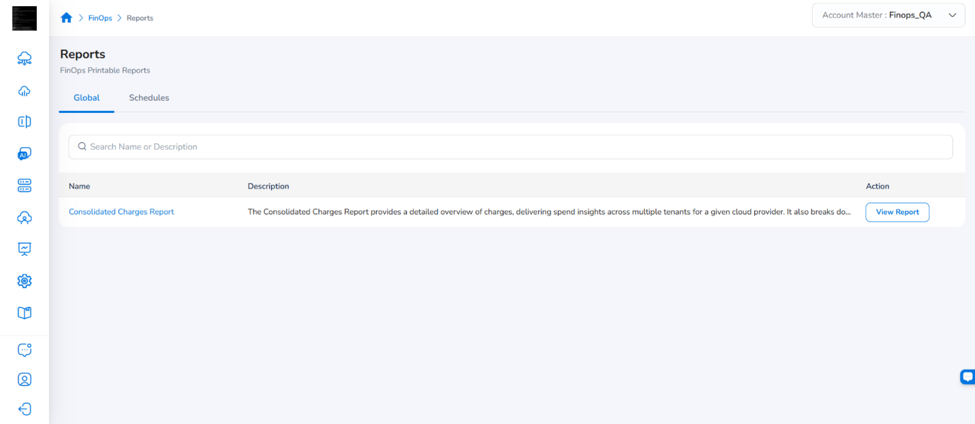
Generating a Consolidated Charges Report
Navigate to FinOps > Reports > Click on View Report. The Consolidated Charges Report opens with default filters applied.
Step 1: Apply filters
Select your filter criteria using the filter panel. The NextGen FinOps Report supports the same filter set as the Executive Dashboard, including time range, cloud provider, charge category, service, region, pricing category, tags, and additional FOCUS and cloud provider-specific attributes.
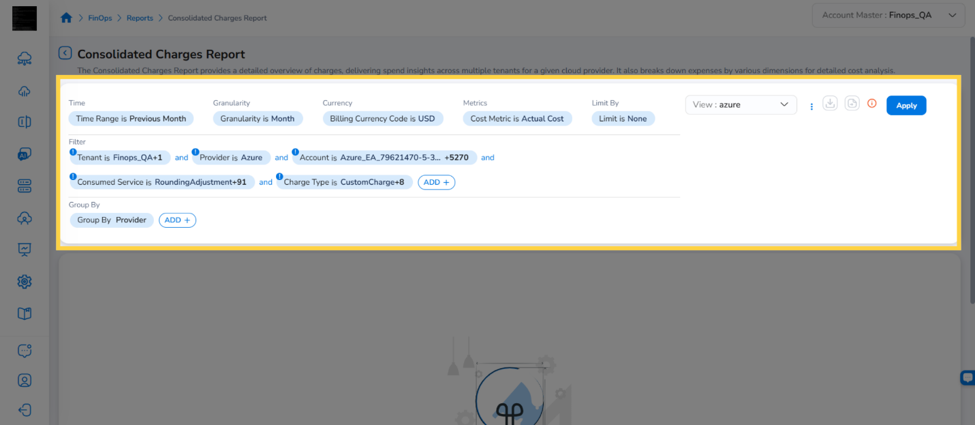
Step 2: Select Group By dimensions
In the Group By panel, select up to 5 dimensions to aggregate report data. The following group-by options are available:
-
All standard FOCUS and cloud provider-specific attributes (for example, Service Name, Region ID, Charge Category, Tag Key).
-
Charge Description: A line-item description field sourced from provider billing data.
-
Consumed Quantity and Unit Price: A group-by option that is available in the NextGen FinOps Report but not in the Executive Dashboard.
-
Additional Fields: Fields such as Instance Type (AWS only) and Commitment Discount ID are available as group-by dimensions under Additional Fields. These fields were previously available in dashboard widgets only.
Note: The NextGen FinOps Report supports up to 10 Group By selections.
Step 3: Set the Limit By filter
In the Limit By field, select how many records to display in the Charge Details section:
-
None: Display all records.
-
Top 20: Display the top 20 records by cost.
-
Top 50: Display the top 50 records by cost.
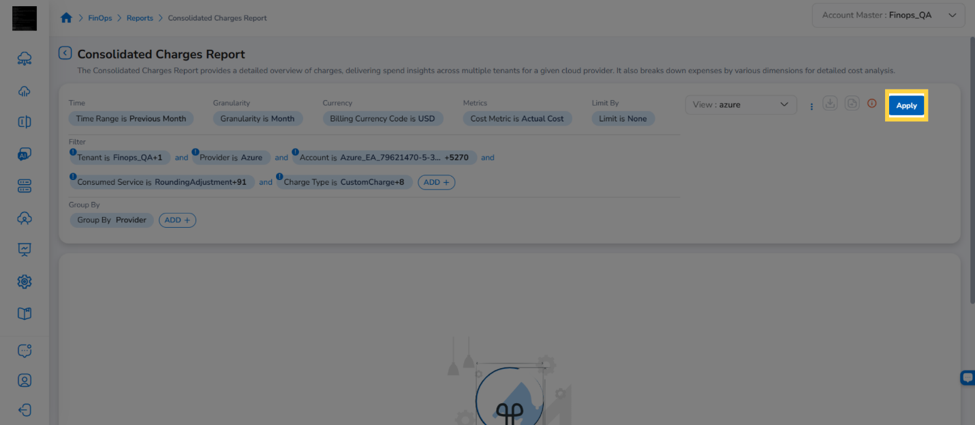
Step 4: Apply filters to generate the report
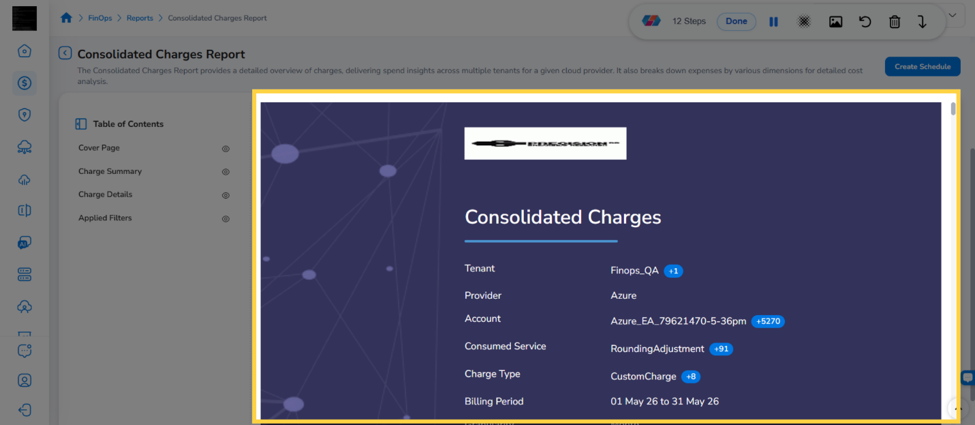
Click Apply. CoreStack generates the report and displays results in three sections:
-
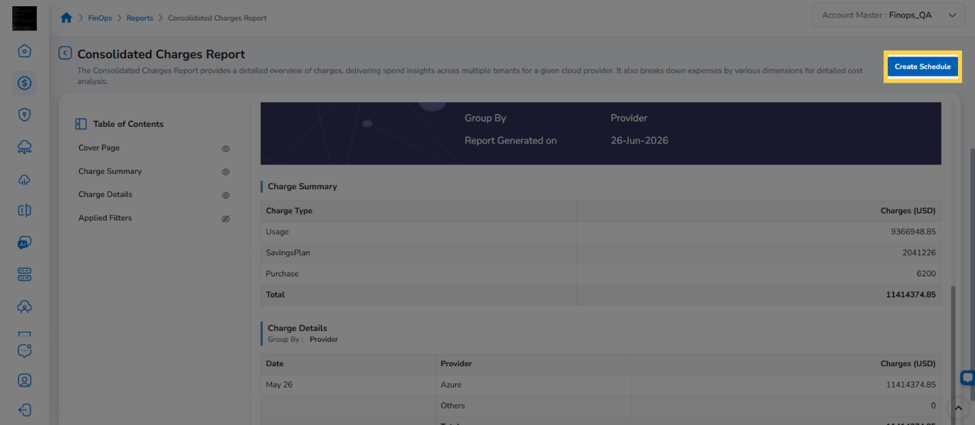
Charge Summary: Lists each selected charge type and its total cost.
-
Charge Details: Displays cost grouped by the dimensions you selected, including the following columns:
- Standard cost and usage columns
- Rate: The unit price for the charge.
- Quantity: The amount of usage consumed.
- Unit of Measure (UOM): The unit in which usage is measured (for example, GB, vCPU-Hours, Requests).
Note: Cost values in the Charge Details section follow the formula: Quantity × Rate = Cost. These values are aligned with the corresponding metrics in your source billing data.
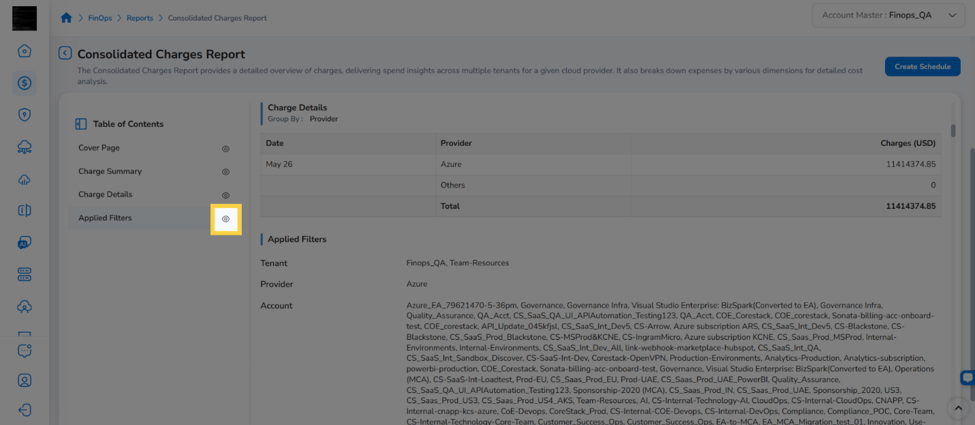
- Applied Filters: Lists all filters active for this report run.
Step 5: Preview the report (optional)
Click the Preview icon to open a condensed preview of the report. The preview shows limited data only. To view the full dataset, export or schedule the report.
Note: An info icon in the Charge Details section displays the message: “Report Charge Details on preview provide a quick view with limited data only. Download or schedule to check the full report.”
Saving a View
You can save your current filter and group-by configuration as a named view to reuse later.
Save a new view
Click Save View and enter a name for the view. The view is saved and available from the view selector.
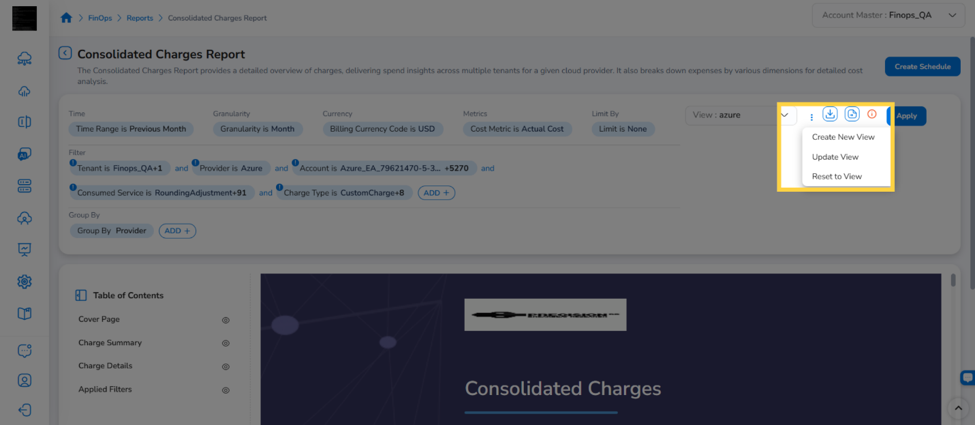
Update or reset a view
To update an existing view with your current configuration, click Update View. To discard changes and return to the saved configuration, click Reset to View.
Hide or Show Sections
Click the eye icon next to a section in the Table of Contents to show or hide that section in the report view. This lets you focus on the sections most relevant to your analysis.
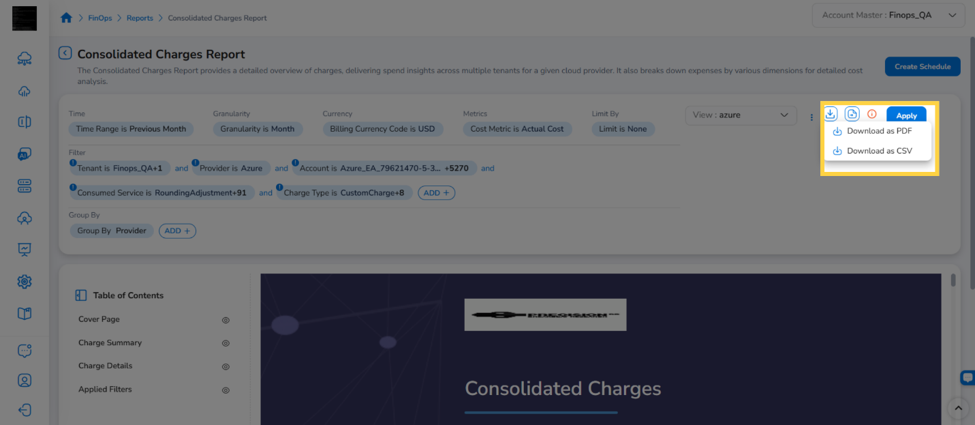
Exporting and Scheduling the Report
Download the report directly
Click the Download icon and select either Download as PDF or Download as CSV. The file downloads immediately and contains the full report dataset.
Create a schedule
To receive the report by email on a recurring basis:
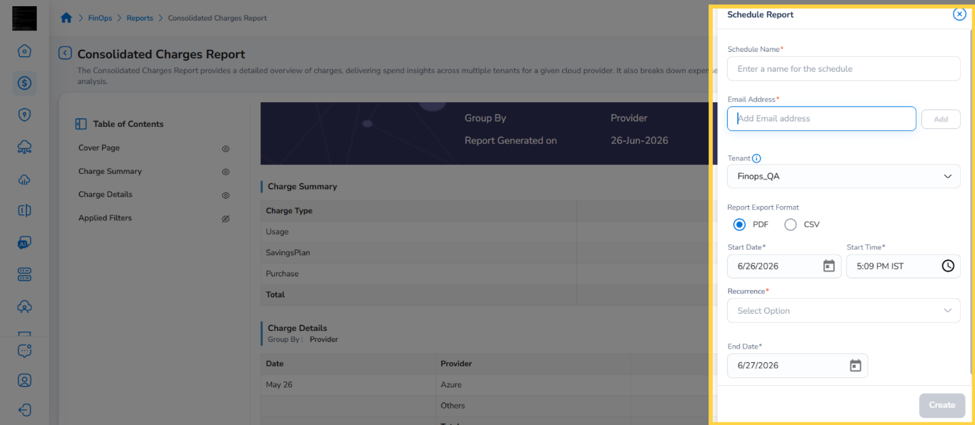
- Click Create Schedule. The Schedule Report panel opens on the right.
- Enter a name in the Schedule Name field.
- Enter the recipient email address in the Email Address field and click Add.
- Select the report export format: PDF or CSV.
- Set the Start Date, Start Time, Recurrence, and End Date.
- Click Create. The schedule is saved and will deliver the report to the specified email address at the configured interval.
Tip: To view and manage all active schedules, navigate to
FinOps > Reportsand click the Schedules tab.
Frequently Asked Questions
Q: What is the difference between the NextGen FinOps Report and the Executive Dashboard?
The NextGen FinOps Report generates a structured, exportable report with up to 10 group-by dimensions, Rate, Quantity, and UOM columns, and a Limit By filter. The Executive Dashboard is a visual, widget-based view of cost data with a maximum of 5 group-by selections and no direct export from the report view. The filter sets are the same across both.
Q: Why do I see limited data in the preview?
The preview is a quick-view mode that shows a condensed subset of your report data. It is intended to help you verify that the report looks correct before downloading. To see the full dataset, use Download as PDF, Download as CSV, or create a schedule.
Can I use the Rate, Quantity, and UOM columns in exported files?
Yes. The Rate, Quantity, and Unit of Measure columns are included in both PDF and CSV exports of the Consolidated Charges Report. The values are sourced directly from your cloud provider billing data and follow the formula: Quantity × Rate = Cost.
Q: Why is my Kubernetes account cost not showing in the report?
Kubernetes (K8S) cluster accounts are not currently supported in the NextGen FinOps Report. Kubernetes workload costs will not appear in report results regardless of the filters applied.
Q: How do I find Commitment Discount or Instance Type data in the report?
These fields are available under Additional Fields in the Group By panel. Select Instance Type (AWS only) or Commitment Discount ID to include them as group-by dimensions in your report output.
Troubleshooting
The report shows no data after clicking Apply
Cause: The applied filters may be too restrictive, or the selected time range may not have corresponding billing data ingested.
Solution:
-
Expand the Time Range filter to a broader period (for example, the previous month).
-
Remove one or more filters to widen the result set.
-
Confirm that at least one cloud account is onboarded and has completed billing data ingestion.
-
Click Apply again. If data is available for the selected criteria, results appear in the Charge Summary and Charge Details sections.
If the issue persists, contact CoreStack support with your account name, the filters applied, and the selected time range.
The Consumed Quantity and Unit Price group-by option is not visible
Cause: This group-by option may require specific conditions to be enabled.
Solution:
-
Ensure you are using the NextGen FinOps Report and not the Executive Dashboard, as this group-by is not available in the Executive Dashboard.
-
If the option is still not visible, contact CoreStack support to confirm whether this group-by is available for your account configuration.
Scheduled report emails are not being received
Cause: The recipient email address may be incorrect, or the schedule may not have saved successfully.
Solution:
-
Navigate to
FinOps > Reportsand click the Schedules tab. Confirm that your schedule appears in the list. -
Verify that the email address listed on the schedule is correct.
-
Check your spam or junk folder for emails from CoreStack.
-
If the schedule is listed and the email address is correct but emails are still not arriving, contact CoreStack support with the schedule name and recipient address.
Updated 20 days ago