

Infrastructure Issues - By Region
In this user guide, users can identify and investigate regional cloud security hotspots across AWS, Azure, OCI and GCP using an interactive world map on the Graphion Infrastructure Dashboard.
Feature Overview
The Infrastructure Issues by Region widget is part of the Graphion module's Cloud Security Dashboard. It provides a global geographic visualization of cloud infrastructure security risks detected across your AWS, Azure, OCI, GCP cloud accounts. Security teams can use this widget to quickly spot which geographic regions have the highest concentration of issues and prioritize remediation efforts accordingly.
The widget is relevant to Security Analysts, Cloud Security Engineers, Infrastructure Operations teams, and CISO-level stakeholderswho need high-level risk visibility across their cloud footprint. It does not replace detailed Explorer views — it serves as a visual entry point for identifying hotspots before drilling into specific findings.
Note: Infrastructure Issues - By Region widget is visible only if your organization has the appropriate product bundle and you have been assigned the appropriate roles and permissions. If the widget does not appear on the Cloud Security Dashboard, contact your Tenant Admin to confirm bundle activation and role assignment.
How It Works
The widget renders a world map with proportional bubbles positioned at the geographic location of each cloud region. Bubble size reflects the total number of security issues in that region — larger bubbles indicate more issues. Hovering over a bubble shows a tooltip with the region name, cloud provider, and total issue count. Clicking a bubble opens a modal that breaks down the issues by type: Vulnerabilities, Misconfigurations, and Threats, each shown with a count and percentage share. Clicking a bar in the modal navigates directly to the corresponding Explorer table, pre-filtered by that region and issue type, where you can review and act on individual findings.
Prerequisites
Before using this feature, confirm the following:
- Roles and Permissions: You have the necessary roles and permissions assigned in CoreStack under the appropriate bundles.
- Cloud Accounts: At least one cloud account (AWS, Azure, OCI or GCP) has been onboarded and scanned in CoreStack.
- Access: You can navigate to Graphion > Cloud Security > Cloud Security Dashboard using the CoreStack left navigation sidebar.
Using Infrastructure Issues by Region
Step 1: Open the Cloud Security Dashboard
Navigate to Graphion> Cloud Security > Cloud Security Dashboard.
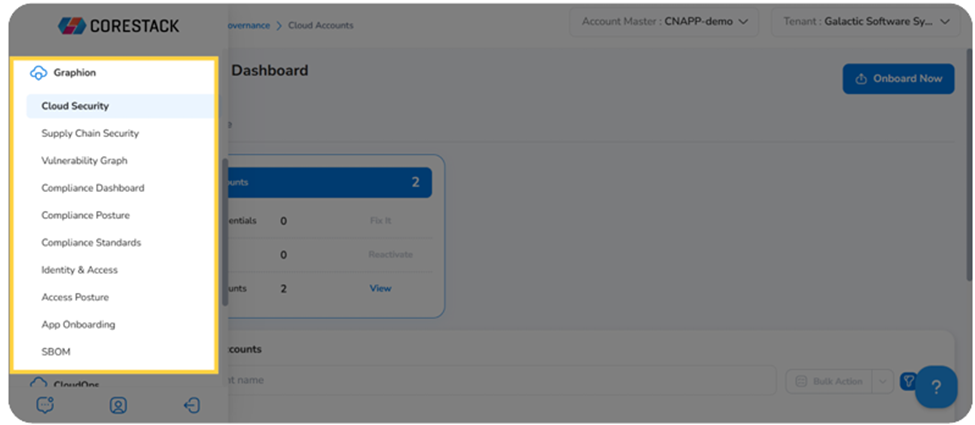
The Infrastructure Dashboard loads, displaying multiple security widgets. Scroll down to locate the Infrastructure Issues by Region widget.
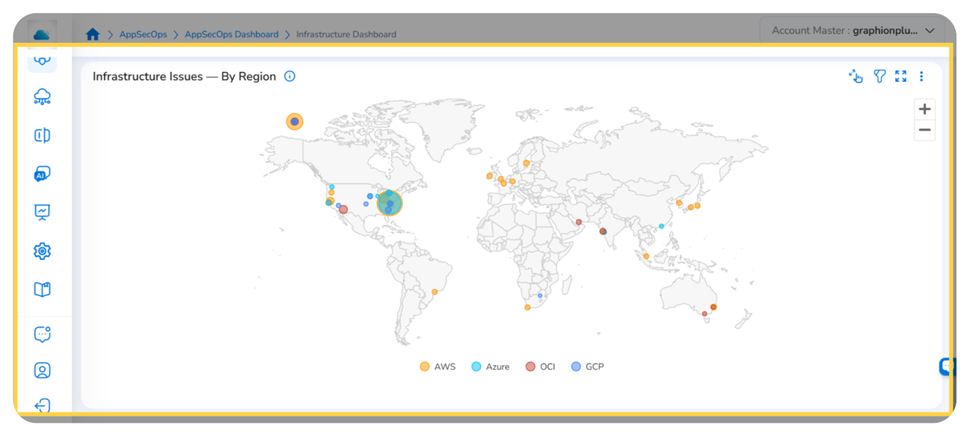
Infrastructure Issues by Region widget displaying regional issue hotspots across cloud providers
Step 2: Identify High-Risk Regions on the Map
The map displays proportional bubbles at each cloud region. Bubble size reflects the total issue count for that region — larger bubbles indicate more security issues. Bubble colour identifies the cloud provider: AWS (yellow/orange), Azure (light blue), OCI (red). GCP (dark blue)
To inspect a region, hover over any bubble. A tooltip appears showing:
- Region name
- Cloud provider
- Total issue count
The map supports zoom and pan. Use your mouse scroll wheel to zoom in and drag to pan to specific geographic areas.
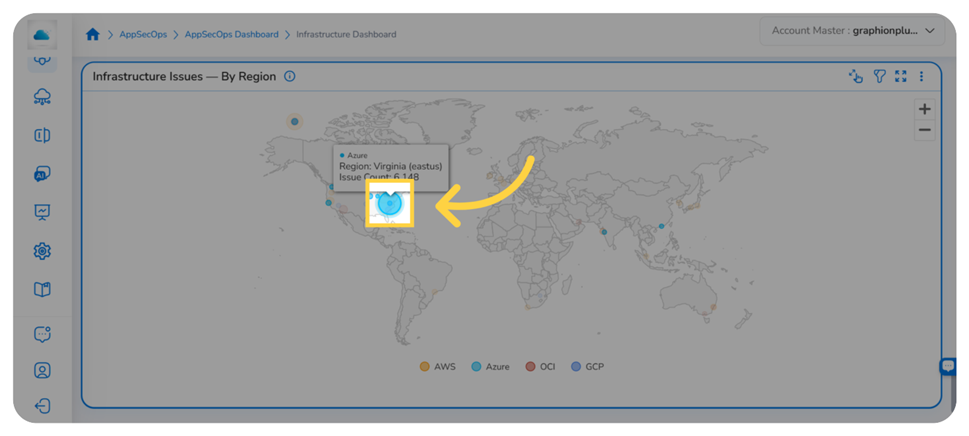
Hovering over a region bubble reveals the cloud provider, region name, and total issue count
Step 3: View the Issue Type Breakdown for a Region
Click any region bubble on the map. A modal opens showing the issue type breakdown for that region. The modal displays three categories as a bar chart:
- Vulnerabilities — software flaws or weaknesses in infrastructure configurations
- Misconfigurations — cloud resource settings that deviate from security best practices
- Threats — active indicators of potentially malicious activity detected in your environment
Each bar shows the issue count and its percentage share of the total for that region.
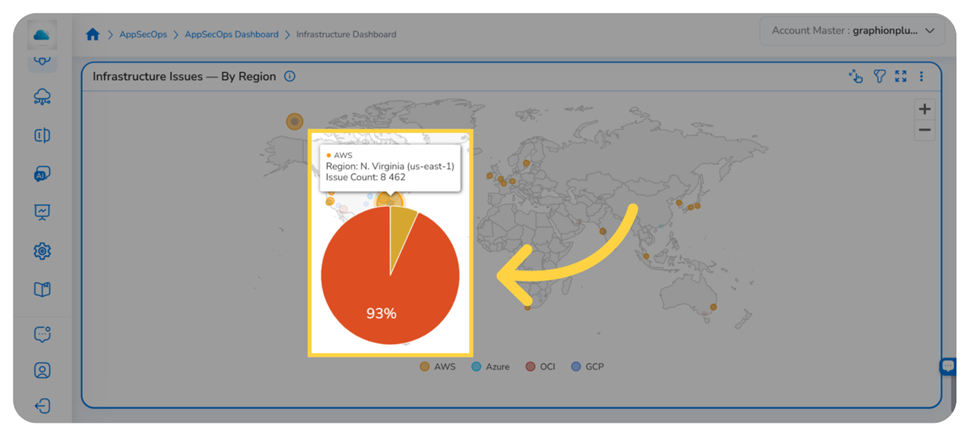
Clicking a region bubble opens the issue type breakdown showing the distribution of issues by category
Note: A category with a count of 0 still appears in the modal. You can still click it to navigate to the Explorer, which will display an empty filtered view.
Step 4: Drill Down to the Explorer Table
In the breakdown modal, click a category bar — for example, Vulnerabilities. CoreStack navigates to the corresponding Explorer table, pre-filtered by the selected region and issue type.
Use the Explorer table to review individual findings, assess severity, and take remediation action. The region and issue type filters are applied automatically based on your selection from the modal.
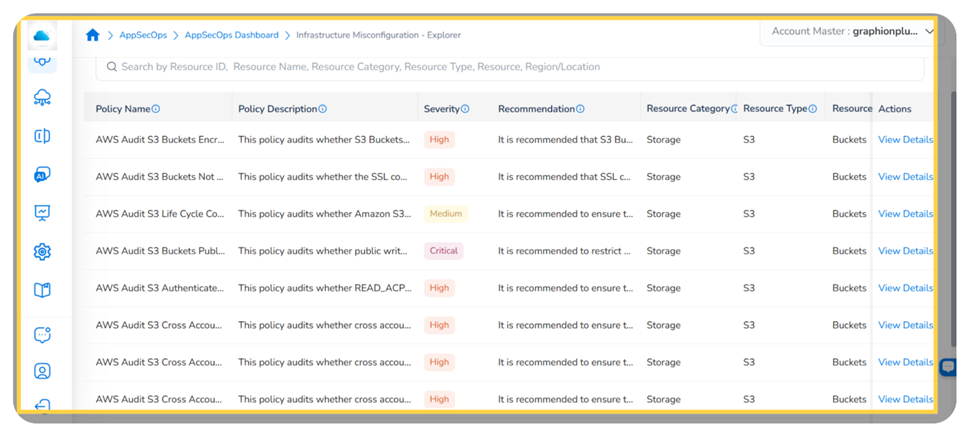
The Explorer table pre-filtered by region and issue type, listing individual security findings ready for triage and remediation
For full guidance on navigating the explorers, reviewing finding details, and taking remediation actions, see the Infrastructure Explorers user guide
Widget Actions
Each widget in the Infrastructure Dashboard has a set of options accessible from the widget toolbar at the top right. These options allow users to filter, expand, and take further actions on any chart.
Filter
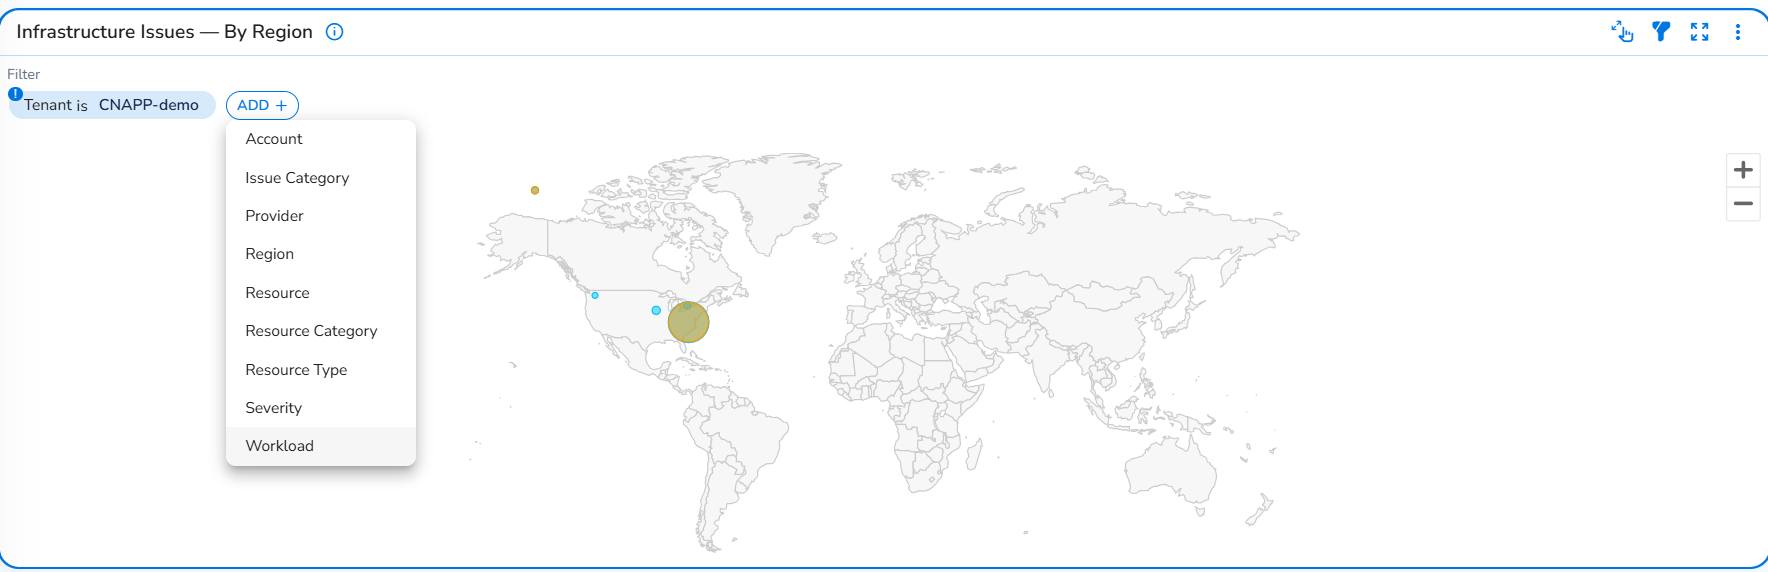
Click the Filter icon in the widget toolbar to open or hide the filter panel. The filter panel shows any active filters and lets you add custom filters.
- To add a filter: Click ADD+, select the filter type from the dropdown, then select the values to filter by.
- To remove a filter: Click the filter chip to deselect it or clear it from the panel.
- To hide the filter panel: Click the Filter icon again.
Note: The Workload Filter is available as a widget-level filter on the Infrastructure Issues - By Region widget. Each workload in CoreStack corresponds to an onboarded cloud account and is created automatically — no manual setup is required. Applying a Workload filter scopes the map to display only the regional bubbles associated with the selected cloud account, removing all other accounts' regions from the visualization.
Use the Workload filter when you need to:
- View the geographic spread of security issues for a specific cloud account across its deployed regions
- Determine whether a regional hotspot is driven by a particular cloud account rather than a shared pattern across accounts
- Compare the regional risk distribution of different cloud accounts by applying the filter on this widget independently of other dashboard widgets
To apply the filter, click the Filter icon on the widget, select Workload from the filter attribute dropdown, choose the workload from the value list, and click Ok. The map refreshes immediately, showing only the regions and bubbles associated with the selected workload.
Expand View
Click the Expand View icon in the widget toolbar to open the widget in full-screen mode. This is useful for reading dense charts with many data points. Click the icon again to return to the standard dashboard view.
Actions
Click the ellipsis icon in the widget toolbar to open the Actions menu. The following actions are available:
- Export config: Export the current widget configuration.
- Subscribe: Set up a subscription for automated delivery of this widget's data.
- Download as CSV: Download the chart data as a CSV file.
- Download as PNG: Save the current chart as a PNG image.
Tip: Use the breadcrumb at the top of the Explorer to navigate back to the Cloud Security Dashboard when you have finished reviewing a region's findings.
Frequently Asked Questions
Which cloud providers are supported?
The Infrastructure Issues by Region widget supports AWS, Azure, OCI and GCP.
Why does a region have no bubble on the map?
Regions with no detected security issues are not represented with a bubble. If you expect a region to appear but it does not, verify that the associated cloud account is onboarded and active in CoreStack, and that a security scan has been completed for that account.
What does each issue type mean?
Vulnerabilities are software flaws or weaknesses in your infrastructure's configuration. Misconfigurations are cloud resource settings that deviate from security best practices or policy rules. Threats are active indicators of potentially malicious activity detected across your cloud environment.
Can I zoom into a specific region on the map?
Yes. The map supports zoom and pan. Use your mouse scroll wheel to zoom in or out, and drag to reposition the map.
Troubleshooting
The widget shows no data
Cause: No cloud accounts are onboarded, or a security scan has not yet completed for the active accounts.
Solution:
- Verify that at least one AWS, Azure, OCI or GCP cloud account is onboarded and set to Active on the platform.
- Confirm that a security scan has been run for the account. Scans may take several minutes to complete after onboarding.
- If accounts are active and scans have completed but no data appears, contact your CoreStack administrator.
A region bubble is not clickable
Cause: The widget may not have fully loaded, or a browser extension is interfering with the interactive map.
Solution:
- Wait for the widget to fully load — a loading indicator may appear briefly on the map.
- If the map appears unresponsive, refresh the browser page and navigate back to the Infrastructure Dashboard.
- If the issue continues, try disabling browser extensions and reloading the page.
The Explorer does not reflect the expected region or issue type filter
Cause: The wrong category may have been selected in the breakdown popup, or the popup was dismissed before clicking a category.
Solution:
- Return to the Cloud Security Dashboard and click the region bubble again to reopen the breakdown popup.
- Confirm you are clicking the correct category bar — Vulnerabilities, Misconfigurations, or Threats.
- If filters are still missing in the Explorer, clear existing Explorer filters and try the drill-down again.
The Cloud Security Dashboard is not visible under Graphion > Cloud Security
Cause: The Infrastructure Dashboard may not be configured for your tenant, or your role does not include access to it.
Solution:
- Confirm with a CoreStack administrator if you have the necessary roles and permissions assigned under the appropriate bundles.
- Check with your CoreStack administrator that the Infrastructure Dashboard has been enabled for your tenant.
- If your role was recently updated, log out and log back in to refresh your permissions.
Updated 10 days ago