

Azure Application Insights
Introduction
CoreStack integrates with Azure Application Insights (an extension of Azure Monitor) to provide APM (Application Performance Monitoring) features.
APM tools are useful to monitor applications across development, testing, and production in the following ways:
- Proactively understand how an application is performing
- Reactively review application execution data to determine the cause of an incident
In addition to collecting metrics and application telemetry data, which describe application activities and health, Application Insights can also be used to collect and store application trace logging data.
The log trace is associated with other telemetry to give a detailed view of any activity. Adding trace logging to existing apps only requires providing a destination for the logs; the logging framework rarely needs to be changed.
Application Insights provides other features including, but not limited to:
- Live Metrics – Observe activity from your deployed application in real time with no effect on the host environment.
- Availability – Also known as “Synthetic Transaction Monitoring.” Probe your application's external endpoint(s) to test the overall availability and responsiveness over time.
- GitHub or Azure DevOps integration – Create GitHub or Azure DevOps work items in context of your Application Insights data.
- Usage – Understand which features are popular with users and how users interact and use your application.
- Smart Detection – Automatic failure and anomaly detection through proactive telemetry analysis.
In addition, Application Insights supports Distributed Tracing, also known as “distributed component correlation”. This feature allows searching for and visualization of an end-to-end flow of a given execution or transaction. The ability to trace activity end-to-end is increasingly important for applications that have been built as distributed components or microservices.
The Application Map allows a high level, top-down view of the application architecture and at-a-glance visual references to component health and responsiveness.
To understand the number of Application Insights resources required to cover your application or components across your environments, refer to the Application Insights deployment planning guide.
Setup a Python Application
This section explains how to set up a Python Flask web app with Azure Application Insights monitoring integration.
- To run the Python Flask web application, create an Azure Application Insights resource and get the instrumentation key.
- Define an environment variable named INSTRUMENTATION_KEY.
- Use bash to input the command:
export INSTRUMENTATION_KEY='YOUR_APPINSIGHT_INSTRUMENTATION_KEY' - Install pip packages by inputting:
pip install -r ./requirements.txt. - Run the application with:
python runserver.py. - Wait as it generates the data for Application Insights.
- Browse the web application to generate traces with different log levels:
@app.route("/")
def hello():
   app.logger.debug('This is a debug log message')
   app.logger.info('This is an information log message')
   app.logger.warn('This is a warning log message')
   app.logger.error('This is an error message')
   app.logger.critical('This is a critical message')
return "Hello World!"**- Browse the error to raise an unhandled exception:
@app.route("/error")
def hello_error():
   a = 42
   b = 0
   c = a/b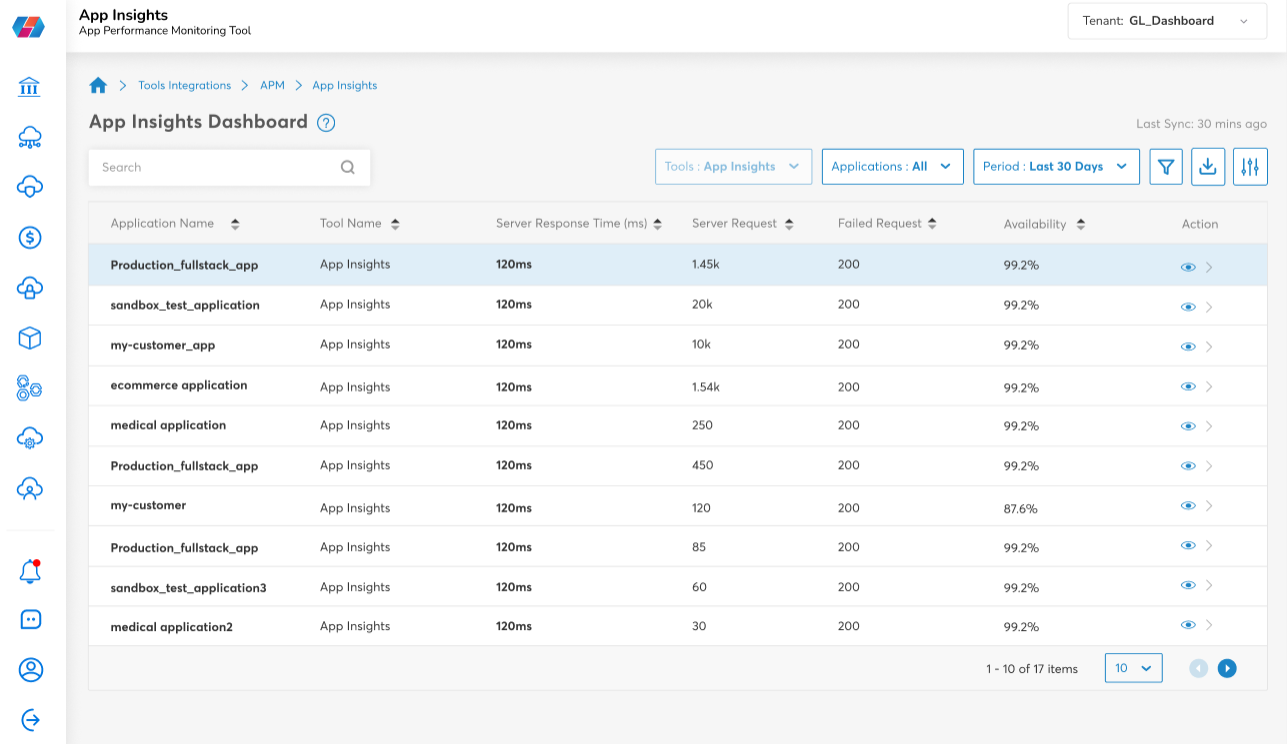
return "a / b = {c}".format(c=c)**- Open App Insights Dashboard. The data should now be visible.
Updated 9 months ago