

Infrastructure Resources and Issues – Flow
The user guide helps the users to visualize how security issues flow across cloud providers, resource categories, and issue types using the interactive Sankey chart on the Graphion Infrastructure Dashboard.
Feature Overview
The Infrastructure Resources and Issues – Flow widget is part of the Graphion module's Cloud Security Dashboard. It renders an interactive Sankey chart that maps the flow of security issues from cloud providers through resource categories to issue types, giving teams a multi-dimensional view of their risk distribution across AWS, Azure, GCP, and OCI.
The chart is designed for Security Analysts, Cloud Engineers, Developers, SOC Personnel, and Operations and Compliance teams who need to understand where security risks originate, which resource categories carry the most issues, and which findings are actionable. It serves as a visual entry point for prioritizing remediation before drilling into specific findings in the Explorer.
The widget is available only within the Cloud Security Dashboard.
Note: The Infrastructure Resources and Issues – Flow widget is only visible if your organization has the appropriate product bundle and you have been assigned the appropriate roles and permissions. If the widget does not appear on the Cloud Security Dashboard, contact your Tenant Admin to confirm bundle activation and role assignment.
How It Works
The Sankey chart visualizes issue flow across four sequential nodes:
- Cloud Provider (AWS, Azure, GCP, OCI)
- Resource Category (Compute, Identity, Security & Compliance, Databases, Containers)
- Issue Type (Vulnerabilities, Misconfigurations, Threats)
Each band connecting two nodes represents a flow path between that specific combination of cloud provider, resource category, and issue type. Bands are colour-coded to help identify issue types and provider origins at a glance.
Hovering over any band displays a tooltip identifying the resource category and the issue type (Vulnerability, Misconfiguration, or Threat) for that specific flow path.
Clicking a node on the right side (Vulnerabilities, Threats, or Misconfigurations) navigates directly to the Infrastructure Issues Explorer, pre-filtered by the selected issue type, where individual findings can be reviewed and remediated.
Prerequisites
Before using this feature, confirm the following:
- Roles and Permissions: You have the necessary roles and permissions assigned in assigned in CoreStack under the appropriate bundles.
- Cloud Accounts: At least one cloud account (AWS, Azure, GCP, or OCI) has been onboarded and scanned in CoreStack. Security issues appear only after at least one completed scan.
- Access: You can navigate to Graphion > Cloud Security > Cloud Security Dashboard using the CoreStack left navigation sidebar.
Using Infrastructure Resources and Issues – Flow
Step 1: Open the Cloud Security Dashboard
In the left navigation pane, click Graphion to open the module and click on Cloud Security.
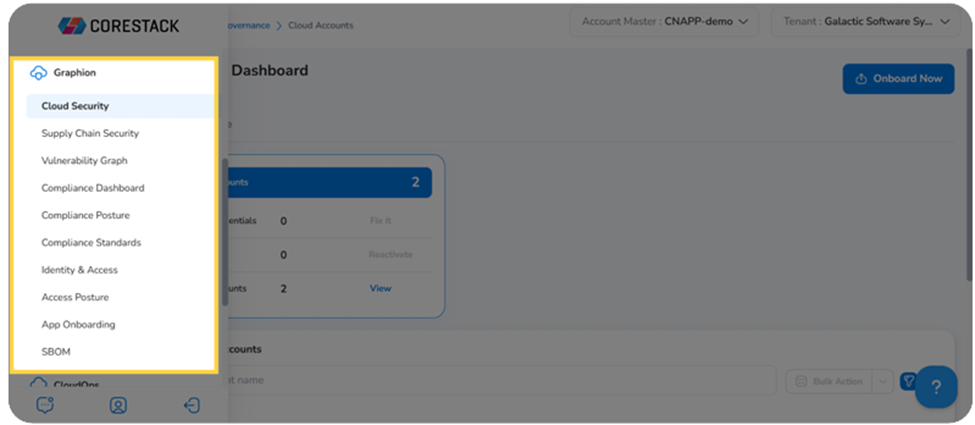
The Cloud Security Dashboard opens and displays all available widgets.
Scroll through the Infrastructure Dashboard to find the Infrastructure Resources and Issues – Flow widget. The widget displays a Sankey chart showing resource categories connected to issue types.
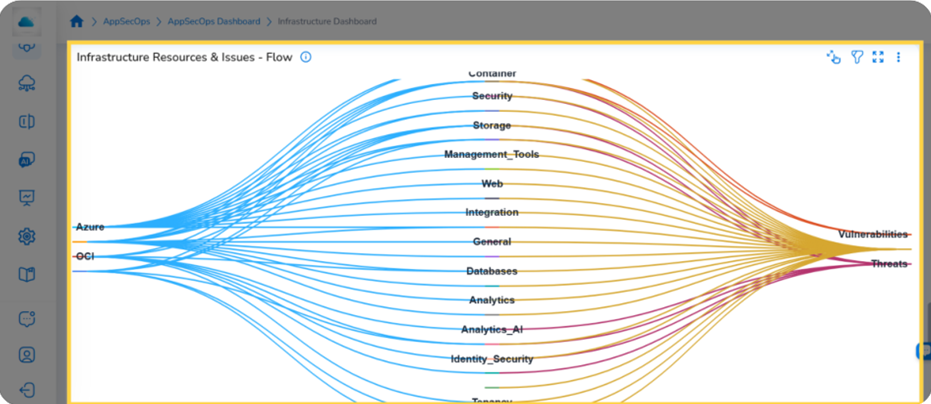
The Infrastructure Resources and Issues – Flow widget on the Cloud Security Dashboard
Step 2: Read the Sankey Chart
The chart is organized across three nodes — Cloud Provider, Resource Category, and Issue Type — each representing a dimension of your security landscape. Each band represents a flow path connecting a specific combination of these dimensions. Band colour identifies the issue type to which it belongs.
Sankey chart — resource categories connected to issue types by color-coded bands
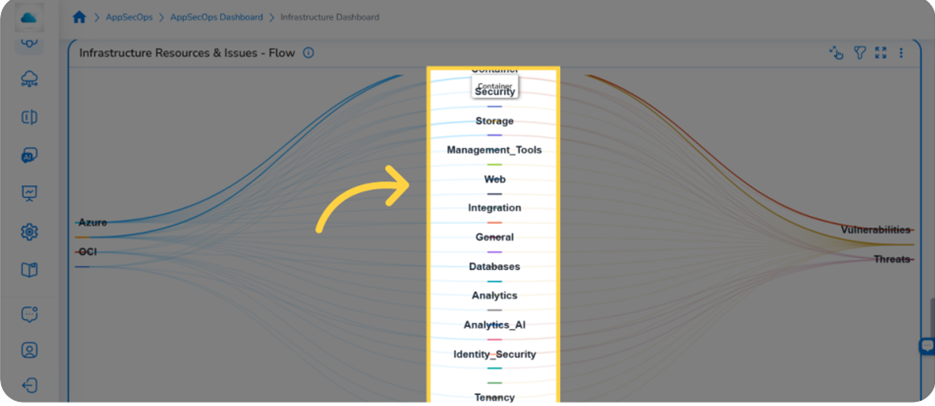
Step 3: Hover Over a Flow Band
To inspect a specific flow path, hover over any band or node. A tooltip appears identifying the resource category and the issue type (Vulnerability, Misconfiguration, or Threat) for that flow path.
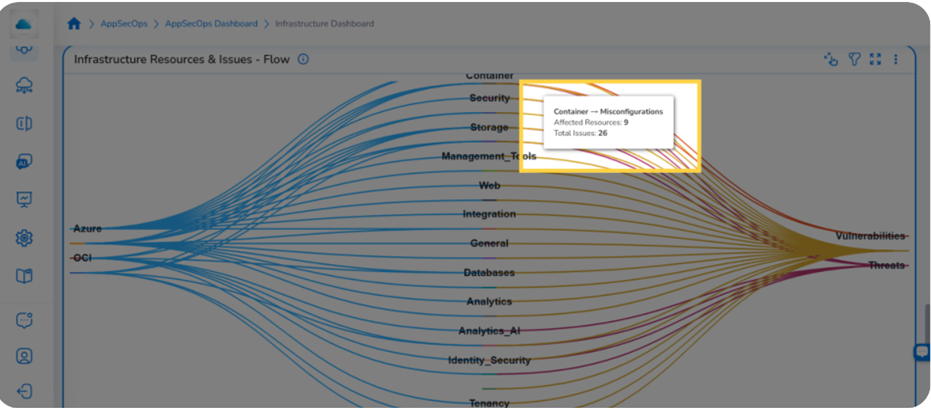
Hovering over a band shows the resource category and issue type for that path
Step 4: Click a Band to Drill Down
Click any band or node to navigate directly to the Infrastructure Issues Explorer, pre-filtered by the dimensions of the selected path. For example, clicking the band between Compute and Vulnerabilities opens the Explorer showing only vulnerability findings in Compute resources.
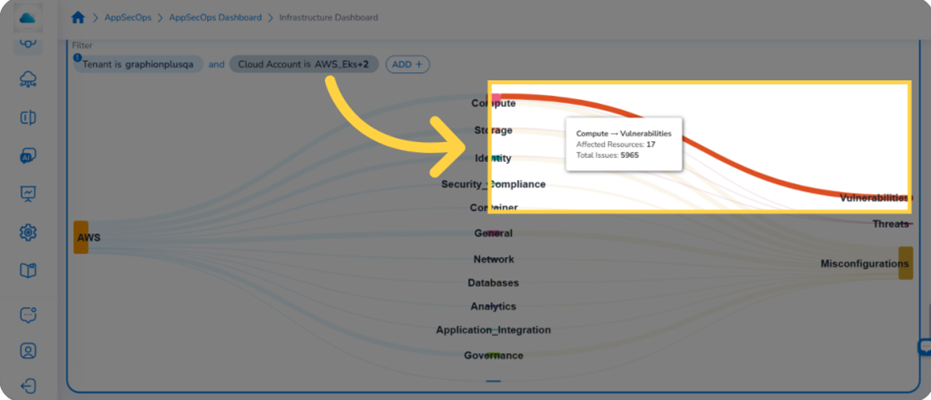
Clicking a band opens the Infrastructure Issues Explorer pre-filtered by that path
Note: The Explorer opens with filters automatically applied for the provider, resource category, and issue type of the path you clicked. You do not need to set filters manually.
Step 6: Review Findings in the Explorer
Use the Explorer table to review individual findings, assess severity, and plan remediation. The table includes the following columns: Policy Name, Policy Description, Severity, Recommendation, Resource Category, Resource Type, Resource, Resource ID, Resource Name, Cloud Provider, Cloud Account, Region / Location, Resource Group, Source, and Actions.
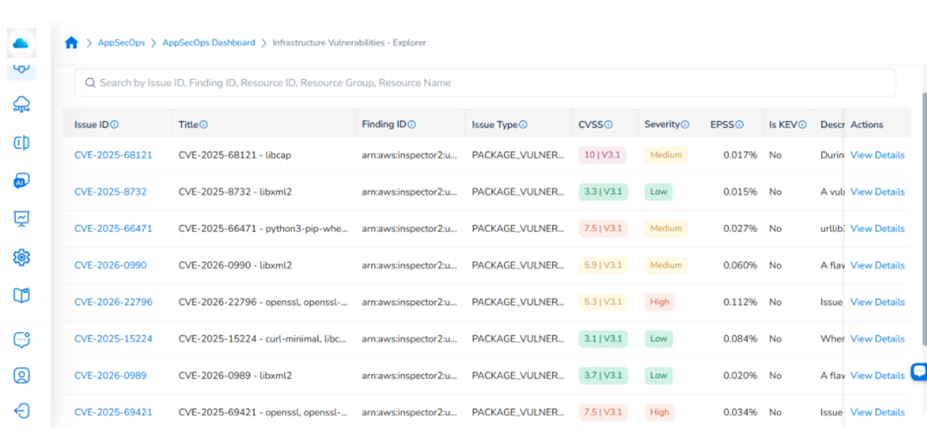
Explorer table showing all available columns for triage and remediation
Tip: Use the breadcrumb at the top of the Explorer to navigate back to the Infrastructure Dashboard when you have finished reviewing a flow path's findings.
Step 7: View Issue Details
In the Explorer table, locate the Actions column. Click View Details next to any finding to open the full policy detail page for that specific rule violation, including the policy description, severity, and recommended remediation steps.
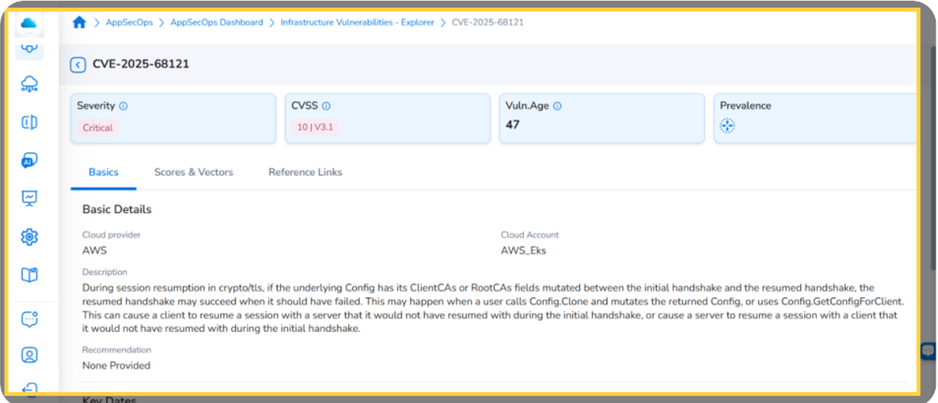
Clicking View Details opens the full policy and remediation detail_
For full guidance on navigating the explorers, reviewing finding details, and taking remediation actions, see the Infrastructure Explorers user guide
Widget Actions
Each widget in the Infrastructure Dashboard has a set of options accessible from the widget toolbar at the top right. These options allow users to filter, expand, and take further actions on any chart.
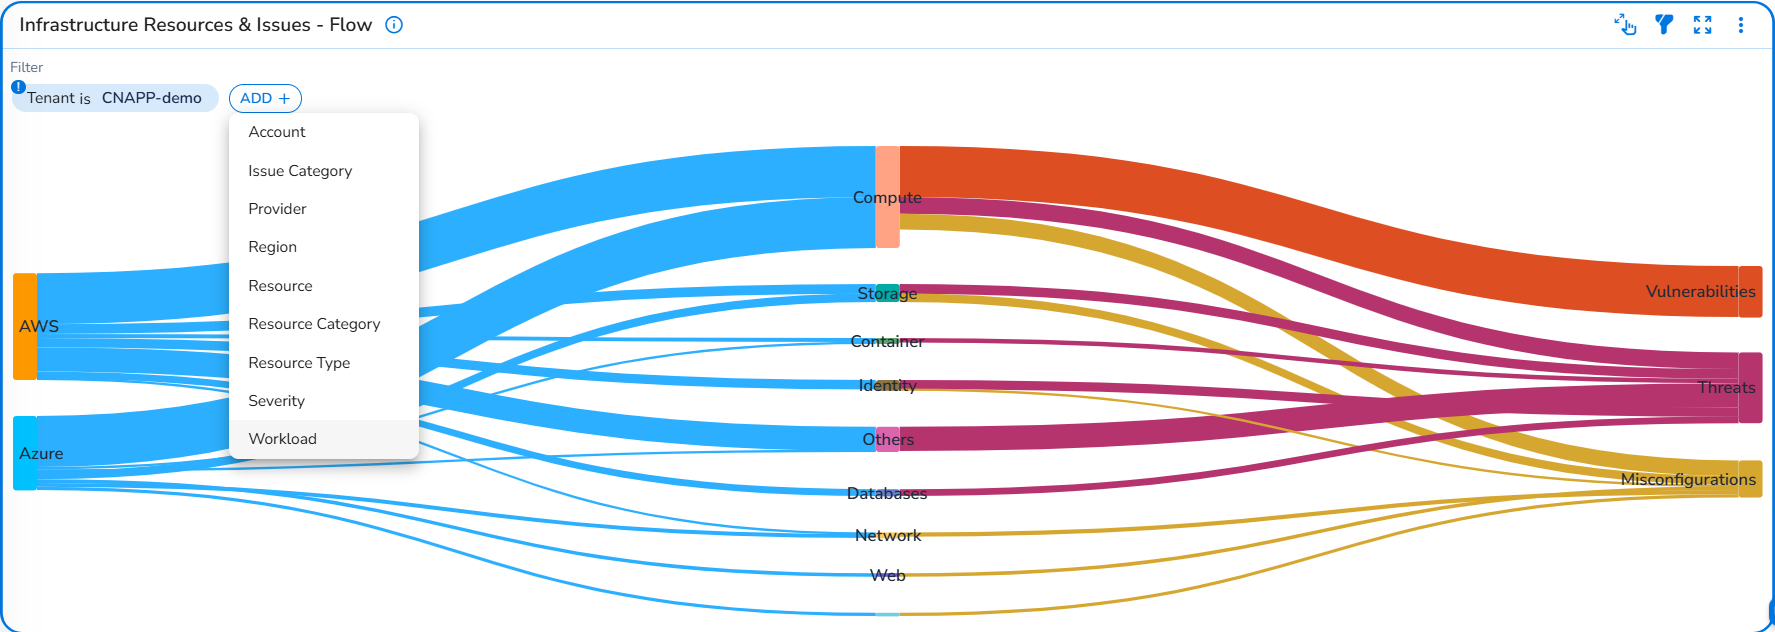
Filter
Click the Filter on in the widget toolbar to open or hide the filter panel. The filter panel shows any active filters and lets you add custom filters.
- To add a filter: Click ADD+, select the filter type from the dropdown, then select the values to filter by.
- To remove a filter: Click the filter chip to deselect it or clear it from the panel.
- To hide the filter panel: Click the Filter icon again.
Note: The Workload Filter is available as a widget-level filter on the Infrastructure Resources and Issues - Flow widget. Each workload in CoreStack corresponds to an onboarded cloud account and is created automatically — no manual setup is required. Applying a Workload filter scopes the Sankey chart to display only the flow paths — from cloud provider through resource categories to issue types — associated with the selected cloud account.
Use the Workload filter when you need to:
- Understand how security issues are distributed across resource categories and issue types for a specific cloud account
- Identify which resource categories (such as Compute, Identity, or Containers) are generating the most issues within a particular account
- Isolate a single account's flow paths before drilling into the Explorer to reduce noise from other accounts' findings
To apply the filter, click the Filter icon on the widget, select Workload from the filter attribute dropdown, choose the workload from the value list, and click Ok. The Sankey chart refreshes immediately to reflect only the flow paths associated with the selected workload. When you click a band to drill into the Explorer, the workload scope is reflected in the findings displayed.
Expand View
Click the Expand View icon in the widget toolbar to open the widget in full-screen mode. This is useful for reading dense charts with many data points. Click the icon again to return to the standard dashboard view.
Actions
Click the ellipsis icon in the widget toolbar to open the Actions menu. The following actions are available:
- Export config: Export the current widget configuration.
- Subscribe: Set up a subscription for automated delivery of this widget's data.
- Download as CSV: Download the chart data as a CSV file.
- Download as PNG: Save the current chart as a PNG image.
Frequently Asked Questions
What cloud providers are supported?
The widget supports AWS, Azure, GCP, and OCI.
Can I filter the chart by a specific provider or issue type?
Yes. Click the Filter icon on the widget and use ADD+ to add filters by Cloud Provider, Resource Category, Issue Type, or Fix Availability.
Why does the chart show no data?
The chart requires at least one onboarded and active cloud account with completed security scan data. See the Troubleshooting section below if the widget appears empty.
Troubleshooting
The widget shows no data
Cause: No cloud accounts are onboarded, or a security scan has not yet completed for the active accounts.
Solution:
- At least one cloud account (AWS, Azure, or OCI) must be onboarded and active on the platform.
- Confirm that a security scan has been run for the account. Scans may take several minutes to complete after onboarding.
- If accounts are active and scans have completed but no data appears, contact your CoreStack administrator.
Clicking a band does not open the Explorer
Cause: The widget may not have fully loaded, or a browser extension is interfering with click events on the chart.
Solution:
- Wait for the widget to fully load — a loading indicator may appear briefly.
- Refresh the browser page and navigate back to the Cloud Security Dashboard.
- If the issue continues, try disabling browser extensions and reloading the page.
The Explorer does not reflect the expected filters after clicking a band
Cause: The wrong band may have been clicked, or the click was not registered cleanly.
Solution:
- Return to the Cloud Security Dashboard and click the intended band again.
- Confirm the Explorer URL contains the expected filter parameters for provider, category, and issue type.
- If filters are still missing, clear existing Explorer filters and retry the drill-down from the Sankey chart.
The Cloud Security Dashboard is not visible under Graphion> Cloud Security
Cause: The Cloud Security Dashboard may not be configured for your tenant, or your role does not include access to it.
Solution:
- Confirm your role includes the necessary permissions in assigned in CoreStack under the appropriate bundles.
- Check with your CoreStack administrator that the Infrastructure Dashboard has been enabled for your tenant.
- If your role was recently updated, log out and log back in to refresh your permissions.
Updated 15 days ago