

Apply Filters
Filters for Analytics Reports
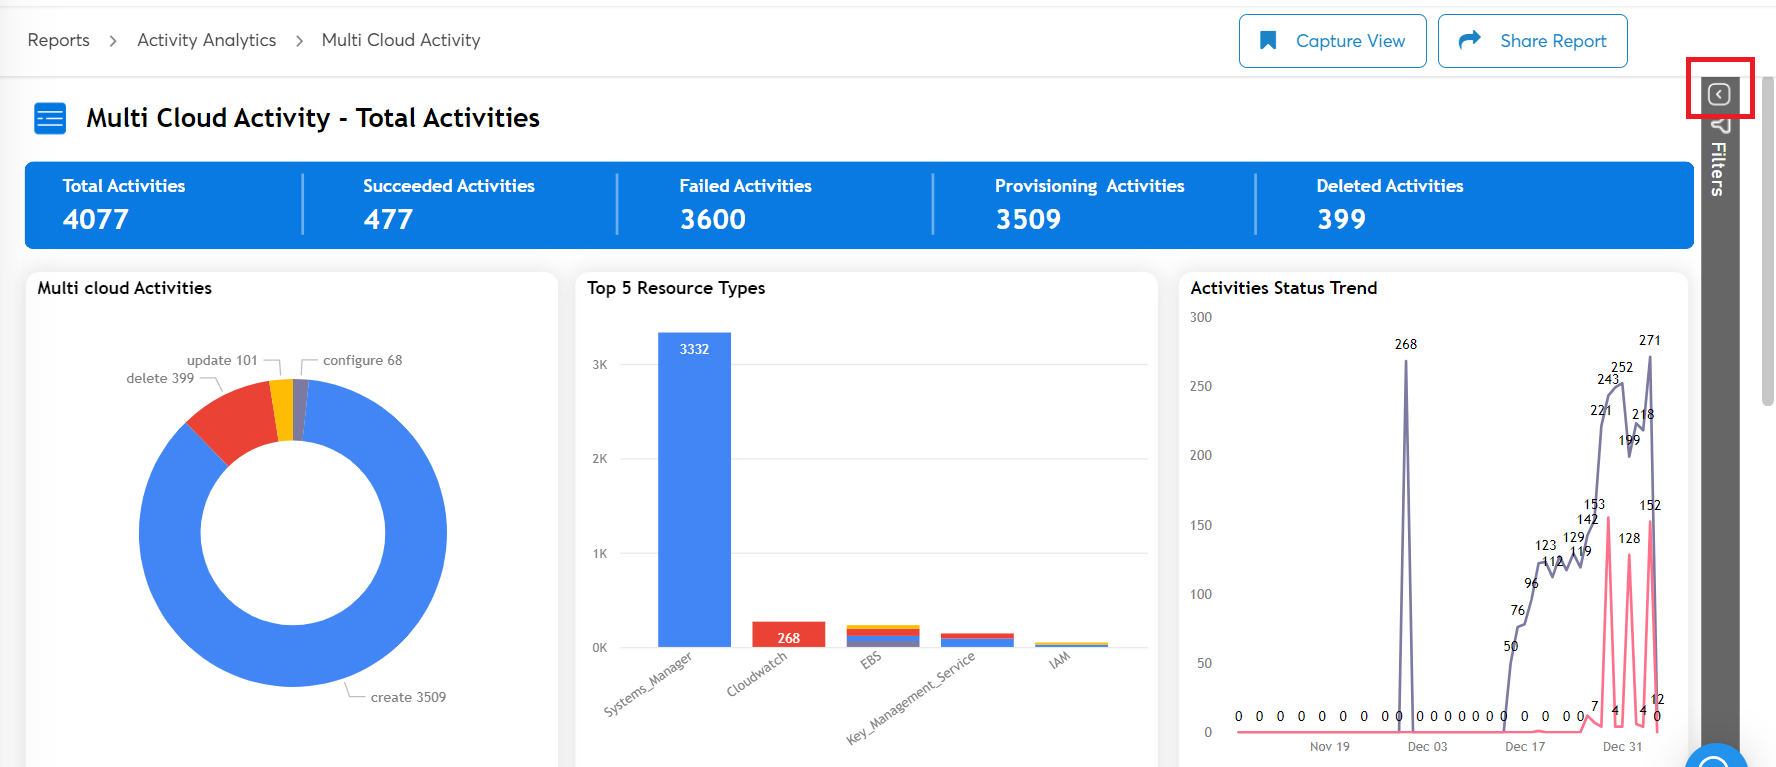
The analytics reports have the Filter pane that can be used to apply certain parameters to the existing charts/table to get a refined view of chart and tables.
Follow the steps shown below to apply filter to analytics report:
-
On the Reports dashboard, navigate to the analytics report for which you would like to view details.
-
On the extreme right side of the screen, click to expand the Filters pane.
-
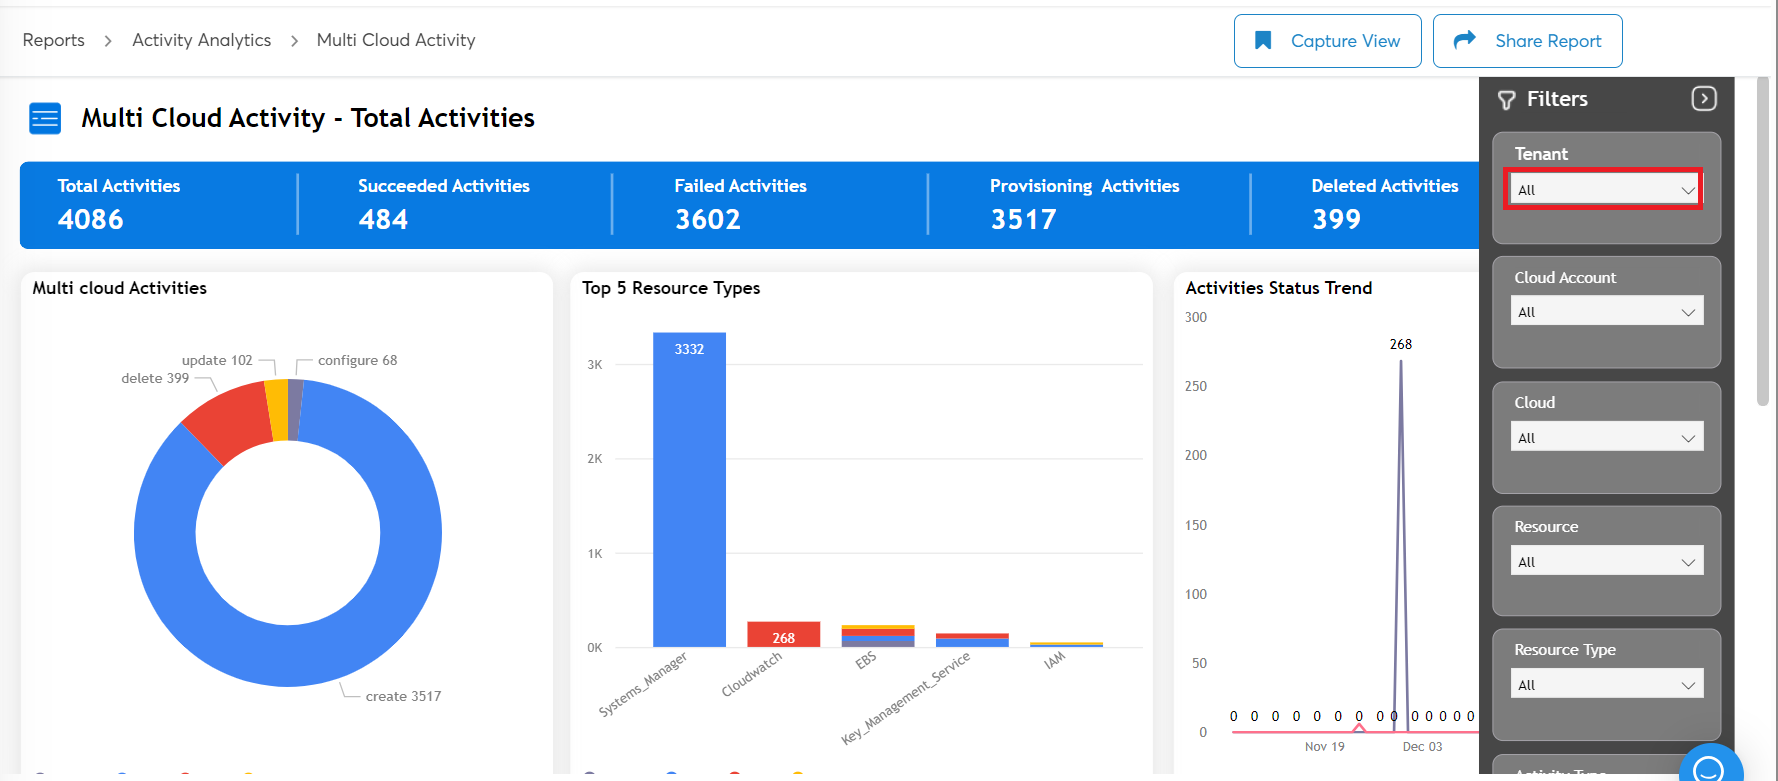
Select the required parameters from the available fields. For example, in the Tenant list, click Select All.
-
The charts and tables in the report are modified as per the applied filters and displayed.
-
Click Clear Filter to reset all the selected parameters.
As per the options applied in the filter, the data charts and tables appear on the screen. The options in the filter can be changed anytime to view specific data.
SSRS reports do not have filters, instead you can change or modify parameters to view specific details in reports.
Updated 8 months ago