

AWS (Amazon EKS) Cluster Onboarding
Onboard Amazon EKS clusters to CoreStack FinOps with the Kubernetes Agent
Feature Overview
Kubernetes Cluster Onboarding for AWS is an agent-based capability within CoreStack's FinOps module that connects your Amazon Elastic Kubernetes Service (EKS) cluster to CoreStack, enabling workload-level cost visibility and governance. It is most relevant when your organisation runs containerised workloads on Amazon EKS and needs accurate, workload-level cost breakdowns without manual data extraction.
This feature is most valuable to Cloud Administrators and FinOps Practitioners who need to bring EKS spend into the same governance framework as the rest of their AWS estate. It does not provide real-time cluster monitoring or infrastructure alerting — its purpose is cost ingestion and FinOps reporting within CoreStack.
How It Works
When you onboard an EKS cluster, a CoreStack Kubernetes Agent is deployed inside the cluster using a YAML file downloaded from the CoreStack platform. The agent connects to Prometheus — which must already be running in your environment — to retrieve node, pod, and container utilisation metrics. At regular intervals, the agent uploads this data to a storage location (either CoreStack's managed S3 bucket or your own), where CoreStack processes it into cost and governance insights visible in the FinOps Dashboard.
Note: The CoreStack Kubernetes Agent must be deployed inside your EKS cluster by the CoreStack Technical Support Team. Download the YAML file during onboarding and raise a support request to complete the deployment before proceeding to the final step.
Prerequisites
Before you begin, ensure the following are in place:
| Prerequisite | Requirement |
|---|---|
| Role | You have the Account Admin role or equivalent assigned in CoreStack, with access to the AWS account associated with the EKS cluster. |
| Amazon EKS cluster | A functioning EKS cluster is available and accessible. |
| AWS account onboarded | The AWS account associated with the cluster has already been onboarded to CoreStack. |
| Prometheus | Prometheus v2.x or higher is running in the cluster. Only one instance per cluster is required. The endpoint must be reachable from within the cluster. |
| kube-state-metrics | Version v2.9.0 or later (v2.10.x preferred) is deployed in the cluster. |
| cAdvisor | No separate installation required — bundled with the Kubelet on Kubernetes v1.20 or higher. |
| Network access | Outbound connectivity from the cluster to the S3 storage endpoint is enabled. The agent cluster and Prometheus endpoint are mutually whitelisted. |
| Storage decision | Decide whether to use Platform Managed Storage (CoreStack's shared S3 bucket) or User Specific Storage(your own S3 bucket). If using User Specific Storage, have credentials ready for your chosen authentication method. |
| Temporary disk space | The /tmp directory is writable and has sufficient free space. Logs are automatically purged above 500 MB. |
| Cluster details | Have the Cluster ID, Cluster Type, Cloud Provider (AWS), and Region available. |
| Cost weightage (optional) | Define CPU, Memory, and GPU weightage percentages — total must equal 100%. |
Onboarding an Amazon EKS Cluster
Navigate to Governance > Account Governance > Container Services.
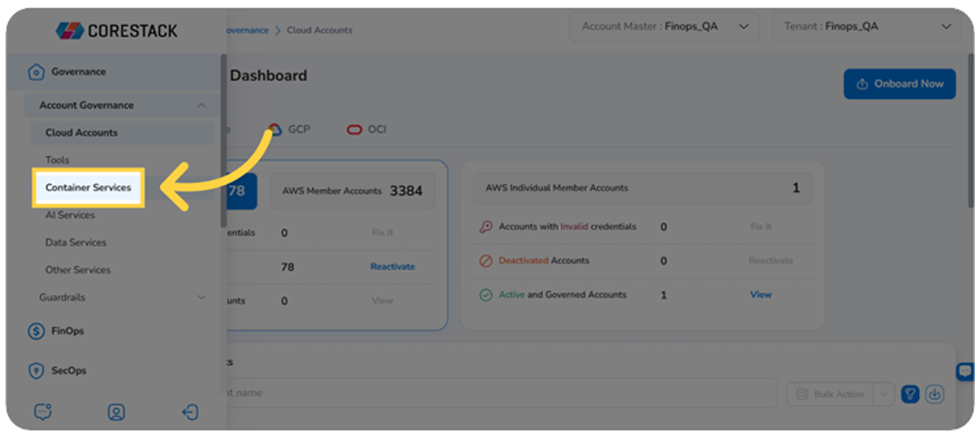
The Container Servicespage lists all clusters currently connected to CoreStack. Follow the steps below to onboard a new Amazon EKS cluster.
Step 1 — Initiate Cluster Onboarding
Click Onboard Cluster in the top-right corner of the Container Services page.
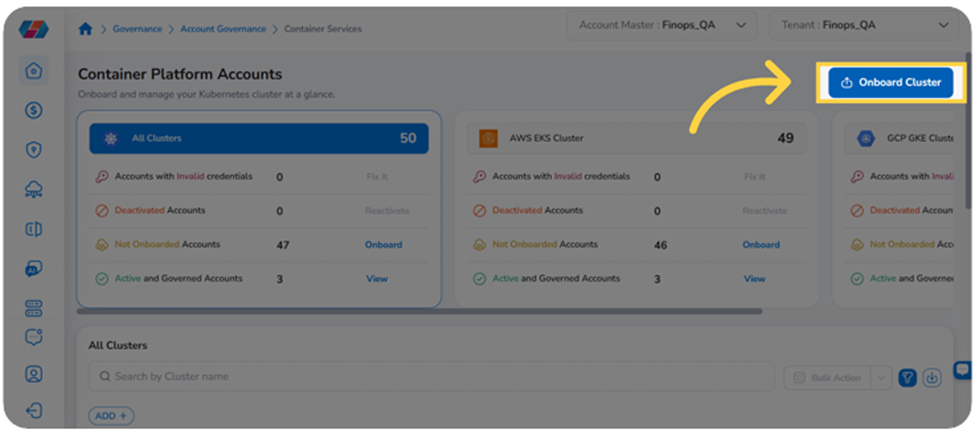
On the screen that appears, click Onboard to enter the onboarding wizard.
Tip: Alternatively, on the Container Platform Accounts page, locate a cluster with a pending onboarding status and click Onboard in the Onboarding Status column for that cluster.
Step 2 — Select Cloud Account and Cluster
In the Cloud Account drop-down list, select your AWS account and click Ok.
The Cluster ID and Cluster Type fields populate automatically. Review these to confirm the correct cluster is selected.
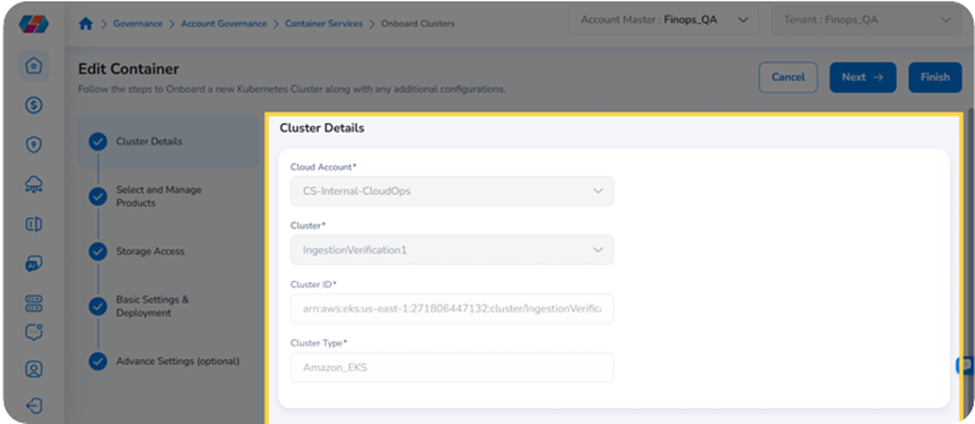
Click Next.
Step 3 — Activate FinOps
In the Select and Manage Products step, confirm that FinOps is listed under Active Product(s) and that the drop-down to the left of FinOps is set to Active.
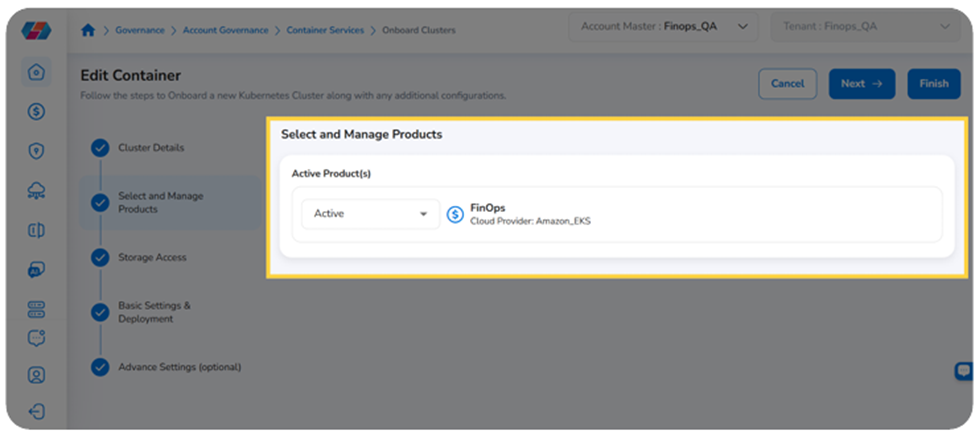
Click Next.
Step 4 — Configure Storage Access
In the Storage Access step, select a storage type from the Select Storage Access Type field. Choose one of the options below and follow the corresponding instructions.
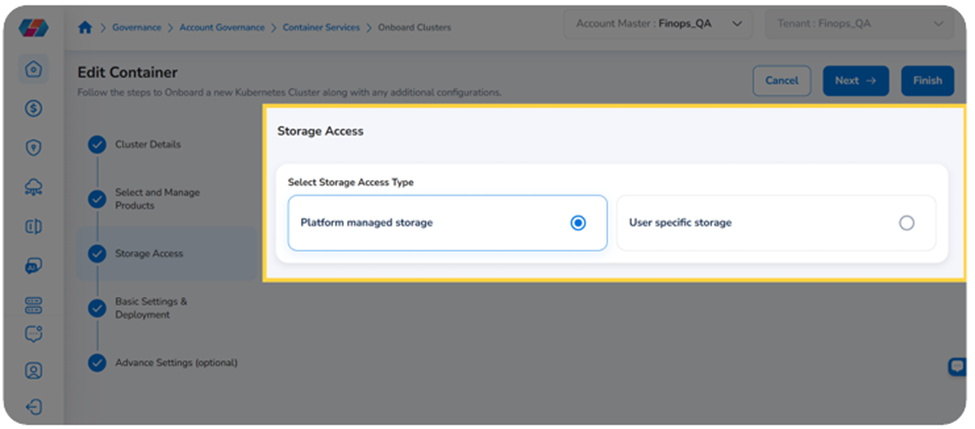
Option 1: Platform Managed Storage
Select Platform managed storage to store metrics in CoreStack's shared S3 bucket. CoreStack automatically handles storage provisioning, data retrieval, and processing — no AWS storage resources or credentials are required on your end. Choose this option if you do not have specific data residency requirements.
Click Next to proceed.
Option 2: User Specific Storage
Select User specific storage if you need metrics stored in your own S3 bucket — for example, to meet data residency or compliance requirements, or to retain direct access to the raw metrics data. You will need your AWS storage account details and appropriate permissions. Choose one of the authentication methods below.
Option 2a: Cloud Account Onboarded with Product
Enter the following details:
- Select Cloud Account: Enter the AWS account from the drop-down list.
- Select Storage Bucket: Select the S3 bucket where metrics will be stored.
- File Path: Enter the storage file path within the bucket.
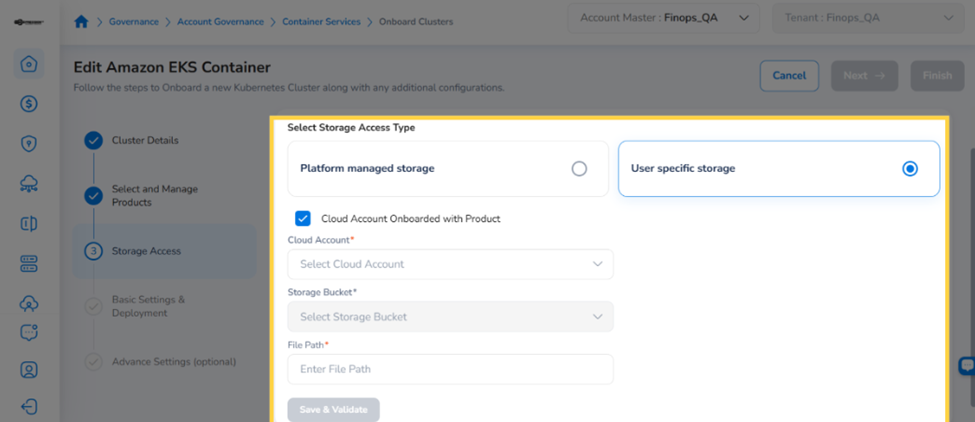
Click Save & Validate. A confirmation message indicates successful validation.
Click Next to proceed.
Option 2b: Assume Role
Use this option if the AWS account that owns the storage is not onboarded in CoreStack. In the Select Authentication Protocol field, select Assume Role.
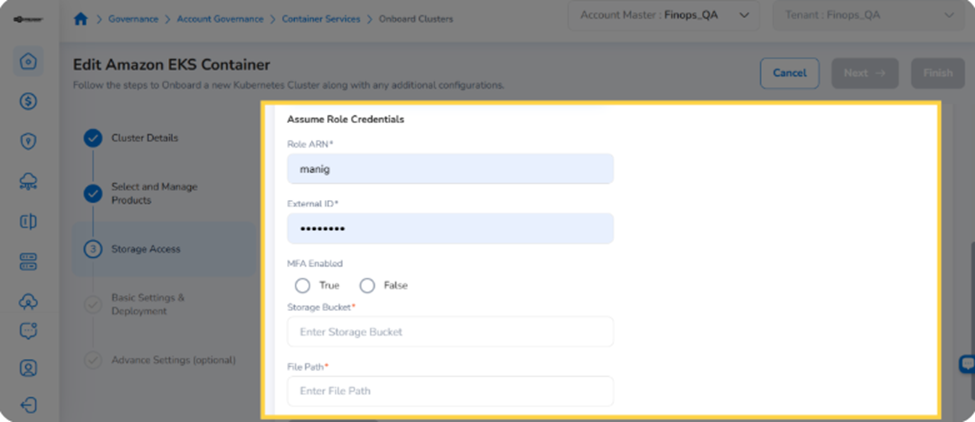
Enter the following details:
- Role ARN: Enter the ARN of the IAM role CoreStack will assume to access the S3 bucket.
- External ID: Enter the External ID associated with the role.
- MFA Enabled: Select True if MFA is required, or False if it is not.
- Select Storage Bucket: Select the S3 bucket where metrics will be stored.
- File Path: Enter the storage file path within the bucket.
Click Save & Validate. A confirmation message indicates successful validation. Click Next to proceed.
Option 2c: Access Key
Use this option if the AWS account that owns the storage is not onboarded in CoreStack. In the Select Authentication Protocol field, select Access Key.
Enter the following details:
- Access Key: Enter the AWS Access Key ID.
- Secret Key: Enter the AWS Secret Access Key.
- Select Storage Bucket: Select the S3 bucket where metrics will be stored.
- File Path: Enter the storage file path within the bucket.
Click Save & Validate. A confirmation message indicates successful validation. Click Next to proceed.
Step 5 — Configure Prometheus and Deploy the Agent
In the Prometheus Endpoint field, enter the URL of the Prometheus endpoint running in the cluster. The endpoint must be accessible from within the cluster by the K8s agent.
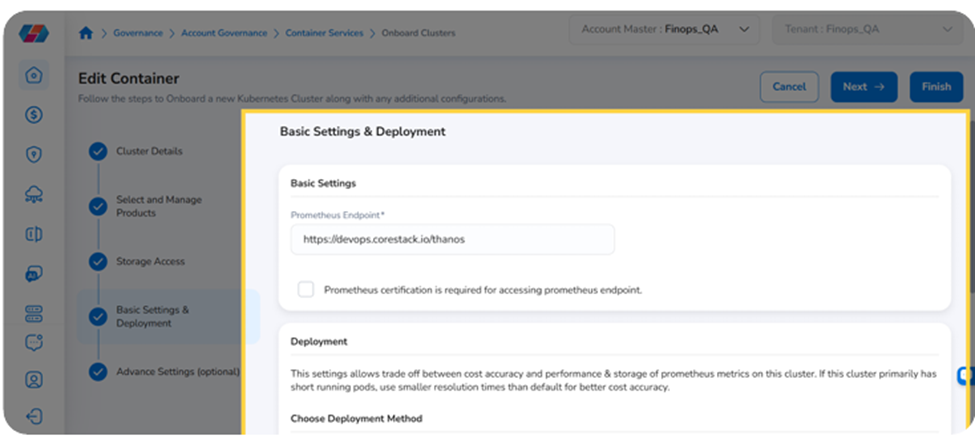
If Prometheus certification is required, select the Prometheus certification is required for accessing Prometheus endpoint checkbox and enter the certificate path in the Path of the Certificate field.
In the Install Kubernetes Agent section, click Download YAML to download the agent configuration file.
Note: Share the downloaded YAML file with the CoreStack Technical Support Team to complete the agent deployment inside your EKS cluster. The agent cannot be self-deployed.
After the agent has been deployed by the Technical Support Team, select the I have installed Kubernetes Agent checkbox.
Click Next.
Step 6 — Configure Advanced Settings
In the Advanced Settings step, enter the following:
- Cluster Description: Enter a description for the cluster.
- Cost Resolution Frequency: Select the frequency at which cost data is calculated from the drop-down list.
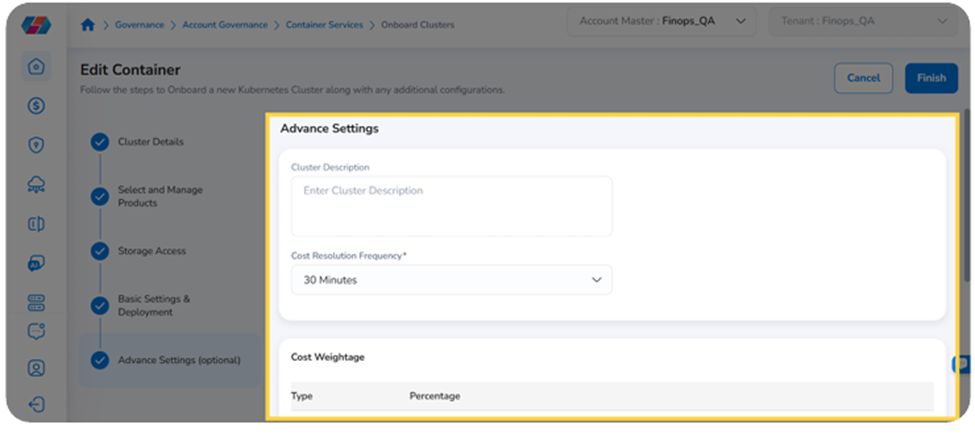
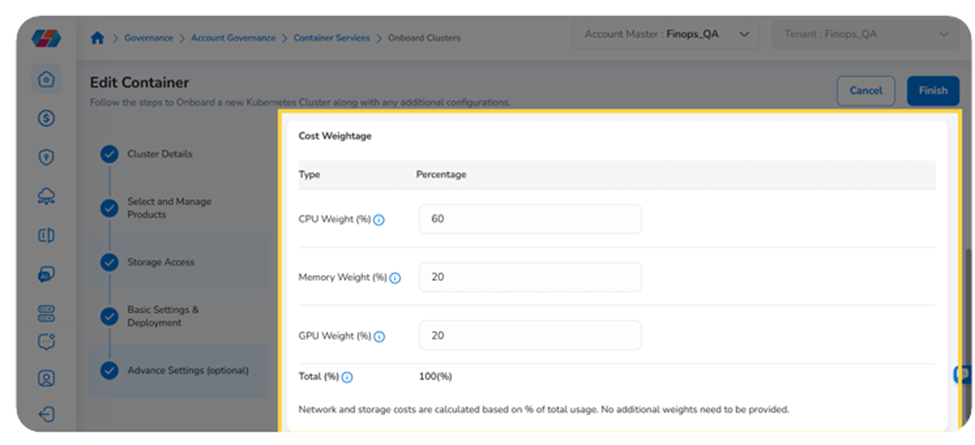
In the Cost Weightage section, enter percentage values for CPU Weight (%), Memory Weight (%), and GPU Weight (%). The total must equal 100%.
Step 7 — Complete Onboarding
Click Finish to complete the onboarding of your Amazon EKS cluster.
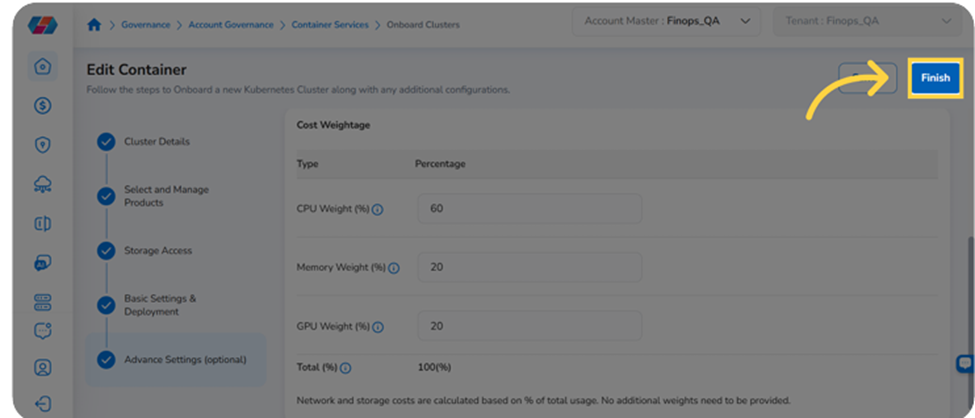
The newly onboarded cluster appears on the Container Platform Accountspage with its onboarding status updated.
Managing Onboarded EKS Clusters
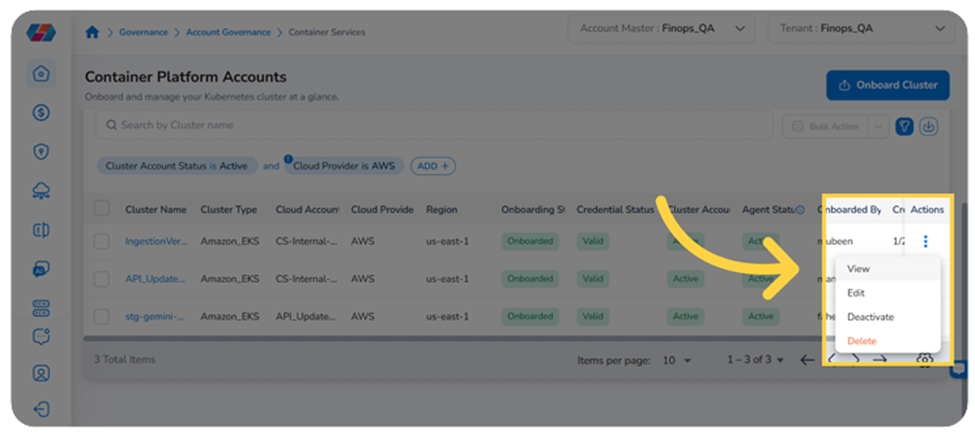
After onboarding, all clusters are listed on the Container Platform Accounts page. The summary cards at the top show counts for Active and Governed, Not Onboarded, Deactivated, and Invalid Credential accounts. To take action on a cluster, click the ⋯ (ellipsis) under the Actions column.
Edit Configuration
Click the ⋯ and select Edit Configuration. The edit wizard opens with the same steps as the onboarding wizard. The Cluster Details section is read-only and cannot be modified. All other sections are editable: you can update the FinOps product settings, reconfigure storage access and re-validate credentials, update the Prometheus endpoint, and adjust Advanced Settings. Click Next through each step and click Finish to save.
View Configuration
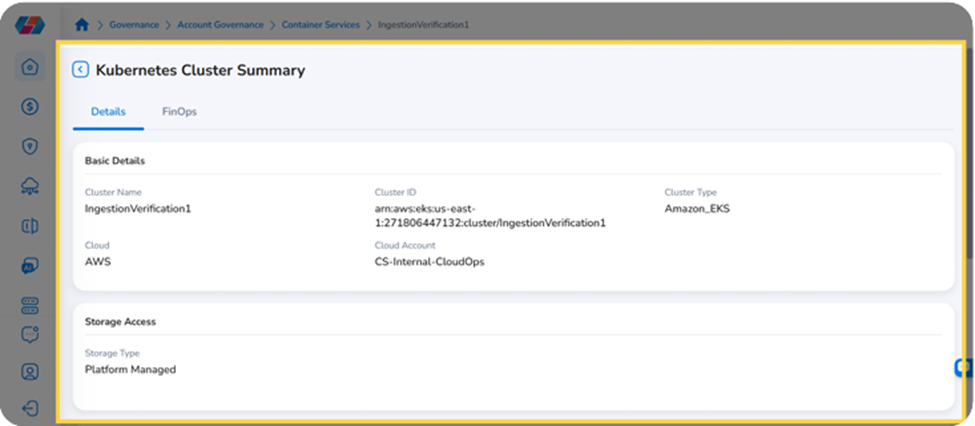
Click the ⋯ and select View Configuration. The Details tab opens, showing the cluster's Basic Details, Storage Access, Deployment, and Advanced Settings. Select the FinOps tab to review cost processing details.
Deactivate
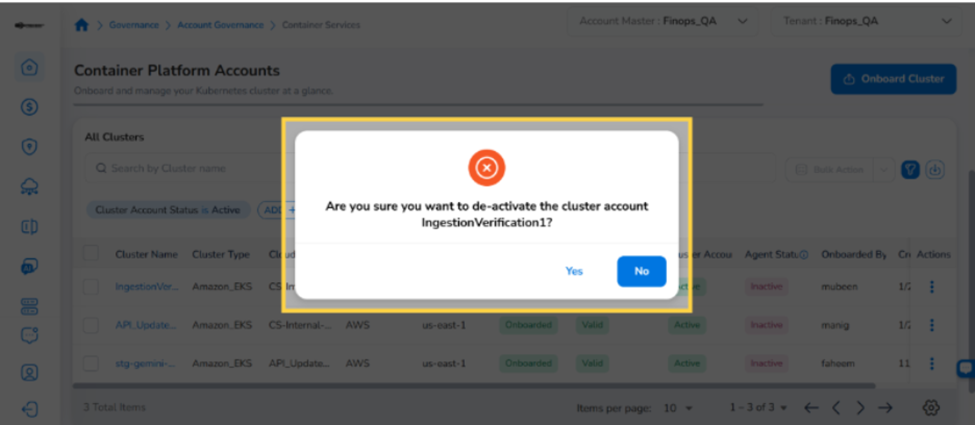
Click the ⋯ and select Deactivate. In the confirmation dialog, click Yes to suspend the cluster without deleting it.
Delete
Click the ⋯ and select Delete. In the confirmation dialog, click Yes to permanently remove the cluster from CoreStack.
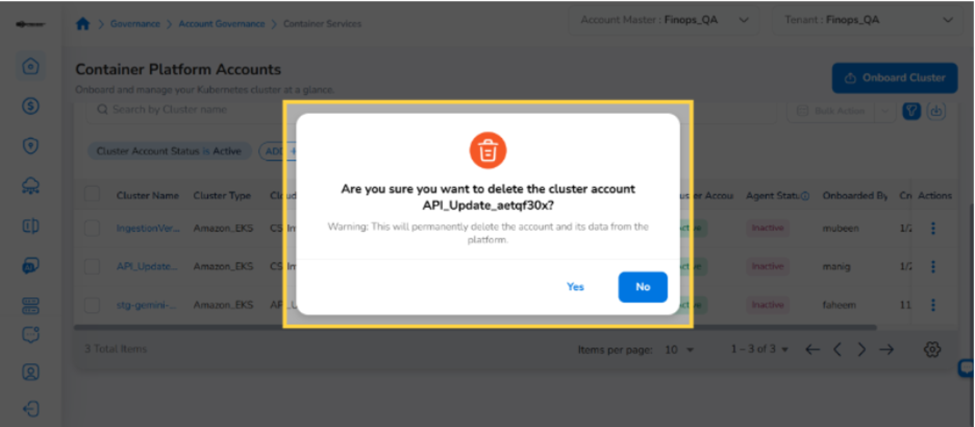
Warning Deleting a cluster removes it and all associated configuration from CoreStack. This action cannot be undone.
Frequently Asked Questions
Q: Do I need a separate Prometheus instance for each EKS cluster?
No. Only one Prometheus instance per cluster is required. A single Prometheus deployment that collects metrics across all nodes and pods in the cluster is sufficient for the CoreStack agent to function.
Q: Which storage authentication method is recommended for AWS?
Assume Role is recommended over Access Key. It uses temporary, scoped IAM credentials and avoids the risk of long-lived static key exposure. Use Access Key only if your environment does not support IAM role assumption.
Q: Can I change the storage type or authentication method after onboarding?
Yes. Click the ⋯ under Actions for the cluster and select Edit Configuration. Navigate to the Storage Access step, update your settings, and click Save & Validate before proceeding to Finish.
Q: The Cluster drop-down is empty — why can't I see my EKS cluster?
The AWS account associated with the cluster must be onboarded to CoreStack before the cluster appears in the drop-down. Verify the account is onboarded and that you have selected the correct account in the Cloud Account drop-down.
Q: How long does it take for cost data to appear in the FinOps Dashboard?
Cost data appears after the first successful ingestion cycle. The frequency depends on the Cost Resolution Frequency set in Advanced Settings. The initial data load may take longer than subsequent cycles.
Q: Can I onboard multiple EKS clusters from the same AWS account?
Yes. Each cluster is onboarded independently and receives its own agent deployment and service account. Repeat the onboarding process for each cluster.
Troubleshooting
No cost data appears in the FinOps Dashboard after onboarding
Cause: The Kubernetes Agent has not completed a successful ingestion cycle. Most commonly caused by network connectivity issues between the agent and Prometheus, or between the agent and S3.
Solution:
- Confirm the Prometheus endpoint entered during onboarding is correct and reachable from within the cluster.
- Confirm outbound connectivity from the cluster to the S3 endpoint is not blocked by a security group, NACLs, or VPC endpoint policy.
- Verify the
/tmpdirectory is writable and has available disk space. - Check the Agent Status column on the Container Platform Accounts page. If not Active, raise a request with the CoreStack Technical Support Team to inspect agent logs.
Note: If the issue persists, contact CoreStack support with: Cluster ID, AWS Region, Agent Status, and any error messages from the agent logs in
/tmp.
Storage validation fails with User Specific Storage
Cause: Credentials do not have sufficient permissions to access the specified S3 bucket, or the bucket details are incorrect.
Solution:
- Confirm the S3 bucket exists in the correct AWS region and is accessible.
- For Assume Role: verify the Role ARN is correct and the IAM trust policy permits CoreStack to assume the role. Confirm the External ID matches.
- For Access Key: verify the Access Key and Secret Key are active and the IAM policy grants
s3:GetObject,s3:PutObject, ands3:ListBucketon the target bucket. - Confirm the File Path format is correct (e.g.,
metrics/cluster-name/). - Click Save & Validate again after correcting the details.
Note: If validation continues to fail, contact CoreStack support with: Cluster ID, storage type, authentication method, and the exact error message displayed.
Agent Status shows as inactive after deployment
Cause: The agent cannot communicate with the CoreStack management endpoint or the Prometheus endpoint, or the YAML configuration values are incorrect.
Solution:
- Confirm the agent YAML was downloaded after completing the onboarding wizard — YAML files generated before saving may contain outdated values.
- Verify the Prometheus endpoint is reachable from the namespace where the agent is deployed.
- Check that outbound connectivity from the agent pod to the CoreStack management endpoint is not blocked.
- Contact the CoreStack Technical Support Team with the Cluster ID, agent pod logs, and a description of the network configuration.
Updated 5 months ago