

Budget Cost Trend Forecast
This guide explains how to use the Budget Cost Trend Forecast widget in CoreStack FinOps to monitor actual cloud spend against budgets and view forward-looking cost projections.
Feature Overview
The Budget Cost Trend Forecast widget is a unified visualization within CoreStack's FinOps module that consolidates actual cloud spend, allocated budget, and forecasted spend into a single monthly bar/line chart. It enables users to compare performance against budget, track spending trends, and anticipate future costs — all within the context of a specific, user-selected budget.
The widget is most relevant when finance and engineering teams need to detect cost over-runs early, validate spend against planned budgets, or project month-end spend before billing closes. It enforces alignment with the selected budget's time scope so that the data displayed is always contextually consistent.
This feature is most valuable to FinOps Practitioners, Admins, and end users who are responsible for cloud cost governance and financial planning. It is not a budget management tool and does not allow creating or editing budgets. Budget configuration is handled separately in FinOps > Budget.
Note: A budget must exist in CoreStack before you can use this widget. If no budgets have been created, the Budget drop-down will be empty and the widget will display no data.
How It Works
When a dashboard containing the Budget Cost Trend Forecast widget is opened, the widget fetches cost data aligned to the currently selected budget's time scope. The user selects a budget from the Budget drop-down, which dynamically updates the chart to show actual billed cost, the monthly allocated budget amount, and a forecasted end-of-period estimate — side-by-side for each month within that budget period. If the user selects a time range that extends beyond the budget's duration, the system restricts displayed data to the budget period and shows a validation message. Data is always visualized at monthly granularity, making it easy to compare performance across periods.
Prerequisites
Before you begin, ensure the following:
- Role: You have a FinOps Practitioner, Admin, or end user role assigned in CoreStack.
- Budgets: At least one active budget has been created in FinOps > Budget.
- Access: You can navigate to FinOps > Dashboard in the left navigation panel in CoreStack.
- Dashboard: A dashboard containing the Budget Cost Trend Forecast widget has been set up. If none exists, ask your Admin to add the widget to a dashboard.
Using the Budget Cost Trend Forecast Widget
Navigate to FinOps > Dashboard using the left navigation panel. Select the dashboard that contains the Budget Cost Trend Forecast widget from the dashboard drop-down at the top of the page.
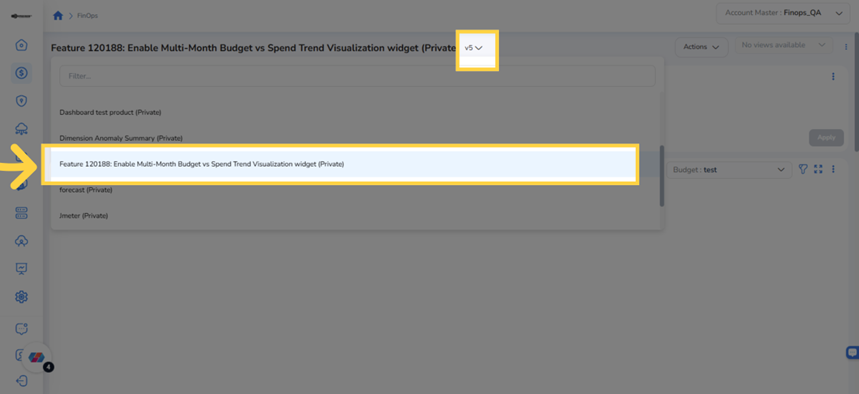
Selecting the dashboard containing the Budget Cost Trend Forecast widget from the dashboard drop-down.
Step 1: View the Widget
The Budget Cost Trend Forecast widget loads and displays budgeted cost and actual spend as bar charts for each month. A Budget drop-down appears in the top-right of the widget header. Review the widget to understand the current month's spending relative to budget.
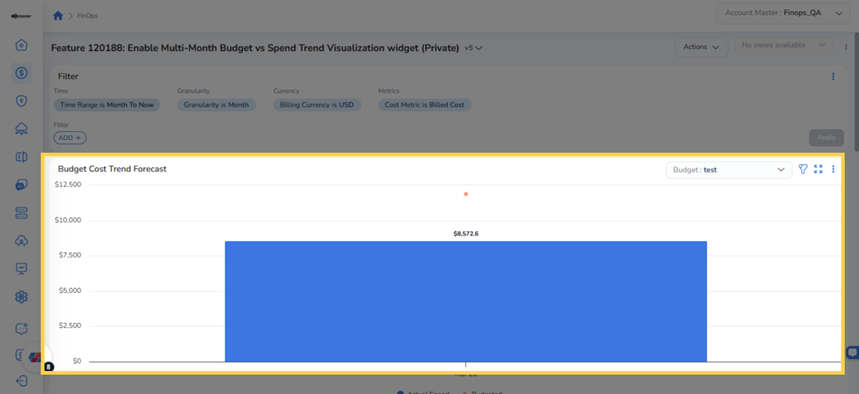
The Budget Cost Trend Forecast widget displaying monthly budgeted cost and actual spend as a bar chart.
Step 2: Select a Budget
In the Budget drop-down on the right side of the widget header, click and select the budget you want to analyze. The widget dynamically refreshes to show data aligned to the selected budget's time scope. Only active budgets are available by default.
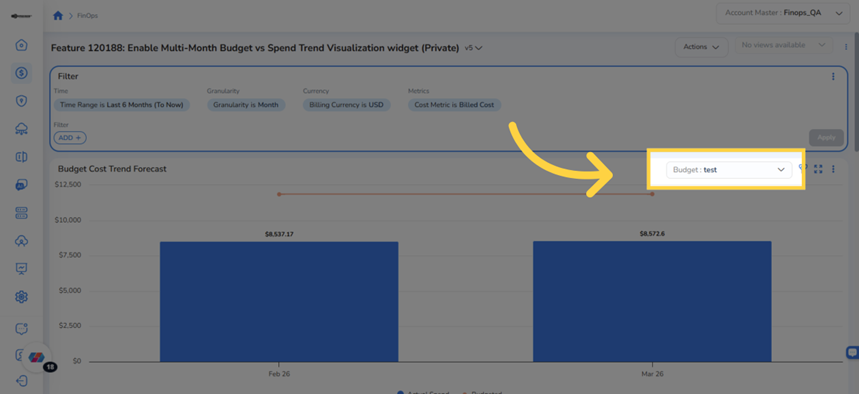
The Budget drop-down in the widget header — click to select an active budget and refresh the chart
Note: Changing the budget selection refreshes all data in the widget. The time scope displayed will match the start and end dates of the selected budget, not the global time range filter.
Step 3: View Cost Details for a Month
Hover the mouse pointer over any bar in the chart to see a tooltip displaying the Budgeted amount, Actual Spend, and the variance (under budget or over budget) for that specific month. Each metric is color-coded for quick identification.
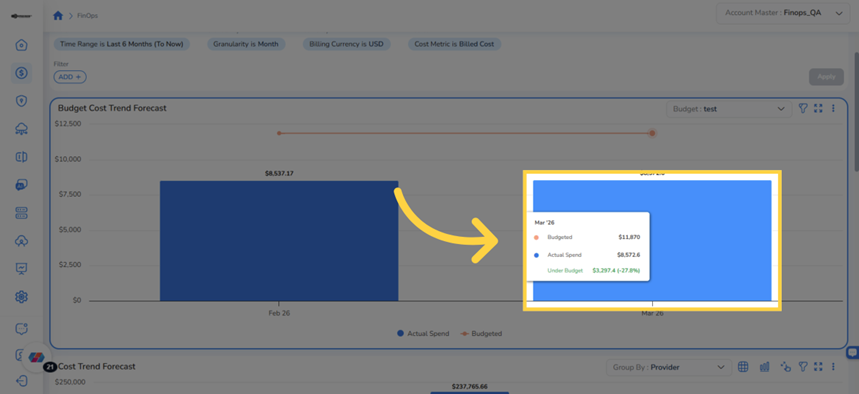
Hover tooltip showing Budgeted, Actual Spend, and Under Budget variance for a selected month
Step 4: Identify the Budget Threshold
Observe the orange horizontal line running across the chart. This line represents the budget threshold — the maximum allocated spending level for the selected budget period. When actual spend approaches or exceeds this line, it signals a potential overrun.
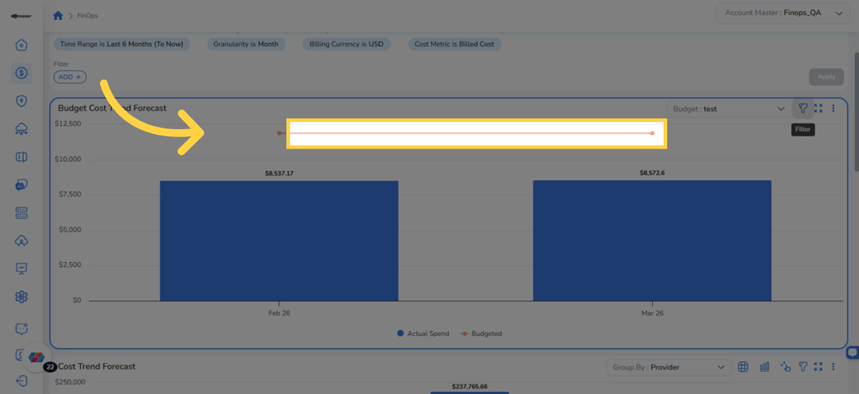
The orange horizontal line represents the budget threshold — spend approaching this line indicates a potential overrun.
Widget Actions
Widget Filter Panel
Click the Filter icon (funnel icon) on the right side of the widget header to expand the widget's local filter panel. The panel appears above the chart showing available filters including Time Range, Granularity, Forecast, Currency, and Metrics. Click the Filter icon again to collapse the panel.
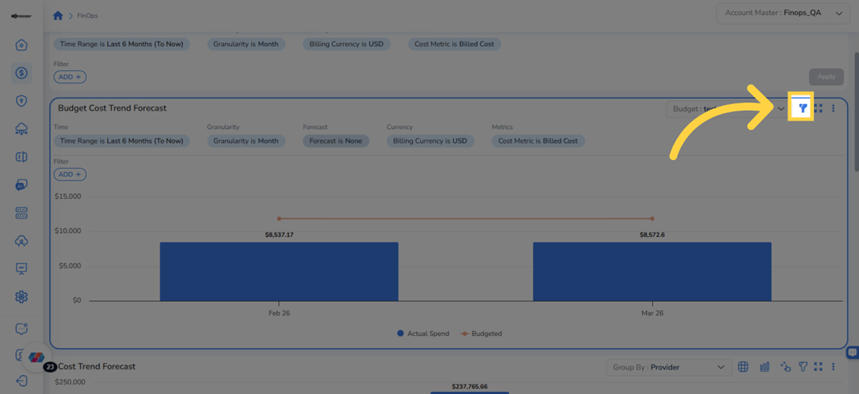
Widget filter panel showing available local filters including Time Range, Granularity, Forecast, Currency, and Metrics.
To narrow the widget data by a specific dimension (such as cloud provider, region, or service), click ADD+ in the Filter panel to open the custom filter selector. Choose a filtering dimension from the list (for example, Provider). Then select the values to include (for example, GCP) and click OK. The chart refreshes to show data matching the selected filter values.
Tip: You can add multiple custom filters to narrow down costs by provider, region, service, and more. Each filter compounds with the others.
Note: When using Accumulated Spend mode, the Granularity filter controls the resolution of spend data displayed. Select Monthly for daily breakdowns, Quarterly for weekly breakdowns, or Yearly for month-wise breakdowns.
Expand to Full-Screen View
Click the expand icon (the four-corner arrows icon) in the top-right of the widget to enlarge the Budget Cost Trend Forecast widget to full-screen view. This provides a larger canvas for analyzing data in detail. Click the same icon again to return to the normal dashboard view.
Use the Ellipsis Menu Options
Click the ellipsis icon in the widget header to access additional options for the widget. The available actions are:
- Accumulated Spend — Switches the chart to a cumulative area view, showing running totals for Actual Spend, Budgeted, and Forecast Spend over the period. The chart’s Y-axis granularity adjusts based on the selected time range: daily values when Monthly granularity is selected, weekly values when Quarterly granularity is selected, and month-wise values when Yearly granularity is selected. Budget reference is maintained at the monthly budget level regardless of the selected granularity.
- Distributed Spend — Returns the chart to the default monthly bar/line view showing spend distributed per month.
- View As > Datatable — Displays widget data in a table with columns for Month, Actual/Forecast Spend, Budget, and Variance %.
- View As > Stacked Column — Changes the chart to a stacked column visualization.
- Download as PNG — Saves the current chart as a PNG image file.
- Download as CSV — Exports the underlying data as a CSV file for further analysis.
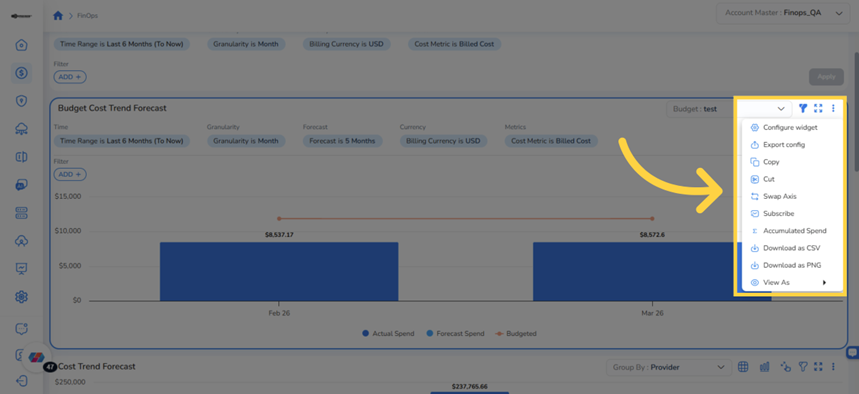
The ellipsis (…) menu — access spend modes, chart formats, and download options from a single location.
Frequently Asked Questions
Q: The Budget drop-down is empty. What should I do?
No active budgets exist in your CoreStack account. Ask your Admin to create a budget in FinOps > Budget. The widget only shows active budgets by default. Once a budget is created and active, it will appear in the drop-down.
Q: I cannot see the Budget Cost Trend & Forecast widget. What should I do?
The widget may not be added to your dashboard yet, or you may not have the required permissions to view it. Contact your Admin to verify your access and ensure the widget has been added to your dashboard.
Q: Why does the chart not show forecast data?
Forecast data appears only for current and future months. If the selected time range includes only past months, no forecast bars will appear. Open the Filter panel and set the Forecast drop-down to a value (for example, 3 Months) to project spending forward from the current month.
Q: My selected time range exceeds the budget period. What data is shown?
The widget automatically restricts data to the selected budget's time scope. If your global time range extends beyond the budget's start or end date, only months within the budget period are visualized. A validation message may appear to inform you of this restriction.
Q: Can I add this widget to a different dashboard?
Yes. Ask your Admin to add the Budget Cost Trend Forecast widget to any dashboard via the dashboard widget library. Once added, it behaves identically to any other dashboard placement.
Q: What does the Variance % column in Datatable view represent?
Variance % shows the percentage difference between actual (or forecasted) spend and the budgeted amount for that month. A negative variance indicates spend is under budget; a positive variance indicates overspend relative to the budget allocation.
Q: Why does the Accumulated Spend chart show different granularity when I change the Granularity filter?
The Accumulated Spend chart dynamically adjusts its Y-axis granularity based on the Granularity filter selected in the widget filter panel. When Monthly is selected, the chart displays daily spend values for more granular visibility. When Quarterly is selected, it shows weekly spend values. When Yearly is selected, it shows month-wise spend values with the budget reference maintained at the monthly level. This enables more accurate budget-to-actual tracking at the resolution appropriate for your analysis period.
Troubleshooting
Widget shows no data after selecting a budget
Cause: The selected budget may have no associated cost data for its time period, or the global time range filter does not overlap with the budget period.
Solution:
- Verify the budget's start and end date in FinOps > Budget.
- Check that the global Time Range filter overlaps with the budget period. Adjust it if needed.
- Confirm that cloud accounts are onboarded and billing data is available for the relevant time period.
If the issue persists, contact CoreStack support with the budget name, selected time range, and a screenshot of the widget state.
Forecast data is not appearing on the chart.
Cause: The Forecast filter in the widget filter panel is set to None, or the selected time range ends in the past.
Solution:
- Click the Filter icon to open the widget filter panel.
- In the Forecast drop-down, select a value (for example, 3 Months).
- Ensure the global Time Range filter extends into the current or a future month.
- Click Apply. The forecast bars should appear for upcoming months.
The Apply button is grayed out after changing the time range.
Cause: The date selection was not confirmed by clicking OK in the date picker before clicking Apply.
Solution:
- In the Time Range filter, open the date picker and select your dates.
- Click OK inside the date picker to confirm the selection.
- Click Apply in the filter bar. The widget will refresh with the new time range.
Related Resources
Creating and Managing Dashboards: Step-by-step guidance on creating dashboards and adding widgets.
Updated 21 days ago