

Infrastructure Resources - Inventory Overview
This user guide provides step-by-step instructions to explore cloud resource vulnerabilities using the Infrastructure Resources: Inventory Overview in CoreStack Graphion.
Feature Overview
The Infrastructure Resources - Inventory Overview chart is an interactive treemap within CoreStack's Graphion module that displays cloud resource inventory organized by category, resource type, and security issues — including vulnerabilities, misconfigurations, and threats. It is most relevant when users need to understand the distribution and magnitude of security issues across their cloud estate, prioritize investigation by resource type, or navigate directly to affected resources for remediation.
This feature is most valuable to Security Analysts conducting security reviews and Cloud Infrastructure Engineers assessing resource exposure. It is not a real-time alerting tool and does not perform automated remediation — it provides a visual entry point into security issues captured during scheduled scans.
Note: The Infrastructure Resources - Inventory Overview widget is only visible if your organization has the appropriate product bundle and you have been assigned the appropriate roles and permissions. If the widget does not appear on the Cloud Security Dashboard, contact your Tenant Admin to confirm bundle activation and role assignment.
How It Works
CoreStack scans connected cloud accounts on a scheduled basis and records security issues — vulnerabilities, misconfigurations, and threats — against each discovered resource. The Infrastructure Resources: Inventory Overview chart surfaces these issues as a series of progressively focused treemap views, starting from resource categories and narrowing down to specific issue types.
Each tile in the treemap is sized proportionally to the number of resources it represents, making it easy to identify where the highest concentration of security issues exists. Selecting a tile at any level narrows the view to the next level of detail, culminating in the Infrastructure Misconfigurations – Explorer (or the relevant explorer for the selected issue type), where individual security issues can be reviewed and investigated in depth.
Prerequisites
Before you begin, ensure the following:
- Roles and Permissions: You have the necessary roles and permissions assigned in assigned in CoreStack under the appropriate bundles.
- Cloud Accounts: At least one cloud account (AWS, Azure, GCP, or OCI) has been onboarded and scanned in CoreStack. Security issues appear only after at least one completed scan.
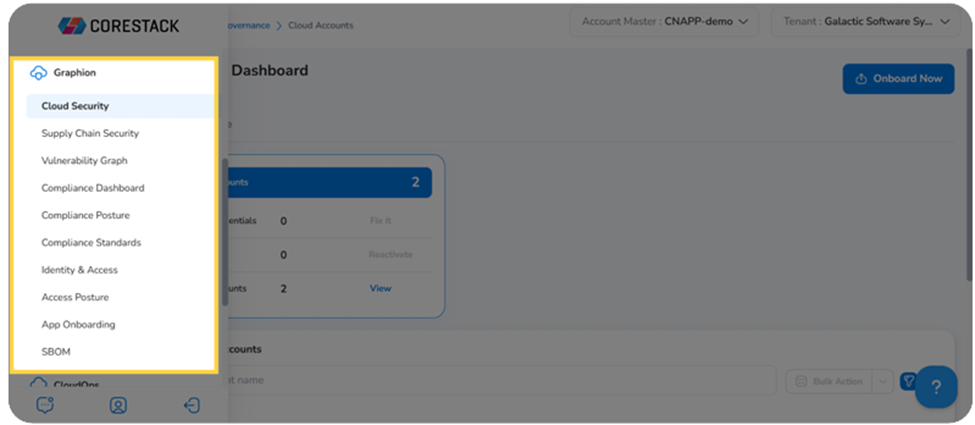
- Access: You can navigate to Graphion > Cloud Security > Cloud Security Dashboard using the CoreStack left navigation sidebar.
Using the Infrastructure Resources: Inventory Overview Chart
Step 1: Access the Cloud Security Dashboard
Navigate to Graphion > Cloud Security using the left navigation sidebar. The Cloud Security Dashboard loads.
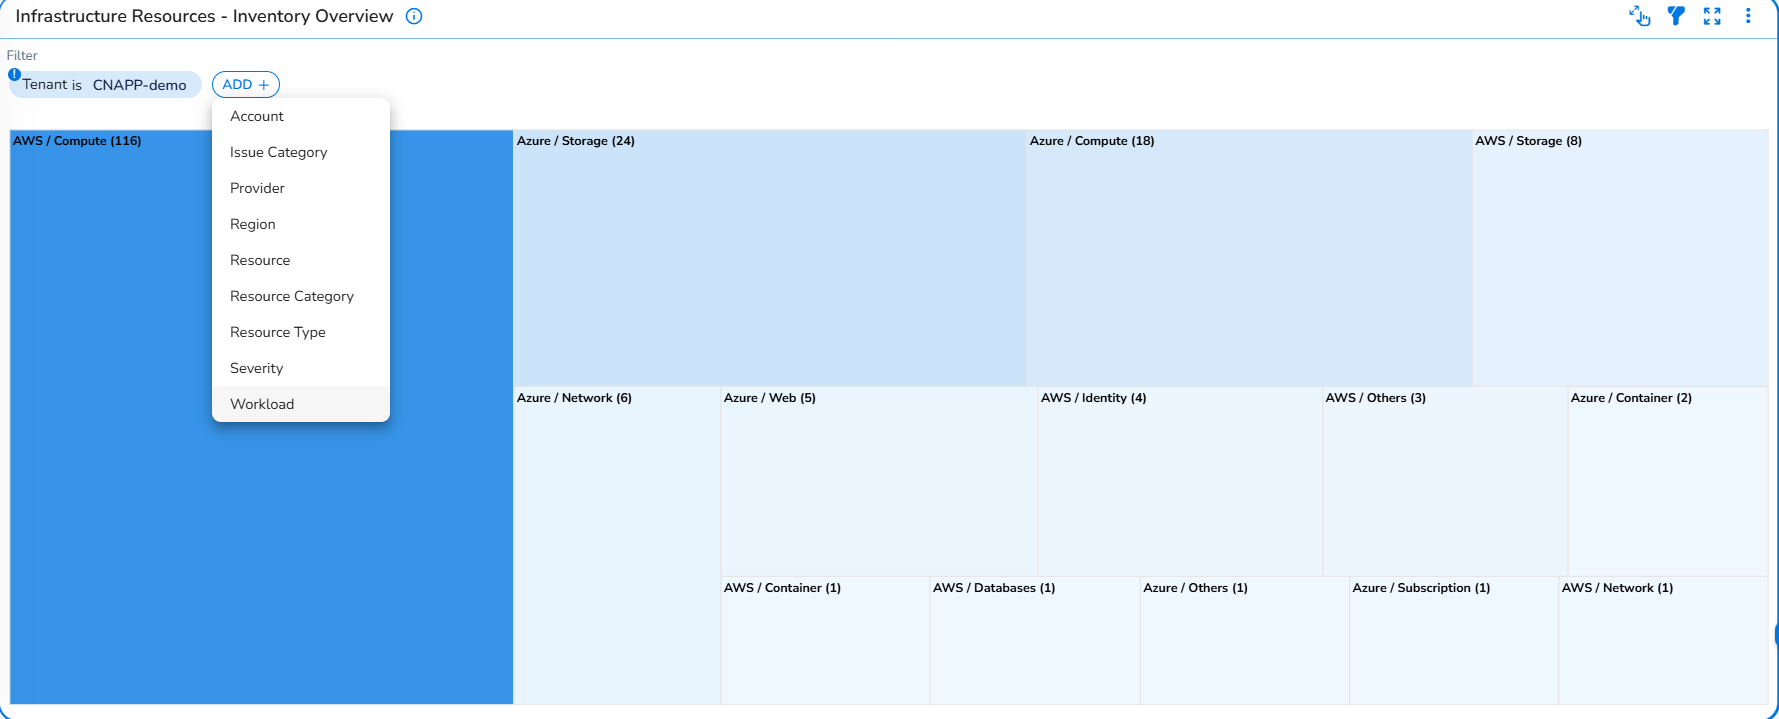
Scroll down to the Infrastructure Resources: Inventory Overview chart. The treemap displays all cloud resources grouped by resource category and cloud provider — for example, AWS / General, AWS / Storage, AWS / Identity, OCI / Networking. Each tile is sized proportionally to the number of resources in that group.
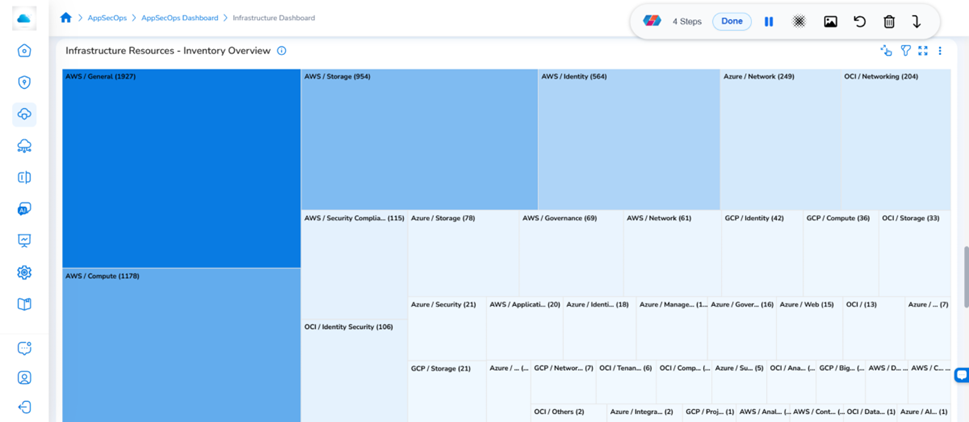
The Infrastructure Resources: Inventory Overview chart groups cloud resources by category and cloud provider.
Step 2: View a Resource Category's Security Summary
Hover over any tile to see a tooltip showing the resource category, the number of affected resources, and counts for Vulnerabilities, Threats, and Misconfigurations for that category.
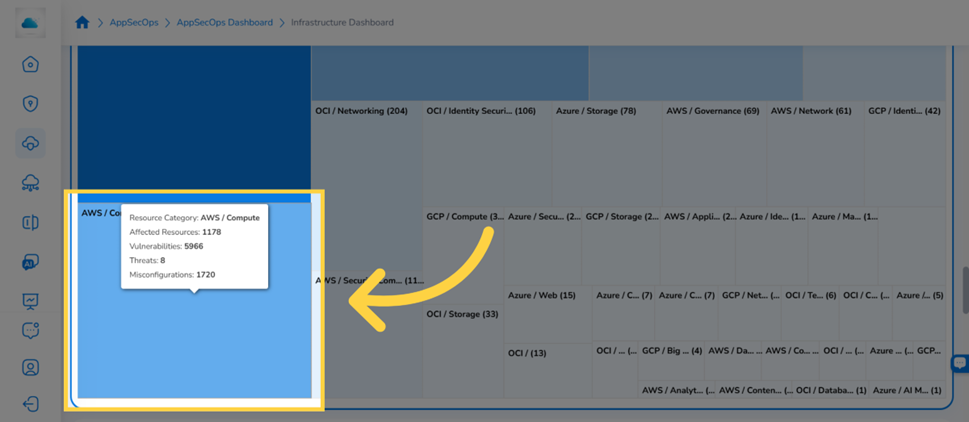
Hovering over a tile reveals the security summary for that resource category.
Step 3: Explore Resources Within a Category
Select a category tile to move to the resource type view. The chart refreshes to display tiles for each resource type within the selected category. A breadcrumb at the top shows the current path — for example, AWS / Compute – By Resource Type — and a back arrow lets users return to the previous view.
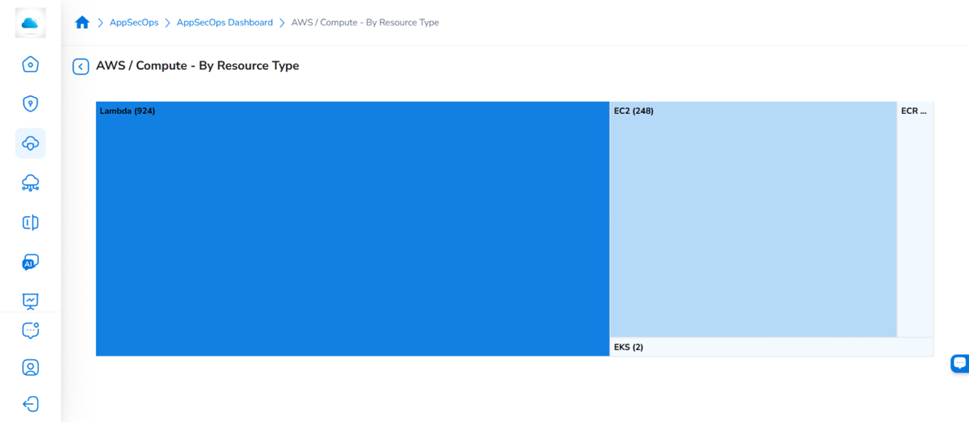
Selecting a category tile loads a view of all resource types within that category.
Step 4: View a Resource Type's Security Summary
Hover over any resource type tile to see a tooltip showing the resource type, the number of affected resources, and counts for Vulnerabilities, Threats, and Misconfigurations for that resource type.
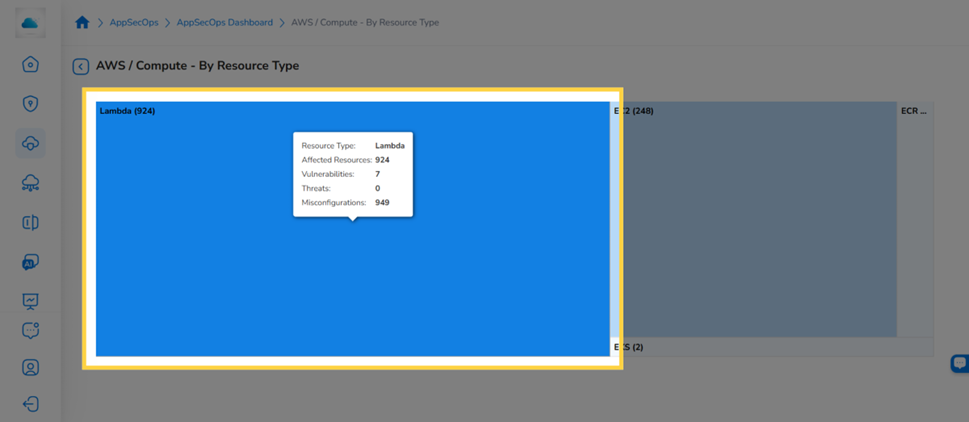
Hovering over a resource type tile shows the security breakdown for that type
Step 5: View Security Issues by Type
Select a resource type tile to move to the issue type view. The chart displays tiles for each issue type — Misconfigurations, Vulnerabilities, and Threats — sized by the number of issues in each category. Hover over a tile to see a tooltip showing the issue type and total issue count.
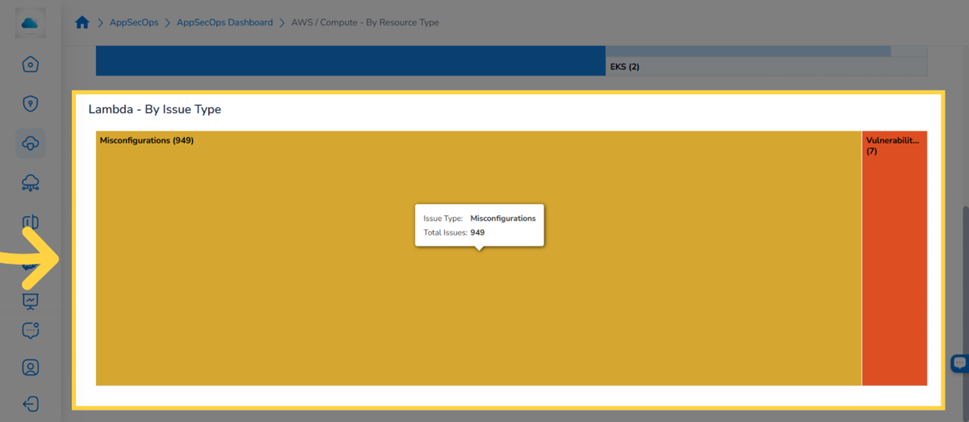
Selecting a resource type tile shows security issues broken down by type.
Step 6: Open the Security Issues Explorer
Select an issue type tile to navigate to the relevant explorer. For example, selecting Misconfigurations opens the Infrastructure Misconfigurations – Explorer with filters pre-applied based on the resource category and resource type selected.
The Explorer displays a full table of individual security issues with the following columns: Policy Name, Policy Description, Severity, Recommendation, Resource Category, Resource Type, Resource, Resource ID, Resource Name, Cloud Provider, Cloud Account, Region/Location, Resource Group, and Source.
Step 7: Review a Security Issue in Detail
In the Explorer table, locate the security issue to investigate. Select View Details under the Actions column for that row. The policy detail page opens, showing the policy definition, severity, cloud account, policy description, recommendation, and remediation steps.
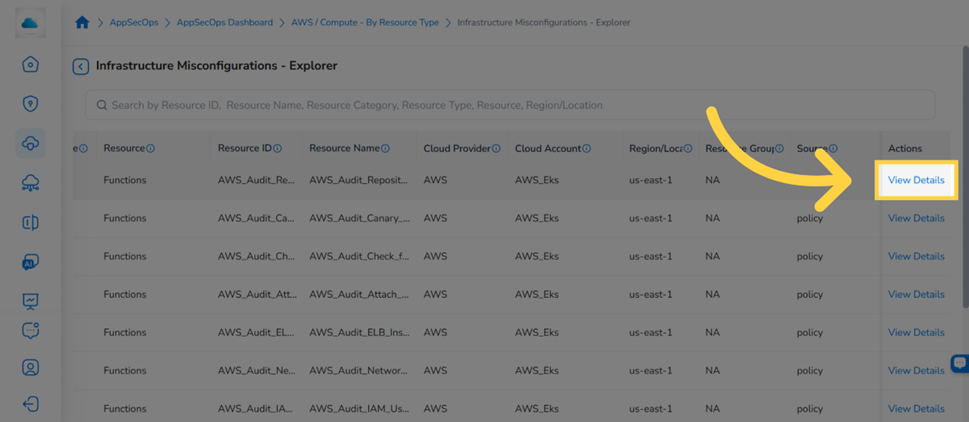
Select View Details in the Actions column to open the full security issue details.
For full guidance on navigating the explorers, reviewing finding details, and taking remediation actions, see the Infrastructure Explorers user guide
Widget Actions
Apply Filters
Click the Filter on in the widget toolbar to open or hide the filter panel. The filter panel shows any active filters and lets you add custom filters.
- To add a filter: Click ADD+, select the filter type from the dropdown, then select the values to filter by.
- To remove a filter: Click the filter chip to deselect it or clear it from the panel.
- To hide the filter panel: Click the Filter icon again.
Note: The Workload Filter is available as a widget-level filter on the Infrastructure Resources – Inventory Overview widget. Each workload in CoreStack corresponds to an onboarded cloud account and is created automatically — no manual setup is required. Applying a Workload filter scopes the treemap to display only the resource categories, resource types, and associated security issues belonging to the selected cloud account.
Use the Workload filter when you need to:
- Review the full resource inventory and security issue distribution — across categories and resource types — for a specific cloud account
- Identify which resource categories or types within a particular account carry the highest concentration of vulnerabilities, misconfigurations, or threats
- Focus the treemap on a single account before drilling down through the category and resource type levels to reach the Explorer
To apply the filter, click the Filter icon on the widget, select Workload from the filter attribute dropdown, choose the workload from the value list, and click Ok. The treemap refreshes immediately to reflect only the selected workload's data. This scoping is maintained as you navigate through the resource category, resource type, and issue type levels.
Expand the Chart View
Select the Expand View icon at the top right of the chart to open the treemap in a full-screen view. A tooltip indicates: "Some data may be hidden due to limited size. Click to expand and view complete details." Select the icon again to return to the standard view.
Use the Actions Menu
Select the ellipsis icon (⋮) at the top right of the chart to open the actions menu. The available actions are:
- Export config — export the chart configuration
- Swap Axis — swap the chart axes
- Subscribe — subscribe to chart updates
- Download as CSV — download the chart data as a CSV file
- Download as PNG — download a screenshot of the chart
Frequently Asked Questions
Q: Why does the chart show no data after navigating to the Cloud Security Dashboard?
If no tiles appear in the chart, there are two likely causes: no cloud accounts have been onboarded, or no completed security scans have run against the connected accounts. If scans have completed but the chart is still empty, check whether any active filters are excluding all results — clear all filters and reload the dashboard.
Q: What is the difference between Vulnerabilities, Misconfigurations, and Threats?
Vulnerabilities refer to known CVEs or software weaknesses detected on resources. Misconfigurations are infrastructure or service configuration settings that deviate from security best practices. Threats represent active or detected threat indicators associated with a resource. Each issue type navigates to its own explorer view.
Q: Do the filters applied in the chart carry over to the Explorer?
Yes. When users select an issue type tile to open the Explorer, the resource category and resource type selected during chart navigation are applied as filters automatically. Additional filters can be added or modified within the Explorer.
Q: How current is the data shown in the chart?
The chart reflects results from the most recent completed security scan for each connected account. It is not a real-time view — data updates after each scheduled scan cycle completes. If data appears outdated, confirm that recent scans have completed successfully.
Q: A tile is visible but selecting it does not navigate to the next view. What should I check?
Confirm that the tile has a non-zero resource count — tiles for empty categories may display but are not navigable. If the tile has a count and selecting it still does not progress to the next view, refresh the page, navigate back to the chart, and try again.
Troubleshooting
The Cloud Security Dashboard or chart is not visible
Cause: The user role may not include Graphion permissions, or the Graphion module may not be enabled for the organization.
Solution:
- Confirm with a CoreStack administrator if you have the necessary roles and permissions assigned under the appropriate bundles.
- Ask the administrator to verify that the Graphion module is enabled for the organization.
- Log out and back in to refresh the session after any role changes.
- If the module is enabled and the role is correct but the chart remains invisible, contact CoreStack support with the account ID and the role currently assigned to the user.
The Explorer opens with no results after selecting an issue type tile
Cause: The filters carried forward from the chart may be too specific, or the most recent scan may not have recorded security issues for the selected resource type and issue type combination.
Solution:
- In the Explorer, open the filter panel and review the active filter conditions. Remove or broaden any filters that may be excluding results.
- Confirm that a scan has completed recently for the cloud account that contains the selected resource type.
- If security issues are expected but remain absent after clearing all filters, contact CoreStack support with the account ID, the resource type selected, the issue type selected, and the approximate timestamp of the most recent scan.
Updated 10 days ago