

CloudWatch Agent
Introduction
The Amazon CloudWatch agent helps to gather system-level metrics from Amazon EC2 instances and on-premises servers, retrieve custom metrics from your applications or services, gather logs from Amazon EC2 instances and on-premises servers, and more.
The CloudWatch agent needs to be installed in EC2 instances as a prerequisite, and metrics of the CloudWatch agent can be set up using CoreStack. Having the CloudWatch agent ensures in-depth monitoring of configured metrics.
Note:Users will incur additional costs associated with setting up the CloudWatch agent for enhanced monitoring. Refer to this link to learn more about pricing: https://aws.amazon.com/cloudwatch/pricing/
Configuring the CloudWatch Agent
Perform the following steps to configure metrics for the CloudWatch agent:
- Access CoreStack and go to Resource > Inventory.
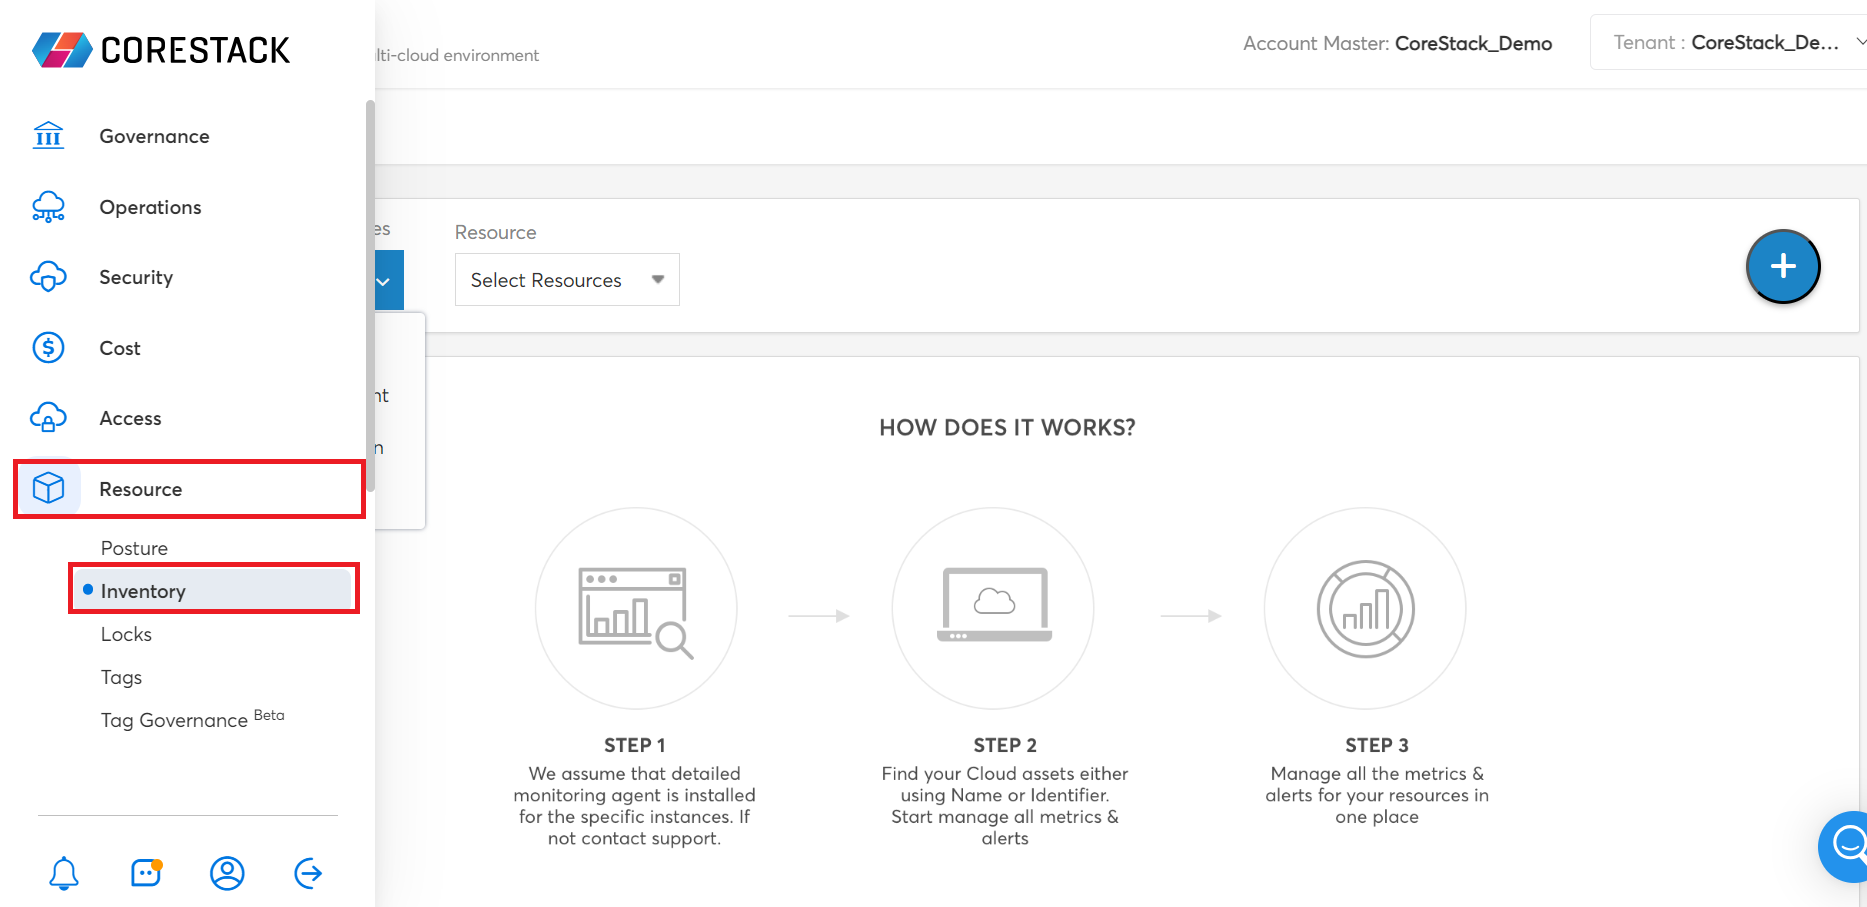
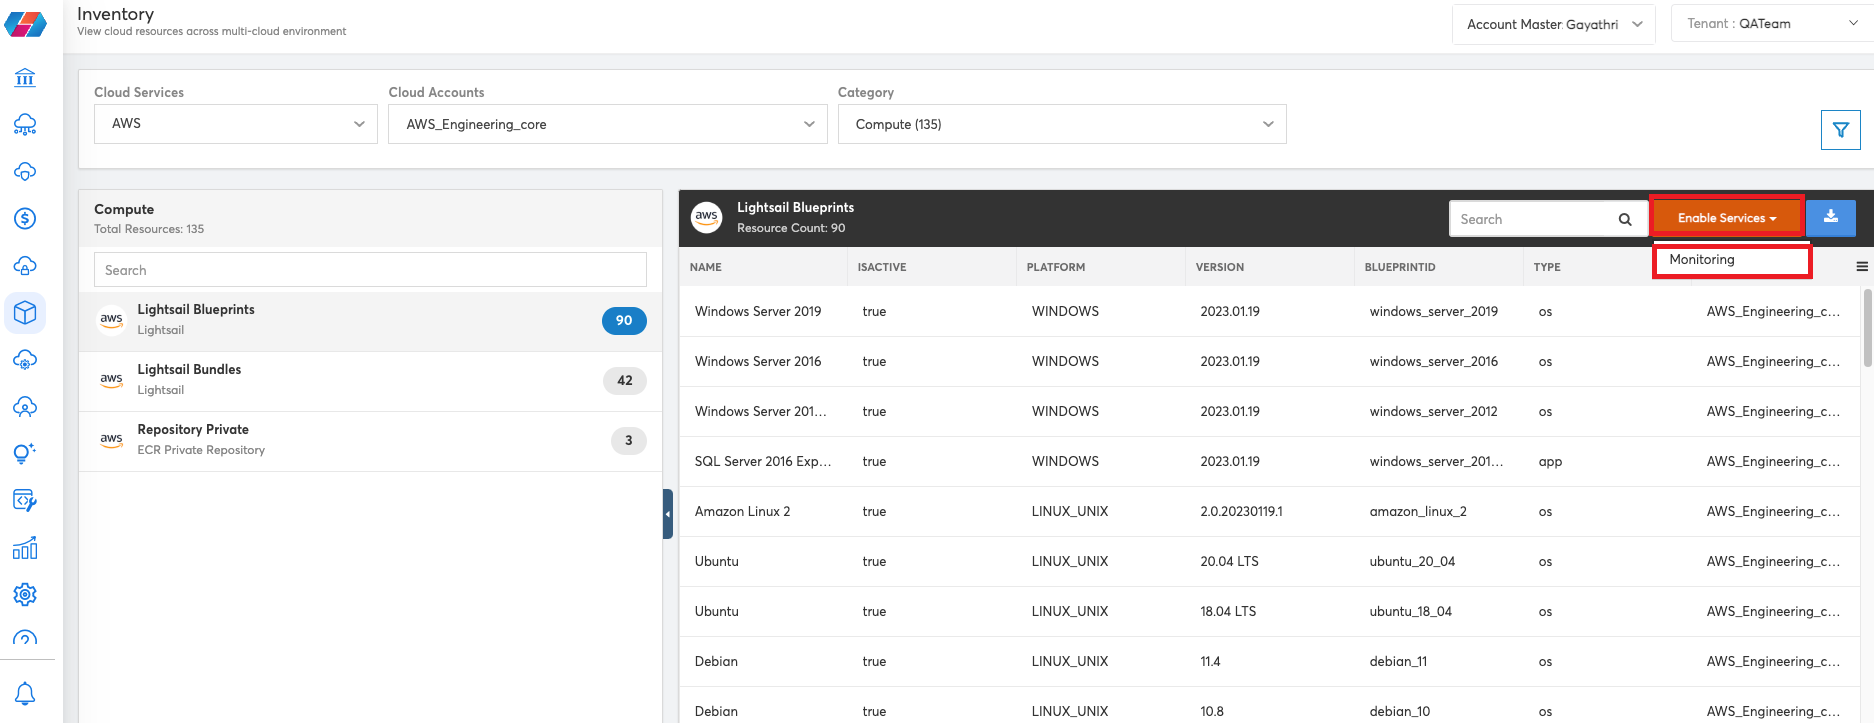
- In the Enable Services list, click Monitoring.
- In the Select a Tool list, click to select the option CloudWatch Agent and in the Resource list, click to select an AWS resource.
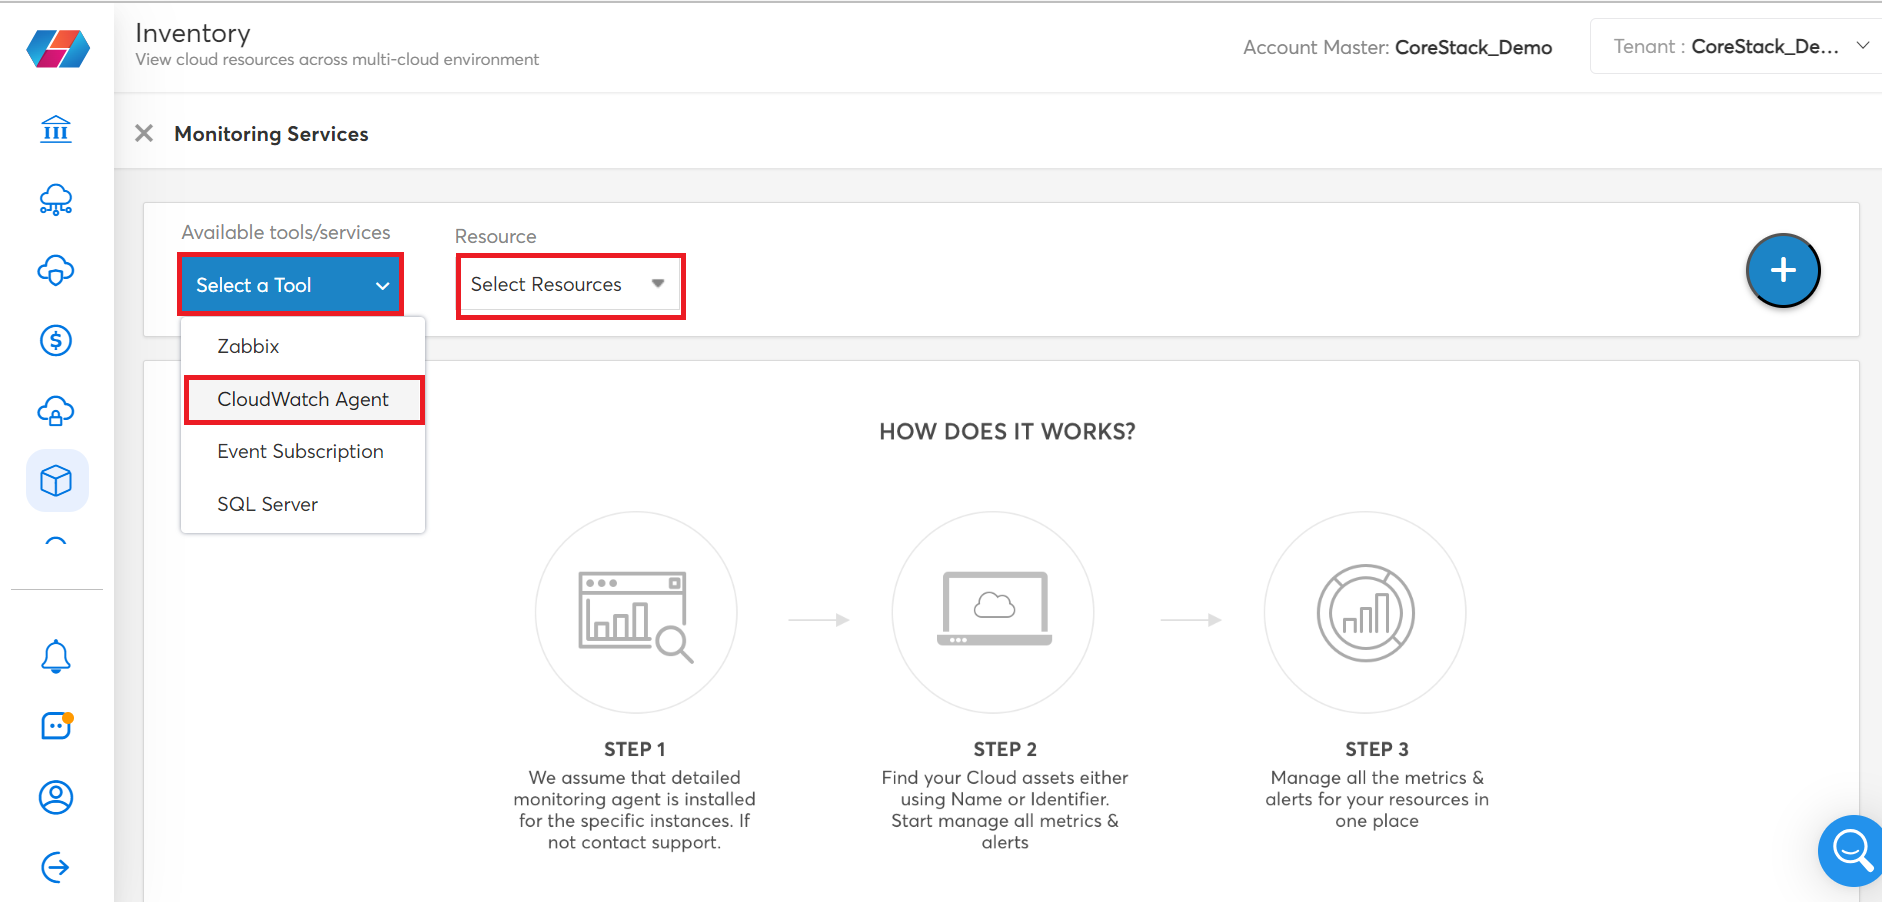
This enables the Regions and Resource fields.
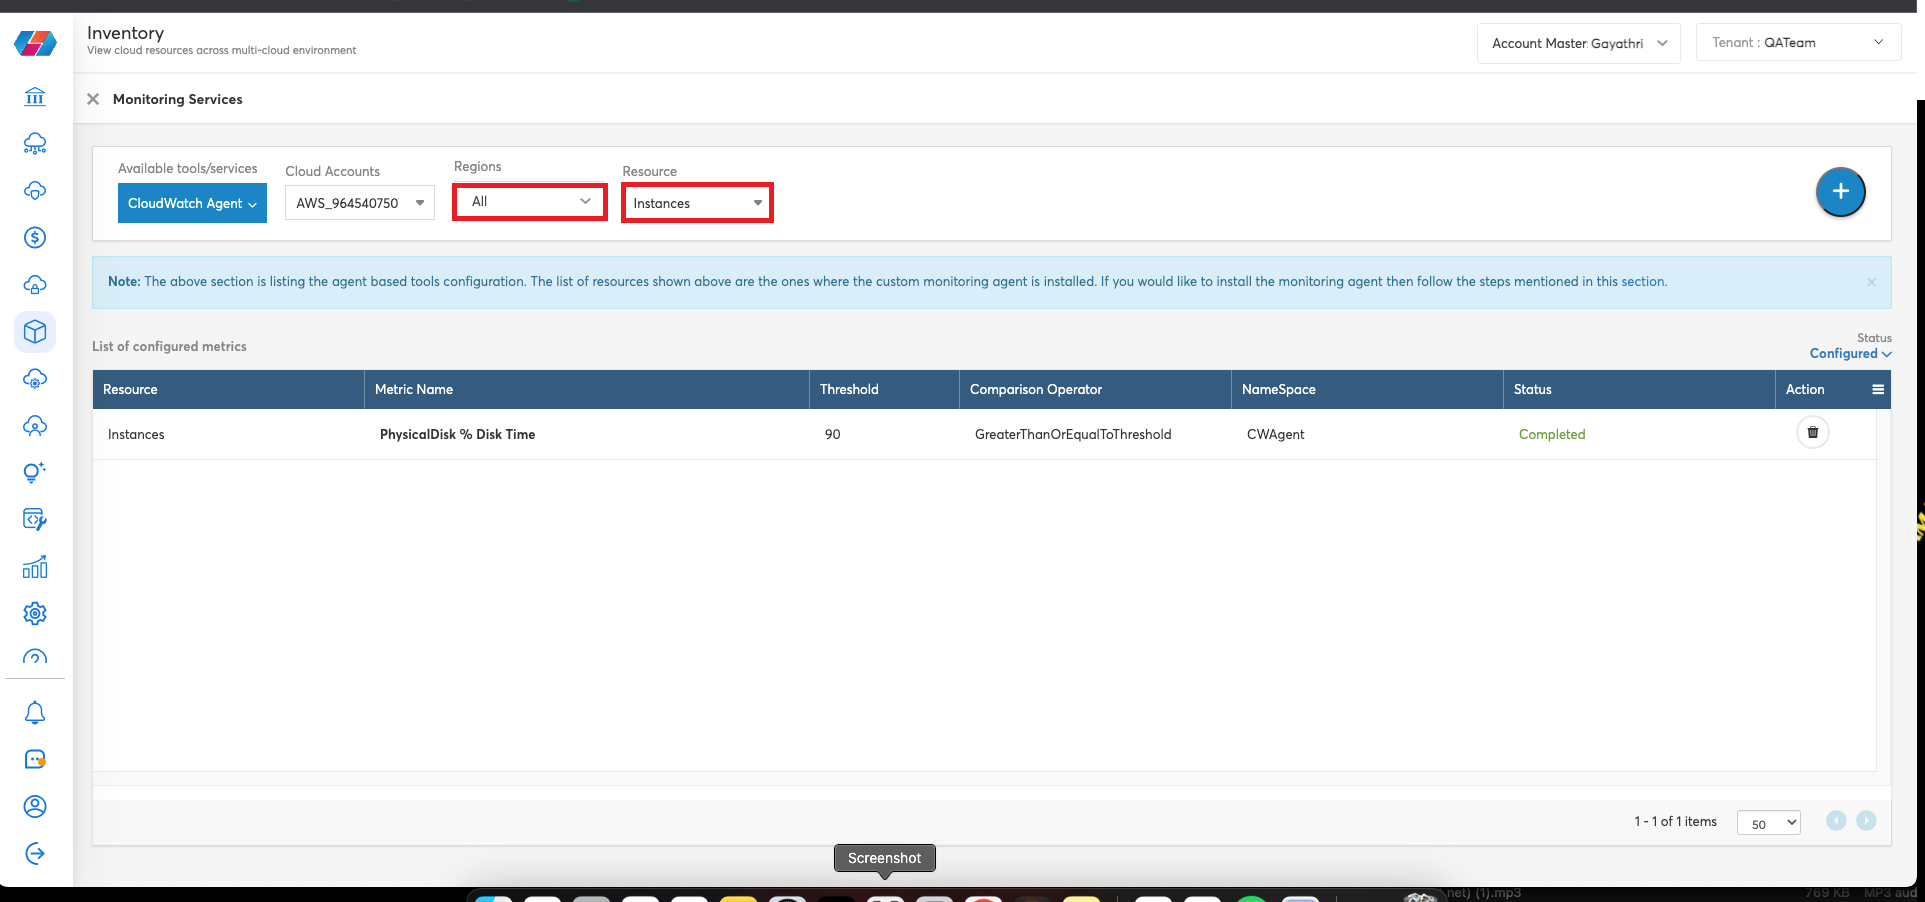
- In the Regions list, click to select region(s) and click Apply. Multiple options can be selected.
- In the Resource list, click to select Instances.
- To add a new metric configuration, click the plus icon.
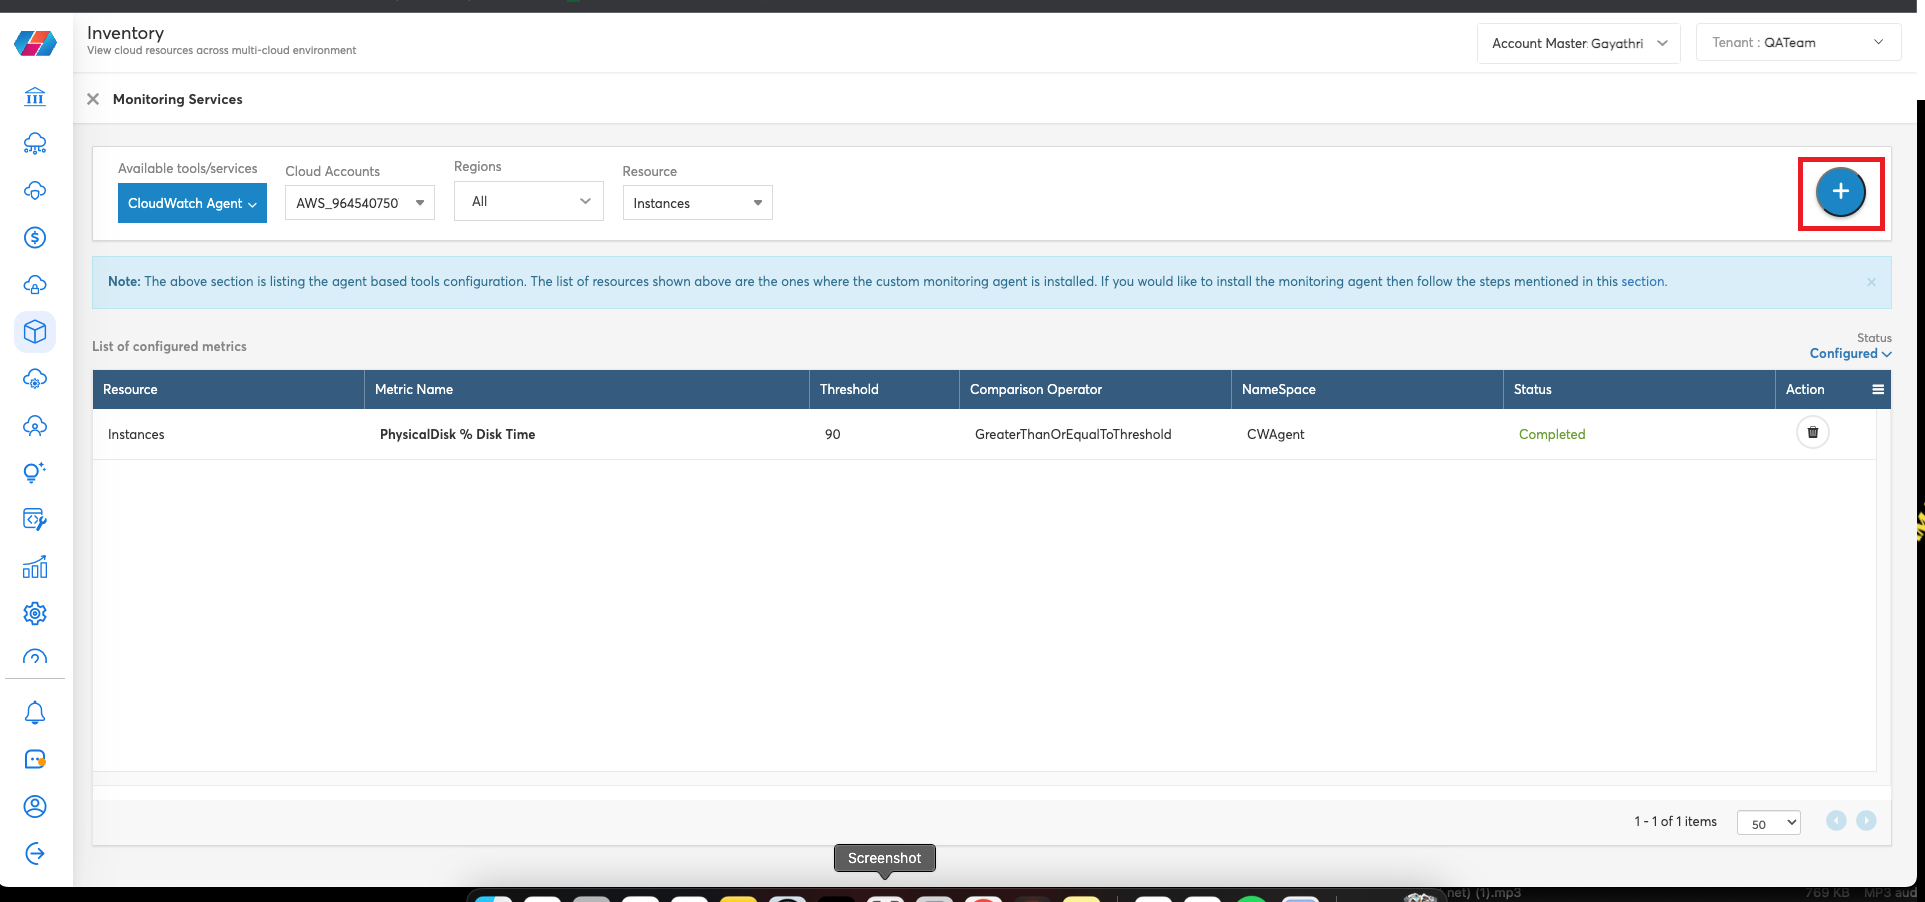
The New Metric Configuration dialog box opens.
- In the New Metric Configuration dialog box, fill the following fields:
- Select the Tag Constraint checkbox to enable this field, and in the Tag Key box, type a tag key and in the Tag Values text box, type any tag values.
- In the Select Metric Name list, click to select a metric that needs to be monitored.
- In the Threshold box, type a threshold value against which the statistic will be compared.
- In the ComparisonOperator list, click to select an operator for comparing the threshold with the statistic.
- In the Statistic list, click to select the statistic for the alarm metric.
- In the Period box, type an evaluation period in minutes. The value in this field cannot be more than 1440 minutes.
- In the EvaluationPeriods box, type the time period over which data will be compared to the specified threshold. The value in this field cannot be more than 1440 minutes.
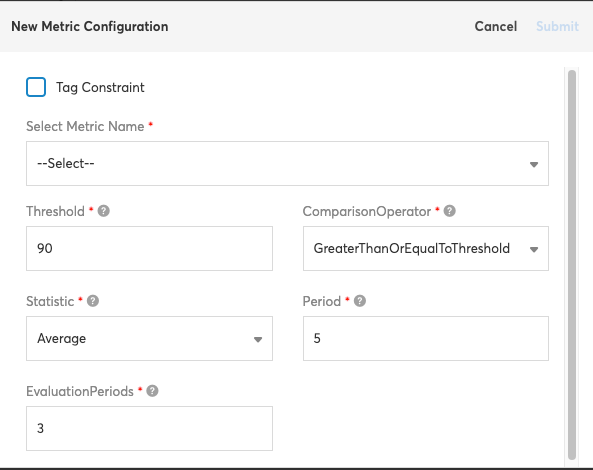
- Click Submit.
The new metric will now be listed in the List of configured metrics section, and will be added to the AWS hyperscaler as well through CoreStack. You can delete an existing metric and use the Status list to select either Configured or Pending to view the list of configured or pending metrics.
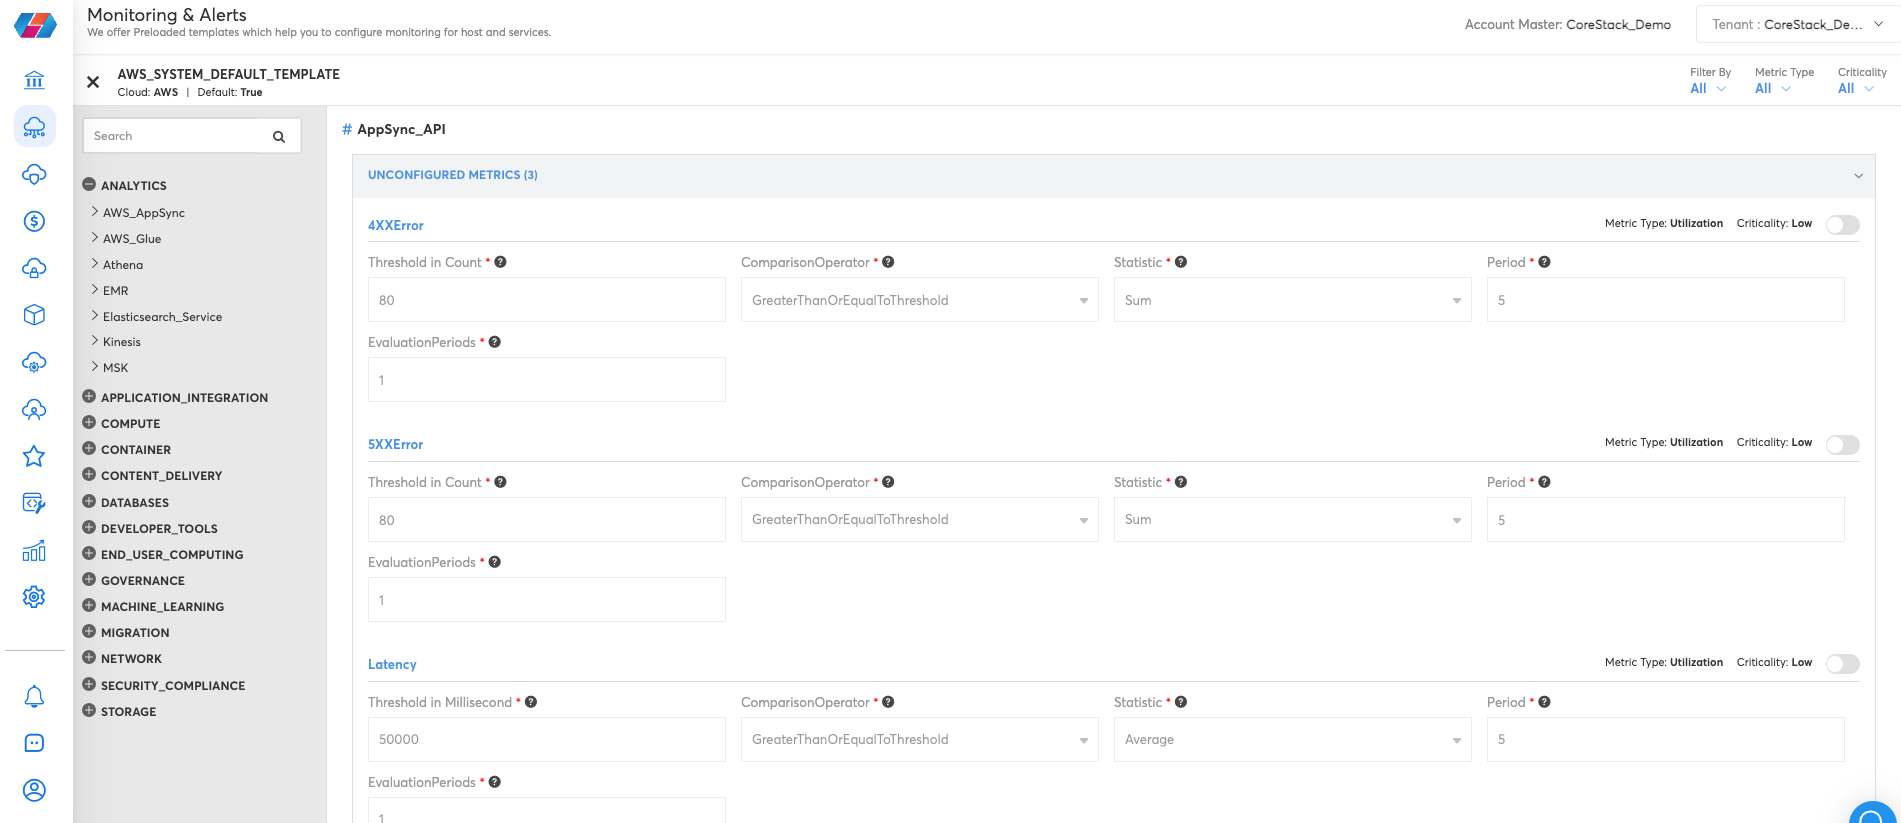
Additionally, CloudWatch metrics are grouped by dimension. Refer here to know more about dimensions. The custom metrics of CloudWatch Agent with single dimensions are now added as part of our existing system metric templates under Monitoring and Alerts.
Note:These metrics need to have a CloudWatch Agent installed as a prerequisite. If the agent is not installed and metrics are set up, they won’t generate any alerts and will incur cost to the users.
Custom Metrics
Please refer to the table below for the list of custom metrics supported by CoreStack specific to CloudWatch Agent.
Note:The following SSM permissions need to be enabled in the AWS environment to use the CloudWatch custom metrics:
ssm:SendCommand(to run a command)ssm:GetCommandInvocation(to fetch details of the invoked command)
| Service | Category | Resource Type | Resource | Metric |
|---|---|---|---|---|
| AWS | Compute | EC2 | Instances | disk_total |
| AWS | Compute | EC2 | Instances | disk_used |
| AWS | Compute | EC2 | Instances | disk_used_percent |
| AWS | Compute | EC2 | Instances | diskio_io_time |
| AWS | Compute | EC2 | Instances | diskio_read_time |
| AWS | Compute | EC2 | Instances | diskio_write_time |
| AWS | Compute | EC2 | Instances | diskio_writes |
| AWS | Compute | EC2 | Instances | diskio_reads |
| AWS | Compute | EC2 | Instances | swap_free |
| AWS | Compute | EC2 | Instances | swap_used_percent |
| AWS | Compute | EC2 | Instances | mem_used_percent |
| AWS | Compute | EC2 | Instances | cpu_usage_user |
| AWS | Compute | EC2 | Instances | cpu_usage_system |
| AWS | Compute | EC2 | Instances | cpu_usage_idle |
| AWS | Compute | EC2 | Instances | cpu_usage_iowait |
| AWS | Compute | EC2 | Instances | mem_used |
| AWS | Compute | EC2 | Instances | mem_total |
| AWS | Compute | EC2 | Instances | swap_used |
| AWS | Compute | EC2 | Instances | mem_cached |
| AWS | Compute | EC2 | Instances | LogicalDisk % Free Space |
| AWS | Compute | EC2 | Instances | Paging File % Usage |
| AWS | Compute | EC2 | Instances | Memory % Committed Bytes In Use |
Also, refer to the screenshot provided below to understand the fields that need to be filled with the metrics details.
Note:You can also refer to a list of general system metrics supported by CoreStack.
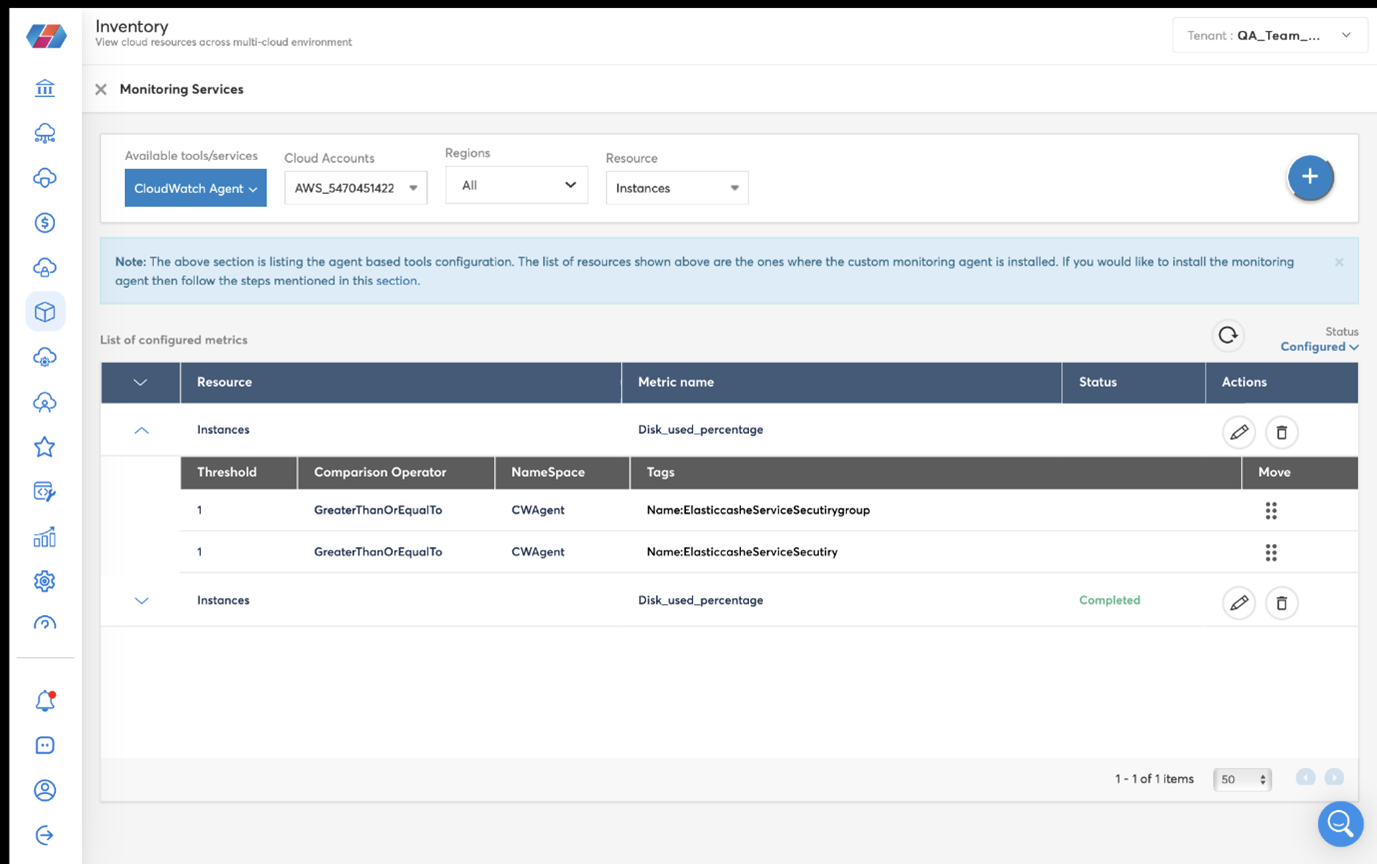
Editing Custom Metrics
Users can edit custom metrics for resources that are already available, and any new configurations will also be automatically added to the resources.
Note:
- All the existing and new instances with CloudWatch Agent will be synced with the platform even if custom metric monitoring is enabled.
- The new or existing resources which have had changes will resync automatically.
- If the metrics are differentiated through tags, then users can prioritize the metrics based on tags.
- Users can use the manual synchronize option to synchronize details if auto-sync fails or if they want to synchronize details before the auto-sync happens.
Updated 9 months ago