

Infrastructure Explorers
This user guide will help the users to learn how to view, search, filter, and investigate vulnerabilities, threats, and misconfigurations across your cloud infrastructure using the CoreStack Graphio Infrastructure Explorers.
Feature Overview
The Infrastructure Explorers widget is a security investigation tool within CoreStack's Graphion module, available on the Cloud Security Dashboard. It surfaces three categories of cloud security findings in a single widget — vulnerabilities, threats, and misconfigurations — each accessible as a dedicated tab backed by a sortable, filterable, and searchable table.
The widget is most relevant when the development, security or Ops teams need to triage active findings, investigate a specific CVE or policy violation, or take remediation actions directly without leaving the dashboard.
Note: The Infrastructure Explorers widget is visible only if your organization has the appropriate product bundle and you have been assigned the appropriate roles and permissions. If the widget does not appear on the Cloud Security Dashboard, contact your Tenant Admin to confirm bundle activation and role assignment.
How It Works
CoreStack regularly collects security findings from connected cloud accounts, links each finding to the affected resource, and adds extra metadata — CVSS and EPSS scores for vulnerabilities, intent labels from cloud detection for threats, and policy severity for misconfigurations. These enriched findings appear in the Infrastructure Explorers widget as paged tables. Users can filter results, open detail views for investigation, remediate findings (suppress or auto-fix) from the table. All three tabs use the same filter bar, search box, and options menu; each tab has its own columns, default sort, and detail view.
Prerequisites
Before you begin, ensure the following:
- Roles and Permissions: You have the necessary roles and permissions assigned in assigned in CoreStack under the appropriate bundles.
- Cloud accounts: At least one cloud account (AWS, Azure, GCP, or OCI) has been onboarded and scanned in CoreStack. Security issues appear only after at least one completed scan.
- Access: You can navigate to Graphion > Cloud Security > Cloud Security Dashboard using the CoreStack left navigation sidebar.
Vulnerability Explorer
The Vulnerability Explorer tab surfaces known CVEs and vulnerability findings detected across your cloud resources, correlated with CVSS, EPSS, and CISA KEV data. Use it to assess exposure breadth, priorities remediation by exploitability, or investigate a specific CVE across multiple accounts and regions.
Viewing the Vulnerability Explorer
Navigate to Graphion > Cloud Security > Cloud Security Dashboard and scroll to the Infrastructure Explorers widget. Click the Vulnerabilities tab.
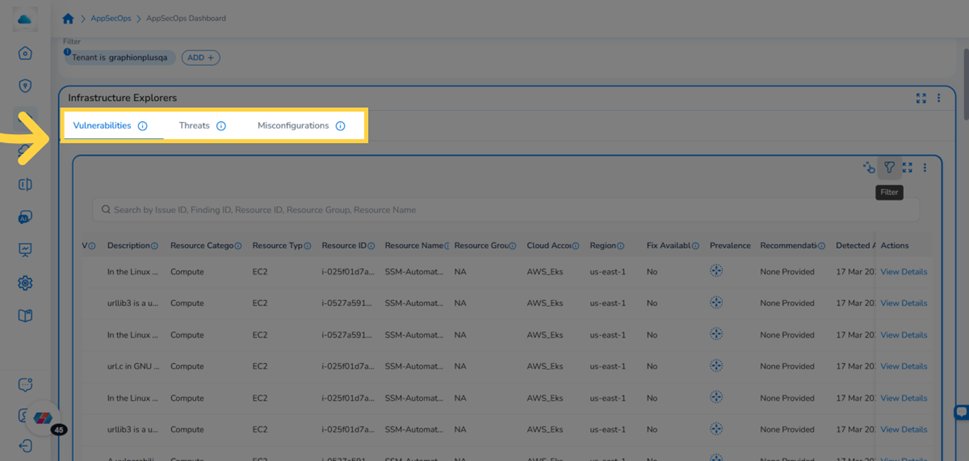
Infrastructure Explorers widget showing the three tabs: Vulnerabilities, Threats and Misconfigurations
The table loads and displays up to 100 records per page, sorted by severity descending by default. Each row represents a unique finding. The table includes the following columns:
Note: The columns displayed in the table may vary based on the user's selection.
| Column | Description |
|---|---|
| Issue ID | Unique identifier of vulnerabilty, (typically a CVE) used to track issue across security databases. |
| Title | Short title describing the vulnerability. |
| Finding ID | Unique identifier for this specific vulnerability instance detected on a resource. |
| Issue Type | Category of the security issue (e.g. Vulnerability). |
| CVSS | Common Vulnerability Scoring System indicating the technical severity of the vulnerability (0-10) |
| Severity | Normalized severity level assigned to the vulnerability (Critical, High, Medium, or Low) |
| EPSS | Exploit Prediction Scoring System value estimating likelihood that the vulnerability is exploited in the wild. |
| Is KEV | Indicates whether the vulnerability is listed in CISA’s Known Exploited Vulnerabilities (KEV) catalog. |
| Description | Detailed explanation of the vulnerability and its potential security impact. |
| Resource Category | High-level category of the affected resource (e.g. Compute, Storage, Network). |
| Resource Type | Specific cloud service or resource type where the vulnerabilty was detected (e.g. EC2 Instance, Container Image). |
| Resource ID | Unique identifier of the cloud resource associated with the finding |
| Resource Name | Name assigned to the affected resource in the cloud environment. |
| Resource Group | Logical grouping of related resources used for management and organization. |
| Cloud Account | Cloud account where the affected resource resides. |
| Region | Cloud region where the resource is deployed. |
| Fix Availability | Indicates whether a vendor patch or remediation is available for the vulnerability. |
| Prevalence | Number of resources affected by this vulnerability. Click the icon to open the Prevalence view. |
| Recommendation | Suggested remediation steps to resolve or mitigate the vulnerability. |
| Detected At | Timestamp when the vulnerability was first detected on this resource. |
| Created Date | Date when the vulnerability entry was originally pushed in the vulnerability databases. |
| Modified Date | Last updated date for the vulnerability record in the National Vulnerabilty Database. |
| Ingested Date | Date when this vulnerability data was ingested into the platform. |
| Actions | Per-row actions, including View Details. |
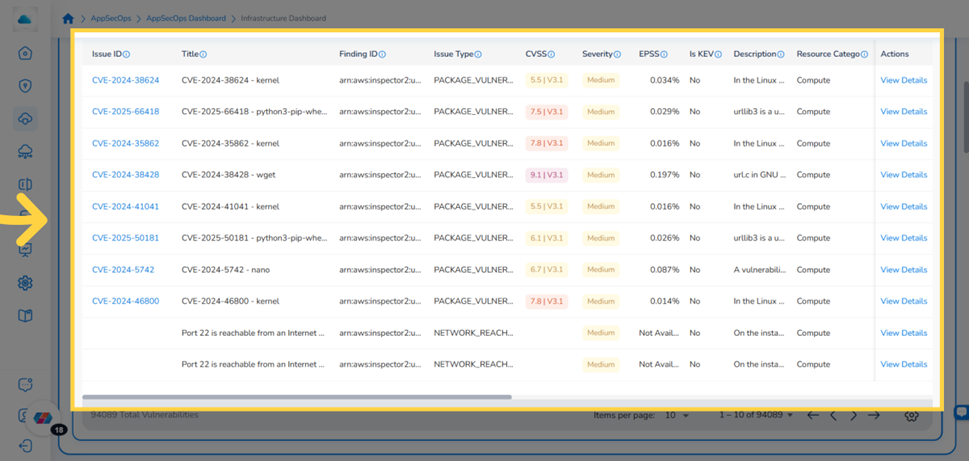
Vulnerabilities tab showing the full column set including Issue ID, CVSS, EPSS, Is KEV, and Actions
Searching for Vulnerabilities
- Type your search term in the Search box at the top of the Infrastructure Explorers widget. The table filters in real time as you type.
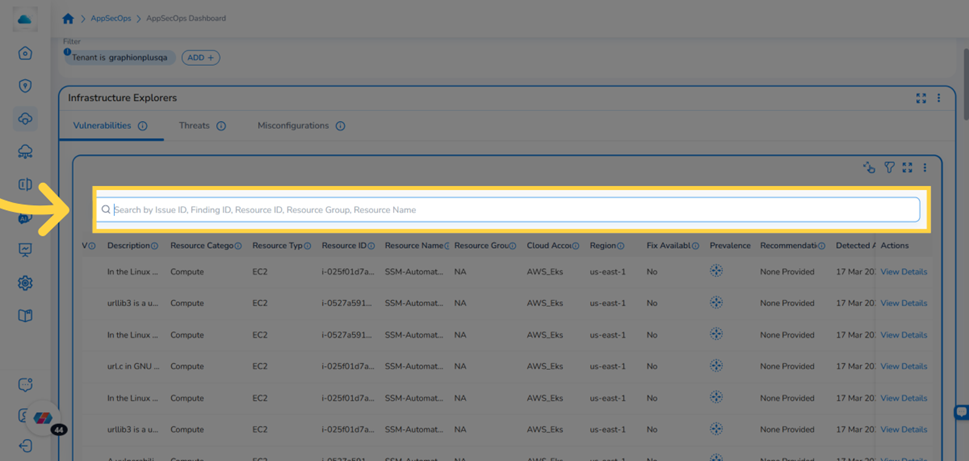
Search box in the Infrastructure Explorers widget with a search term entered
- To clear the search, delete the text from the Search box. The table reloads all records.
Filtering Vulnerability Data
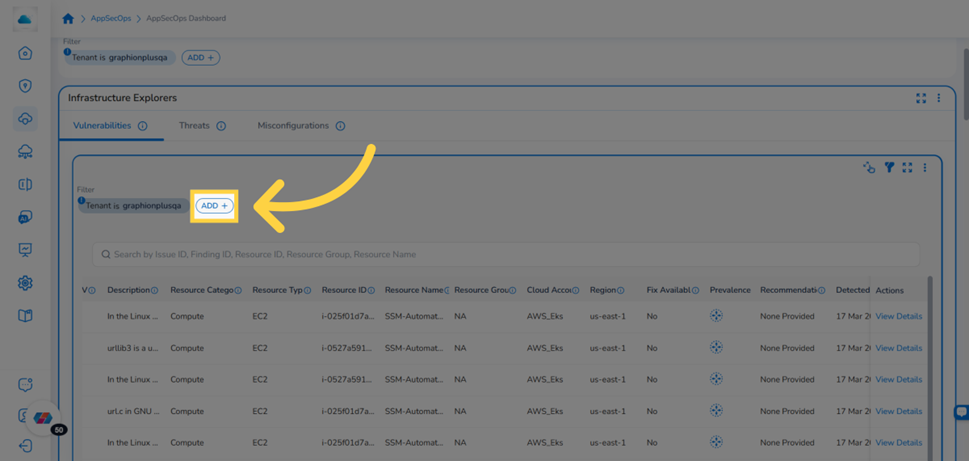
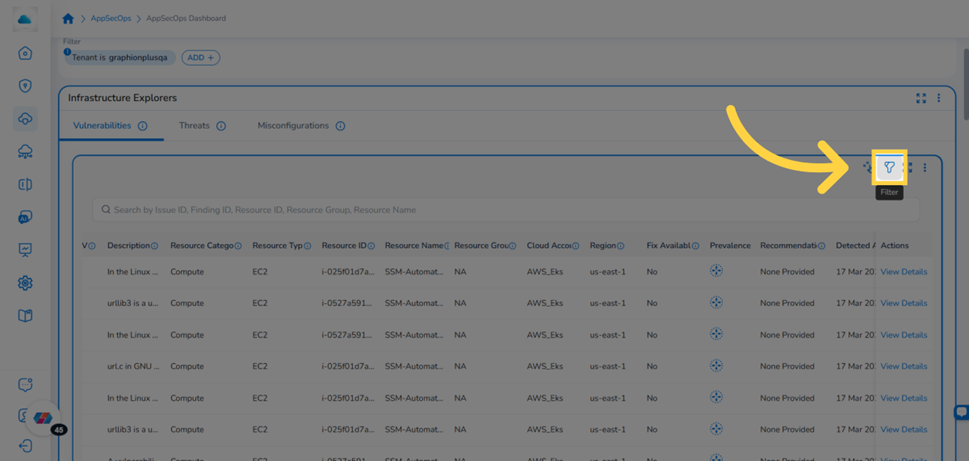
- Click the Filter icon in the Infrastructure Explorers widget header. The filter panel expands.

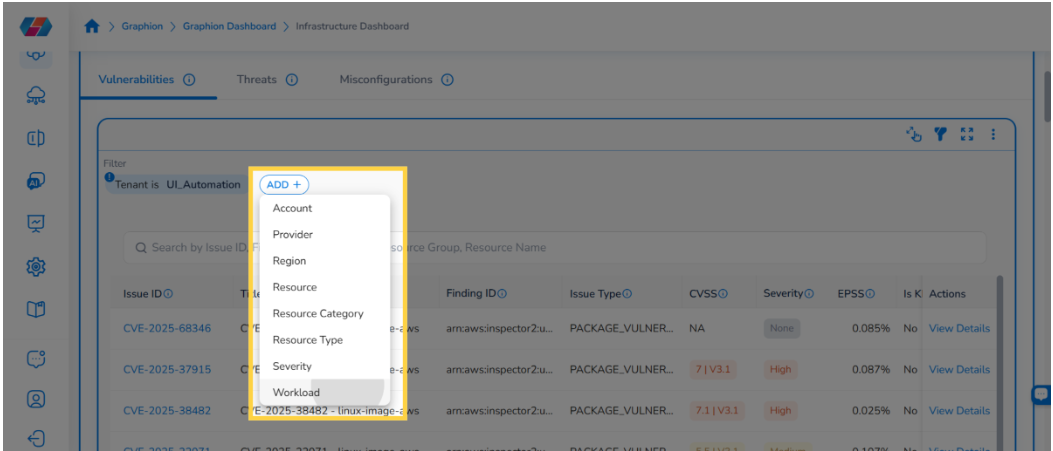
Infrastructure Explorers filter panel showing the Tenant global filter and the ADD+ button for custom filters
- Click ADD+ to add a filter condition. Select a filter attribute from the drop-down.
Filter panel with ADD+ selected and filter attribute drop-down visible
- Select a filter attribute. For example, select Severity to filter by severity level. Supported attributes include Severity, Cloud Provider, Cloud Account, Region, Resource Category, Resource Type, and Resource.
- Click the value drop-down for the selected attribute and choose one or more values.
- Click Ok to apply the filter. The table updates immediately.
To remove a filter, click the × next to it in the filter panel. To hide the panel without clearing filters, click the Filter icon again.
Note: The Workload Filter is available as a widget-level filter on the Infrastructure Explorers widget and applies across all three tabs — Vulnerabilities, Threats, and Misconfigurations. Each workload in CoreStack corresponds to an onboarded cloud account and is created automatically — no manual setup is required. Applying a Workload filter scopes the findings table to only those security issues detected within the selected cloud account, across all three explorer tabs simultaneously.
Use the Workload filter when you need to:
- Investigate all vulnerabilities, threats, and misconfigurations tied to a specific cloud account in one place
- Narrow a large findings list to a single account before triaging or taking remediation actions
- Cross-reference findings across issue types (e.g., vulnerabilities vs. misconfigurations) for the same cloud account
To apply the filter, click the Filter icon on the widget, select Workload from the filter attribute dropdown, choose the workload from the value list, and click Ok. The active explorer tab refreshes immediately, and the filter remains applied as you switch between the Vulnerabilities, Threats, and Misconfigurations tabs.
Viewing CVE Details
-
Locate the vulnerability you want to investigate in the table.
-
Click View Details in the Actions column, or click the Issue ID link directly. The CVE detail page opens.
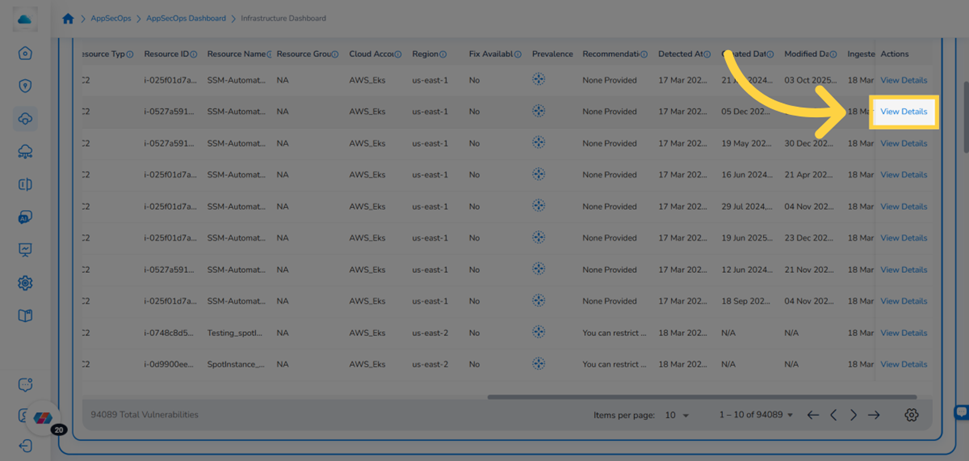
Vulnerabilities table row with the View Details link highlighted in the Actions column
- Review the summary banner at the top of the page. It shows four key metrics:
- Severity: The severity rating. For CVE-based vulnerabilities, the rating is sourced from NVD. For GHSA-based vulnerabilities, it is sourced from GitHub Security Advisories.
- CVSS: The CVSS base score using v3.1 when available. If v3.1 is unavailable, the system falls back to v4.0 or v2.0.
- Vulnerability Age: The number of days since the CVE was published in NVD.
- Prevalence: Click this icon to view the prevalence vulnerabilities breakdown across all supply chain components, organizational entities, and infrastructure comp.
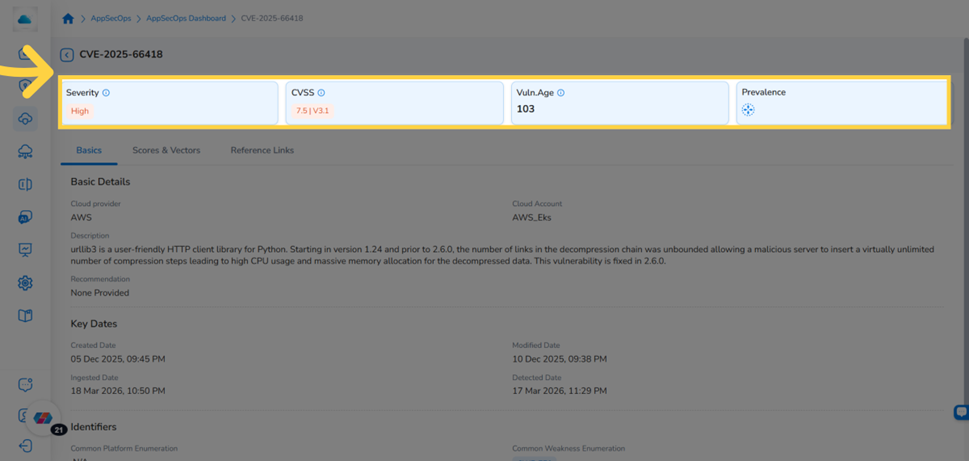
CVE detail page showing the Severity, CVSS, Vulnerability Age, and Prevalence icons at the top
- The Basics tab is selected by default. It contains three sections: Basic Details (description, issue type, affected component), Key Dates (detected, created, and modified dates), and Identifiers (CVE ID, Finding ID, resource hierarchy).
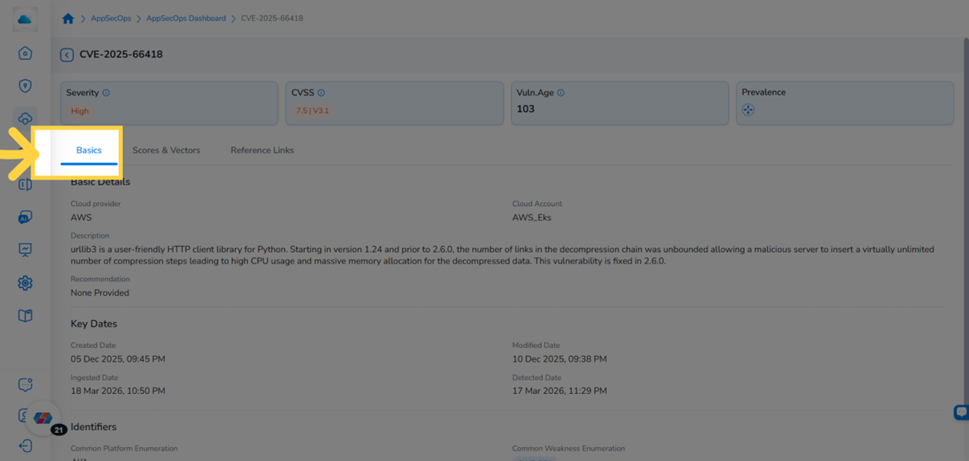
CVE detail page showing the Basics tab with Basic Details, Key Dates, and Identifiers sections
- Click the Scores & Vectors tab to view the full CVSS breakdown and EPSS percentage.
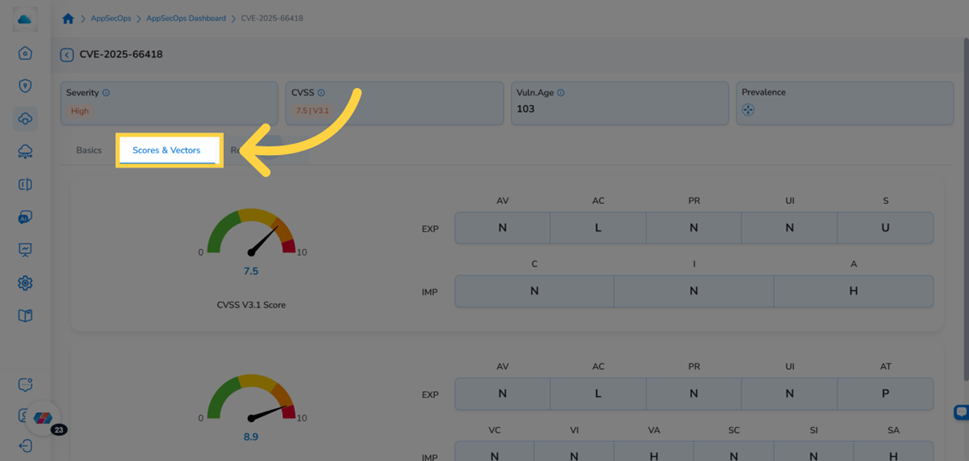
Scores & Vectors tab showing the CVSS score breakdown and EPSS percentage
- Click the Reference Links tab to view external references: advisories, solutions, tools, and available fixes.
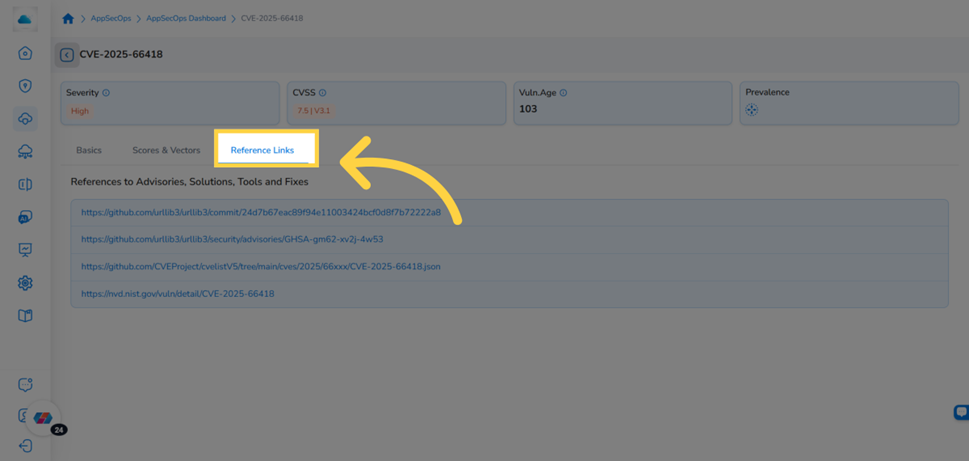
Reference Links tab showing advisory and fix reference links from NVD
- Click the back arrow at the top of the page to return to the Vulnerabilities tab.
Viewing Vulnerability Prevalence
-
Locate the vulnerability you want to investigate.
-
Click the Prevalence icon in the Prevalence column for that row.
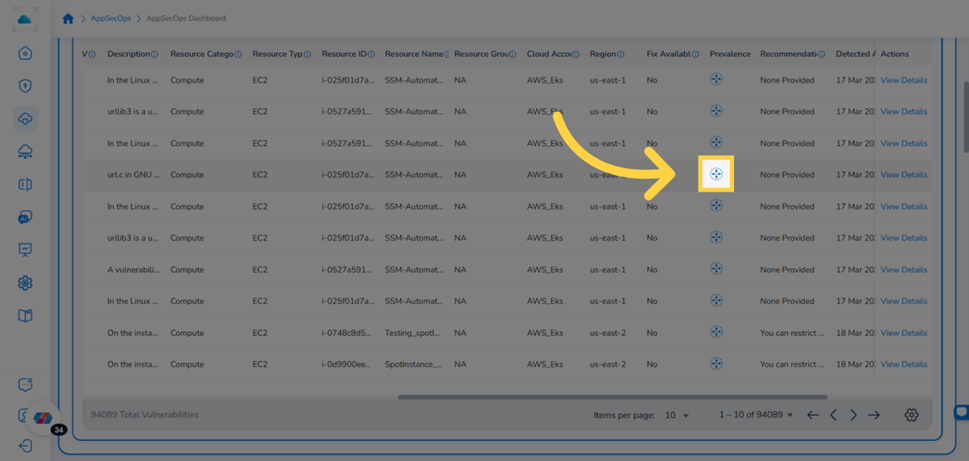
Vulnerabilities table showing the Prevalence column with the icon highlighted for a specific row
Alternatively, open the CVE detail page and click the Prevalence icon in the summary banner.
- Review the three summary counters: Affected Supply Chain, Affected Organizational Entities, and Affected Infra Resources.
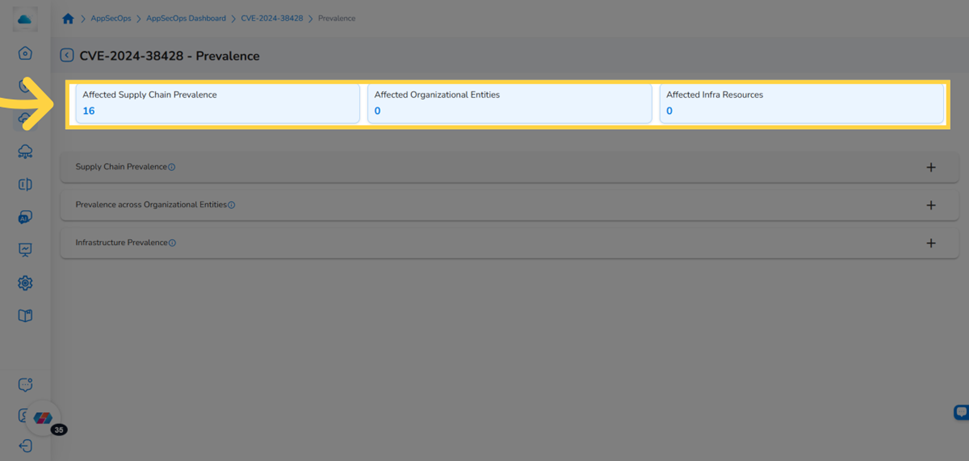
Prevalence view showing three summary counters at the top for Supply Chain, Organizational Entities, and Infrastructure
- Click the + icon to expand each section:
- Supply Chain Prevalence: Shows software components that contain this vulnerability and the infrastructure they run on. Users can view the related details in these columns: Component Type, Component Name (Version), Project Name, Resource Category, Resource Type, Resource, Resource ID, Resource Name, Cloud Account.
- Prevalence across Organizational Entities: Shows which Projects, Applications, and Portfolios own affected resources.
- Infrastructure Prevalence: Shows which cloud resources are directly affected. Users can view the related details in these columns: Category, Resource Type, Resource ID, Resource Name, Cloud Account.
- Click the back arrow to return to the Vulnerabilities tab.
Threat Explorer
The Threats tab surfaces active threat alerts and suspicious activity findings from cloud-native detection services (such as AWS GuardDuty and Microsoft Defender). Use it to triage unresolved alerts, investigate the intent behind suspicious activity, or update alert status as part of your incident response workflow.
Viewing the Threat Explorer
Navigate to Graphion > Cloud Security > Cloud Security Dashboard, scroll to the Infrastructure Explorers widget, and click the Threats tab.
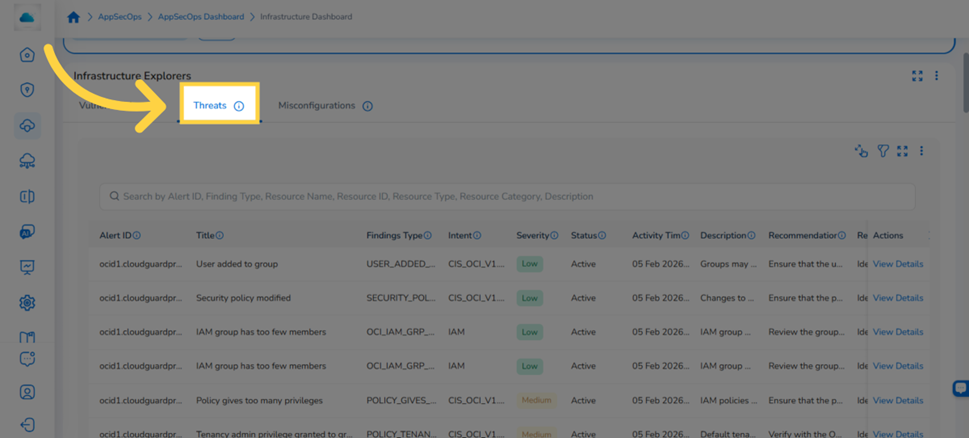
Infrastructure Explorers widget with the Threats tab selected showing the full column set
The table loads sorted by severity descending (critical first) by default. Each row represents a unique threat alert. The table includes the following columns:
Note: The columns displayed in the table may vary based on the user's selection.
| Column | Description |
|---|---|
| Alert ID | Unique identifier for the threat alert generated by the detection system. |
| Title | Short title describing the detected threat activity. |
| Findings Type | Category of the finding (e.g., Threat detection alert). |
| Intent | Indicates the suspected attacker intent (e.g., reconnaissance, credential access, data exfiltration). |
| Severity | Risk level assigned to the threat based on potential impact and confidence. |
| Status | Current status of the alert (e.g., Open, Acknowledged, Resolved) |
| Activity Time | Timestamp when the suspicious activity occurred or was observed. |
| Description | Details about the detected activity and why it was flagged as a potential threat |
| Recommendation | Recommended response actions to investigate or mitigate the threat. |
| Resource Category | High-level category of the affected resource (e.g. Compute, Identity). |
| Resource Type | Specific type of cloud resource associated with the threat activity. |
| Resource ID | Unique identifier of the affected cloud resource. |
| Resource Name | Name of the resource involved in the detected activity |
| Resource | Combined resource identifier or display name used for quick reference. |
| Resource Group | Logical grouping of related resources within the cloud environment. |
| Cloud Account | Cloud account where the threat activity occurred. |
| Region / Location | Cloud region where the affected resource is located. |
| Actions | Per-row actions, including View Details. |
Viewing Threat Details
-
Locate the threat alert you want to investigate in the table.
-
Click View Details in the Actions column for that row. The threat detail view opens with two tabs: Threat Details and Threat Details – JSON.
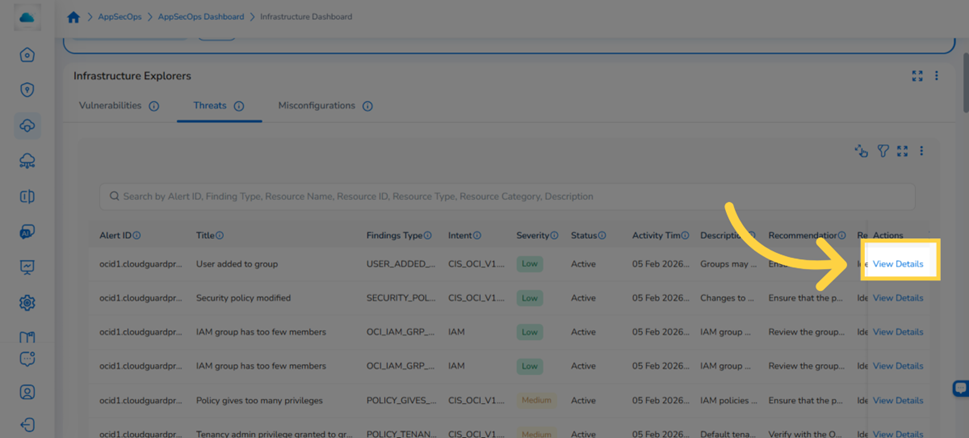
Threats tab with the View Details link highlighted in the Actions column for a specific alert
- The Threat Details tab is selected by default. Review the alert details displayed in the various fields, including title, severity, status, intent, activity time, source, and affected resource information.
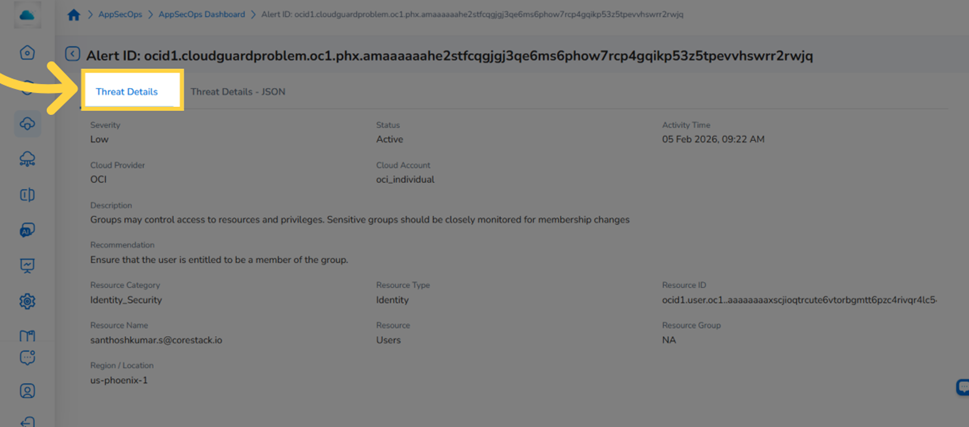
Threat Details tab showing alert fields including severity, status, intent, and resource information
- Click the Threat Details – JSON tab to view the raw JSON payload from the detection source. You can download the JSON file from this tab.
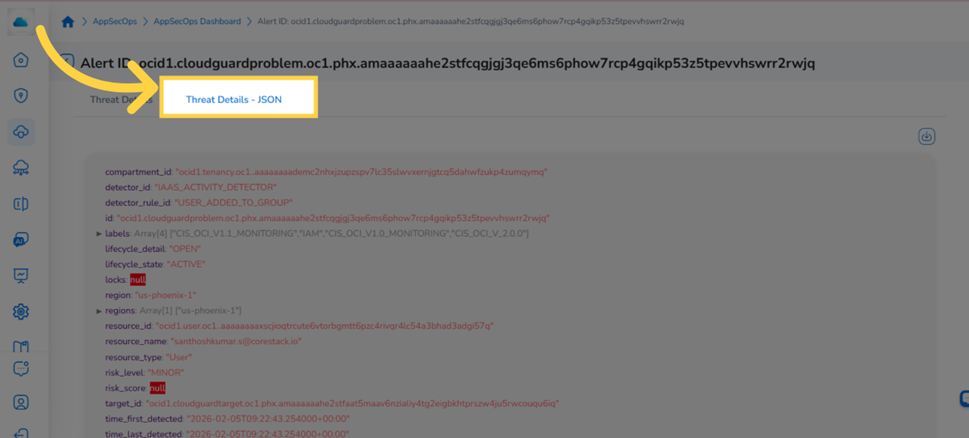
Threat Details - JSON tab showing the raw alert JSON with a download option
- Click the back arrow to return to the Threats tab.
Searching and Filtering Threats
Use the Search box to search by Alert ID, Finding ID, Resource ID, or Resource Name. To filter by status, severity, or other attributes:
-
Click the Filter icon in the widget header. The filter panel expands.
-
Click ADD+ and select a filter attribute. Supported attributes include Severity, Status, Cloud Provider, Cloud Account, Region, Resource Category, Resource Type, and Resource.
-
Select one or more values from the value drop-down and click Ok. The table updates immediately.
Exporting Threat Data
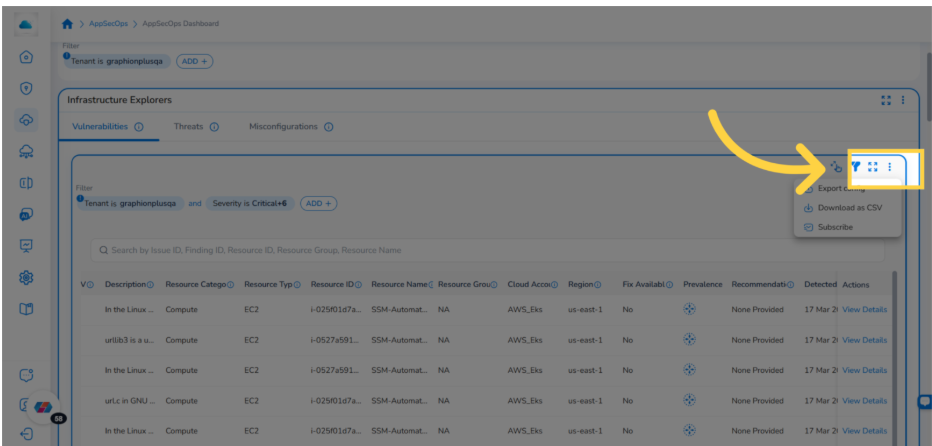
- Click the ellipses ⋮ icon in the top-right corner of the Infrastructure Explorers widget header to open the widget options menu.
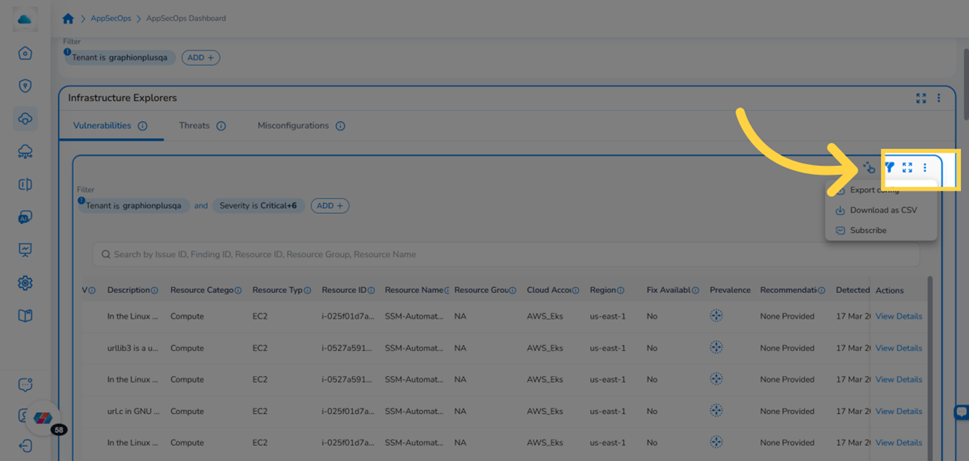
Infrastructure Explorers widget header with the ⋮ options icon and open action menu
- Select Download from the menu.
- Choose CSV or XLSX as the export format. The file downloads to your local machine. Export supports up to 50,000 rows.
Misconfiguration Explorer
The Misconfiguration Explorer tab surfaces policy violations and configuration drift identified across your connected cloud accounts. Each row represents a specific policy breached on a specific resource. Use it to identify non-compliant resources, prioritise fixes by severity, or take remediation actions such as suppressing or auto-fixing findings.
Viewing the Misconfiguration Explorer
Navigate to Graphion > Cloud Security > Cloud Security Dashboard, scroll to the Infrastructure Explorers widget, and click the Misconfigurations tab.
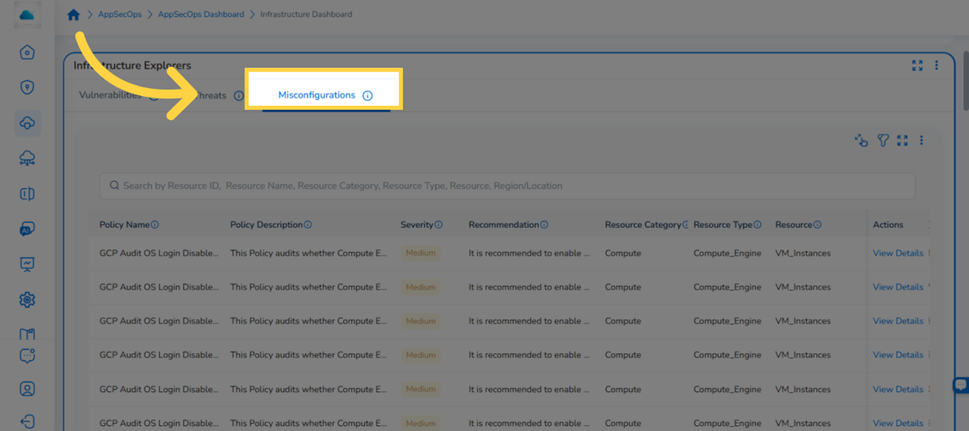
Infrastructure Explorers widget with the Misconfigurations tab selected showing policy name, severity, and resource columns
The table loads sorted by Severity descending by default. Each row represents a unique misconfiguration finding. The table includes the following columns:
Note: The columns displayed in the table may vary based on the user's selection.
| Column | Description |
|---|---|
| Policy Name | Name of the security policy or rule used to detect the configuration issue. |
| Policy Description | Description of the policy and the configuration requirement it enforces. |
| Severity | Risk level assigned to the misconfiguration based on the potential security impact. |
| Recommendation | Recommended remediation steps to correct the misconfiguration. |
| Resource Category | High-level category of the affected resource (e.g. Compute, Storage, Network). |
| Resource Type | Specific type of cloud resource where the policy violation was detected. |
| Resource | Display name or identifier of the affected resource. |
| Resource ID | Unique cloud provider identifier for the resource. |
| Resource Name | User-defined name assigned to the resource. |
| Cloud Provider | Cloud platform where the resource is deployed (AWS, Azure, GCP). |
| Cloud Account | Cloud account containing the affected resource. |
| Region / Location | Cloud region where the resource resides. |
| Resource Group | Logical grouping used to organize resources within the cloud environment. |
| Source | Origin of the policy or the detection rule (e.g., built-in policy, external framework, or custom rule). |
| Actions | Per-row actions, including View Details. |
Searching and Filtering Misconfigurations
Use the Search box to search by Resource ID or Resource Name. To narrow results by policy attributes, severity, or cloud scope, use the filter panel:
-
Click the Filter icon in the widget header.
-
Click ADD+ and select a filter attribute. Supported attributes include Severity, Cloud Provider, Cloud Account, Region, Source, Resource Category, Resource Type, and Resource.
-
Select one or more values and click Ok. The table updates immediately.
Viewing Misconfiguration Details
-
Locate the misconfiguration finding you want to investigate.
-
Click View Details in the Actions column for that row. The misconfiguration detail view opens.
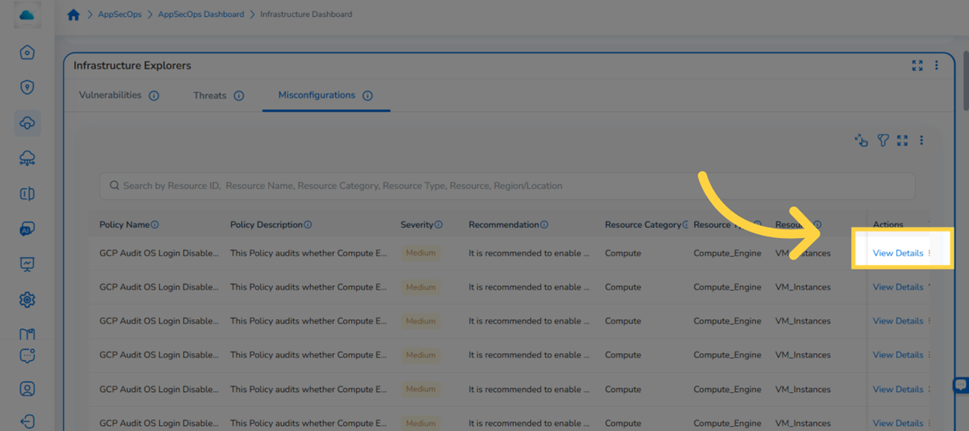
Misconfigurations tab with the View Details link highlighted in the Actions column
- Review the detail view. It shows the policy violation information in different fields, including Policy Name, Policy Description, Severity, Source, Recommendation, and the affected resource details.
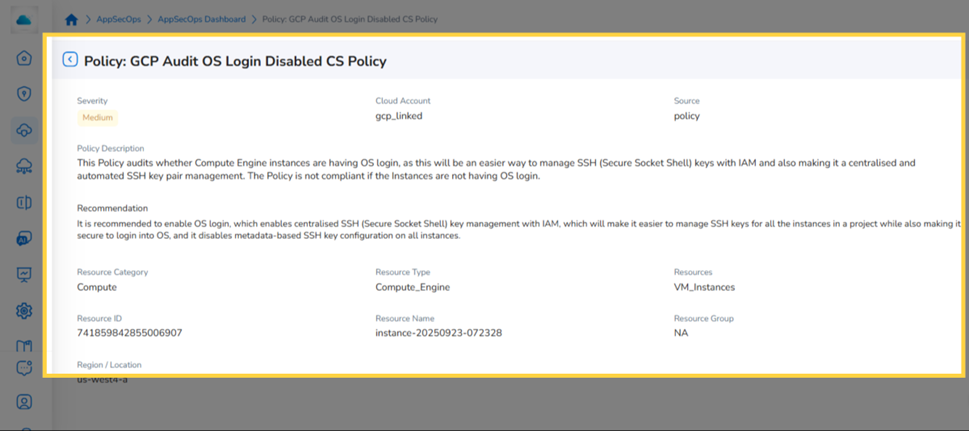
Misconfiguration detail view showing policy information, severity, source, recommendation, and affected resource fields
- Click the back arrow to return to the Misconfigurations table.
Shared Widget Features
Widget Options Menu
Click the ⋮ icon in the top-right corner of the Infrastructure Explorers widget header to access widget-level actions. Available options include downloading the current tab's data, refreshing the widget, and other widget controls.
Infrastructure Explorers widget header with the ⋮ options menu open showing available actions
Pagination
Each explorer tab displays up to 100 records per page. Use the pagination controls at the bottom of the table to move between pages. The total record count is shown above the table.
Column Sorting
Click a sortable column header to sort the table in ascending or descending order. Click the same header again to reverse the sort direction. The active sort column is indicated by an arrow icon in the header.
Note: Not all columns support sorting. Only columns with an arrow icon in the header can be sorted.
Frequently Asked Questions
Q: A finding I know exists is not appearing in the explorer. Where is it?
Security data reflects the most recent ingestion cycle, not a live stream. Navigate to Graphion > Settings to check the last successful scan timestamp. If the data is more than 24 hours old, contact your CoreStack administrator to trigger a manual resync.
Q: Can I export the data from any of the explorer tabs?
Yes. Click the ⋮ icon in the widget header, select Download, and choose CSV or XLSX. Exports are available from all three tabs and support up to 50,000 rows.
Q: Why is my search not returning the results I expect?
Each tab's search operates on a fixed set of columns. Supported search columns are:
- Vulnerabilities: Issue ID, Finding ID, Resource ID, Resource Group, Resource Name
- Threats: Alert ID, Finding Type, Resource ID, Resource Name, ResourceType, Resource Category, Description
- Misconfigurations: Resource ID, Resource Name, Resource Category, Resource Type, Resource, Region/Location
Q: Can I select multiple values for a single filter (e.g. Critical AND High severity)?
Yes. When you add a filter condition and open the value drop-down, select multiple values simultaneously, then click Ok. The table returns records matching any of the selected values.
Q: Some rows in the Vulnerability Explorer have no EPSS value. Is this an error?
No. EPSS data may not be available for all CVEs, particularly older or less-tracked vulnerabilities. When EPSS is unavailable, the column is left empty. The CVSS score is always populated if the vulnerability has an NVD entry.
Q: Why do some vulnerabilities show "NA" for the Issue ID or have no CVE assigned?
Not all infrastructure vulnerabilities are assigned a CVE (Common Vulnerabilities and Exposures) ID. The CVE system was originally designed for software installed and managed on-premises by the customer. Cloud provider findings — such as network reachability issues, IAM misconfigurations, and service-level exposures detected by tools like AWS Inspector — are identified and remediated directly by the cloud provider, meaning the customer has no software to patch. Because of this, the CVE inclusion rules do not apply, and no CVE ID is issued. These findings are still actionable and should be triaged based on their severity and risk score.
Troubleshooting
The Infrastructure Explorers widget is not visible on the Infrastructure Dashboard
Cause: The appropriate bundle may not be enabled, or your account does not have a Graphion role assigned.
Solution:
- Navigate to Graphion > Settings and confirm that at least one cloud account is connected with a completed scan.
- Ask your Tenant Admin to confirm the appropriate bundle is active for your organization.
- Ask your Tenant Admin to confirm you have the appropriate roles and permissions assigned.
- Log out and back in to refresh your session permissions.
If the widget is still not visible, contact CoreStack support with your tenant ID, user email, and the bundle name shown in your account settings.
The explorer table shows no data after applying a filter
Cause: The active filter conditions may match no ingested records, or a selected cloud account has no completed scan.
Solution:
- Open the filter panel and review which conditions are active.
- Remove all custom filters and confirm whether the unfiltered table shows data.
- If the unfiltered table has data, re-apply filters one at a time to identify which condition produces the empty result.
- If the unfiltered table is also empty, navigate to Graphion > Settings and confirm your connected accounts have completed a recent scan.
If the problem persists, contact CoreStack support with your tenant ID, cloud account names, and the date of the last successful scan.
CVE detail information is incomplete or missing fields
Cause: EPSS, Exploitability Metrics, and Impact Metrics are sourced from external databases. If a CVE has no external data, those fields will be blank.
Solution:
- Wait for the next scheduled ingestion cycle. If the data is still blank after the cycle, raise a support ticket with the CVE IDs and your tenant ID.
- If the missing field is Severity and the CVE is newly published, NVD may not yet have assigned a CVSS score. This is expected for CVEs in the analysis queue.
If the problem affects multiple CVEs, contact CoreStack support with the CVE IDs and your tenant ID.
Updated about 1 month ago