
Infrastructure Dashboard
This user guide helps the users learn how to access and navigate the CoreStack AppSecOps Infrastructure Dashboard — a unified view of your cloud security posture across vulnerabilities, threats, and misconfigurations.
Feature Overview
The Infrastructure Dashboard is a centralized security visibility hub within CoreStack's AppSecOps module that consolidates seven widgets covering security findings, resource inventory, issue trends, and geographic risk distribution across all connected cloud accounts. It is most relevant when a security team needs a high-level view of current exposure, wants to identify the most at-risk accounts or regions, or needs to navigate quickly from a summary chart into a filtered findings list for triage.
This dashboard is most valuable to AppSecOps Admins who manage active remediation and to AppSecOps Readers who monitor security posture across the organization. It is not a compliance audit report and does not replace dedicated compliance or governance dashboards — it is an operational view of the current security findings state.
Note: The Infrastructure Dashboard is only available when your organization has the appropriate bundles enabled and your account has been assigned the appropriate roles and permissions. If the dashboard does not appear in the drop-down selector, contact your Tenant Admin to confirm bundle activation and role assignment.
How It Works
CoreStack ingests security findings from connected cloud accounts on a scheduled basis and enriches them with severity scores, policy metadata, and resource context.
The Infrastructure Dashboard consolidates these findings into seven widgets, each offering a distinct analytical view — such as trends, severity breakdowns, resource distribution, geographic spread, and a detailed findings table.
A global filter bar applies across all widgets, allowing users to scope data by tenant or cloud provider and instantly refresh all visualizations. Many widgets are interactive, enabling users to click on chart elements to navigate directly to a filtered findings view for deeper analysis.
All data reflects the most recent scheduled ingestion cycle and is not real-time.
Prerequisites
Before you begin, ensure the following:
- Roles and Permissions: You have the necessary roles and permissions assigned in assigned in CoreStack under the appropriate bundles.
- Cloud Accounts: At least one cloud account (AWS, Azure, GCP, or OCI) has been onboarded and scanned in CoreStack. Security issues appear only after at least one completed scan.
- Access: You can navigate to AppSecOps > Dashboard > Infrastructure Dashboard using the CoreStack left navigation sidebar.
Accessing the Infrastructure Dashboard
To open the Infrastructure Dashboard, navigate to AppSecOps > Dashboard > Infrastructure Dashboard using the steps below.
Step 1: Open AppSecOps
Click AppSecOps in the CoreStack left navigation panel. The AppSecOps module opens.
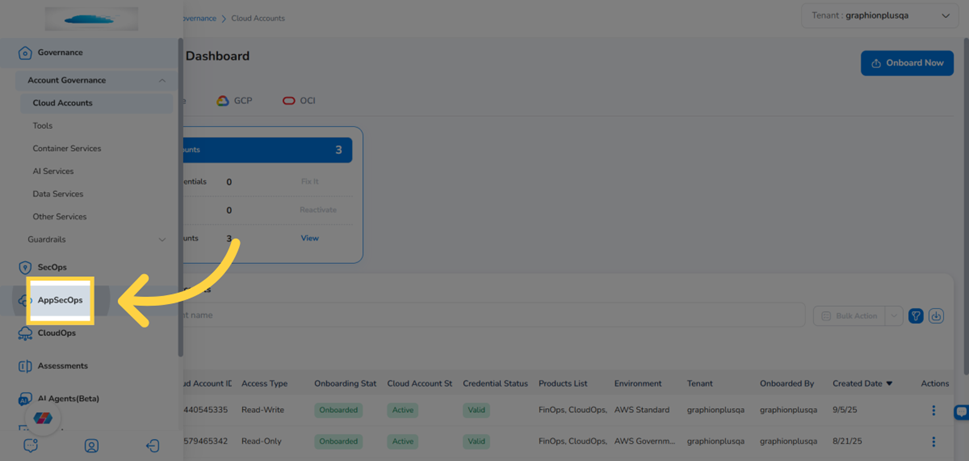
CoreStack left navigation panel with the AppSecOps module item highlighted
Step 2: Click Dashboard
In the AppSecOps menu, click Dashboard. The dashboard area opens, defaulting to the last dashboard you viewed.
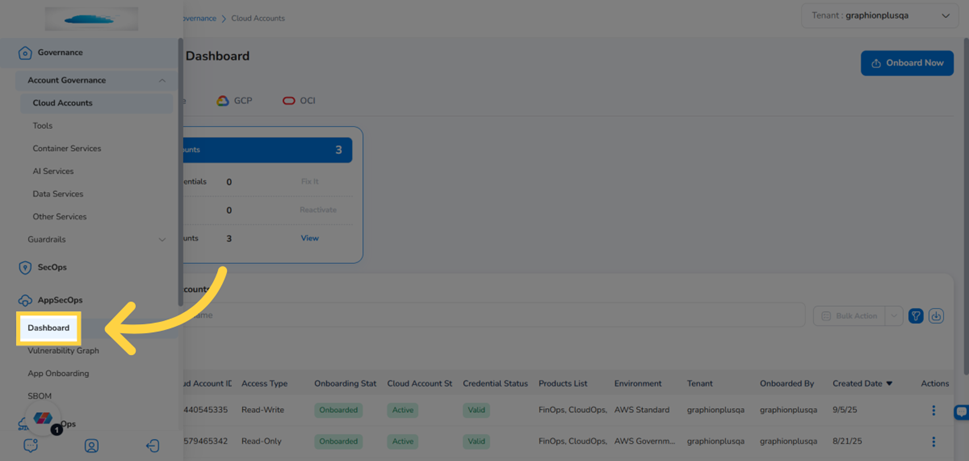
AppSecOps navigation showing the Dashboard menu item highlighted
Step 3: Open the dashboard selector
In the dashboard header bar, click the drop-down arrow next to the current dashboard name. The list of available dashboards appears.
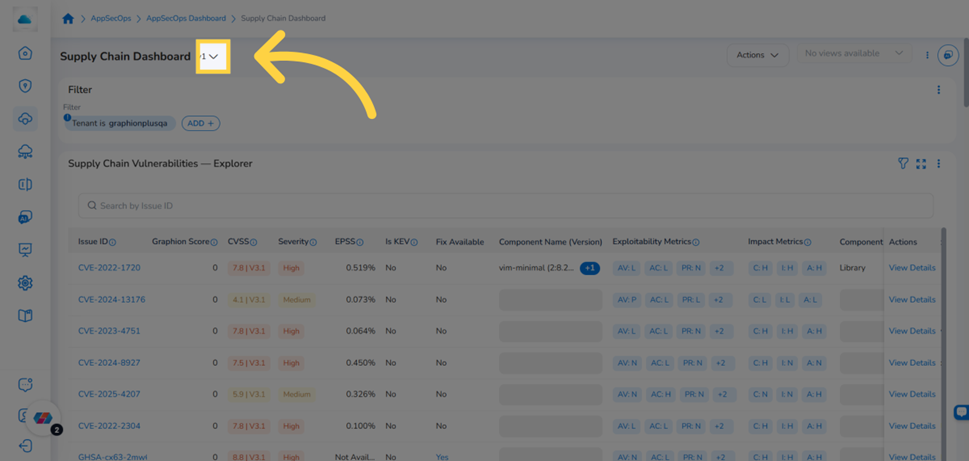
Dashboard header bar with the drop-down arrow highlighted showing the selector is interactive
Step 4: Select Infrastructure Dashboard
From the drop-down list, click Infrastructure Dashboard. The page loads and displays all seven widgets.
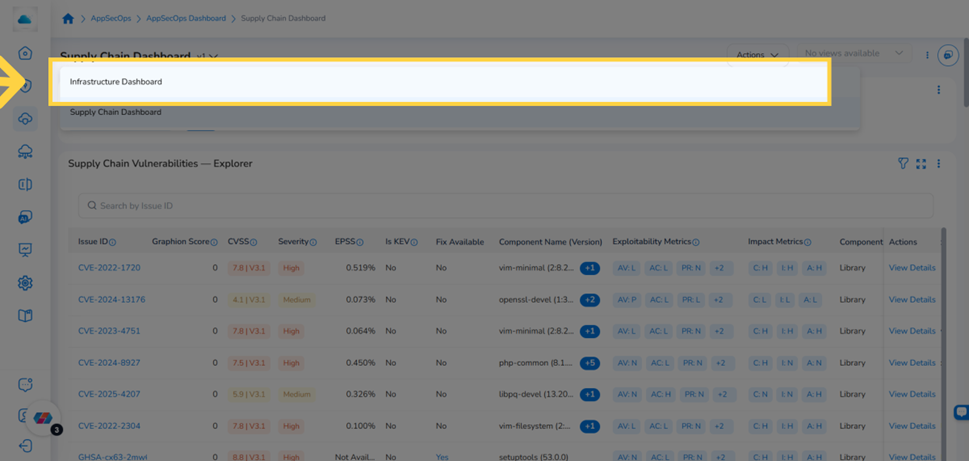
Drop-down list with Infrastructure Dashboard selected and the full loaded dashboard visible
Understanding the Dashboard Layout
The Infrastructure Dashboard contains seven widgets. Each presents a distinct view of your cloud infrastructure's security state. The table below describes what each widget shows. Detailed guidance for each widget is available in the linked sub-sections.
| Widget | What It Shows |
|---|---|
| Infrastructure Explorers | A multi-tab findings table for investigating individual vulnerabilities, threats, and misconfigurations. Supports search, filter, sort, and — for Admins — remediation actions. |
| Open Infrastructure Issues – Trend | A line chart tracking the count of open vulnerabilities, threats, and misconfigurations over time, showing whether the overall security posture is improving or worsening. |
| Infrastructure Issues – By Severity & Account | A breakdown of open issues by severity level across each connected cloud account, making it easy to identify which accounts carry the highest risk. |
| Infrastructure Resources – By Resource Category | A view of how cloud resources are distributed across categories such as Compute, Storage, Network, and Identity, scoped to the monitored estate. |
| Infrastructure Resources – Inventory Overview | A summary count of total monitored resources, broken down by cloud provider and category. |
| Infrastructure Resources & Issues – Flow | A flow diagram linking resource categories to their associated open issues, highlighting which resource types are generating the most findings. |
| Infrastructure Issues – By Region | A geographic or tabular view of open issues grouped by cloud region, helping teams identify whether specific regions carry elevated risk. |
Using the Global Filters
The global filter bar at the top of the Infrastructure Dashboard applies to all seven widgets simultaneously. It includes a Tenant selector and supports custom attribute filters such as Provider. Changing either filter instantly refreshes the entire dashboard to show data for the selected scope.
Switching the Tenant view
Click the current tenant name in the global filter bar and select a tenant from the list. All widgets refresh to display data for the selected tenant..
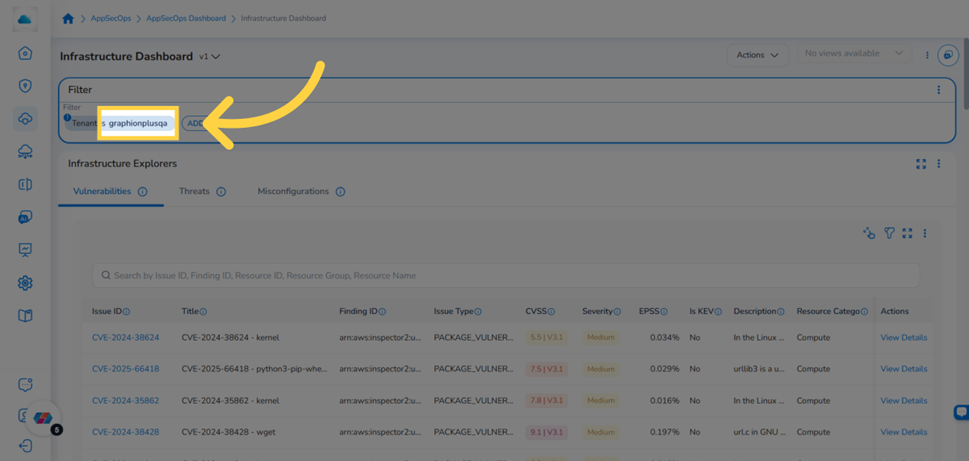
Infrastructure Dashboard global filter bar with the Tenant selector highlighted and the tenant list expanded
Adding a custom filter
- In the global filter bar, click ADD+. The filter attribute drop-down appears.
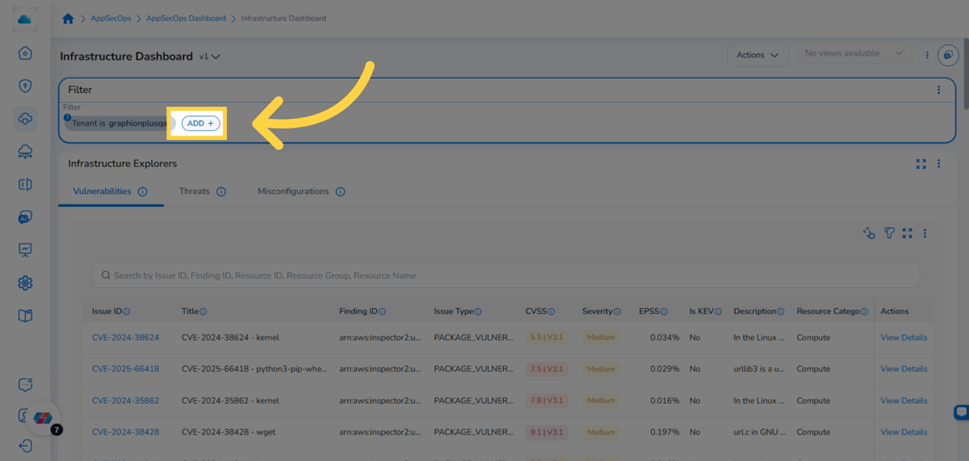
Global filter bar with the ADD+ button highlighted to add a new filter condition
- Select a filter attribute from the drop-down — for example, Provider to scope the dashboard to a specific cloud provider.
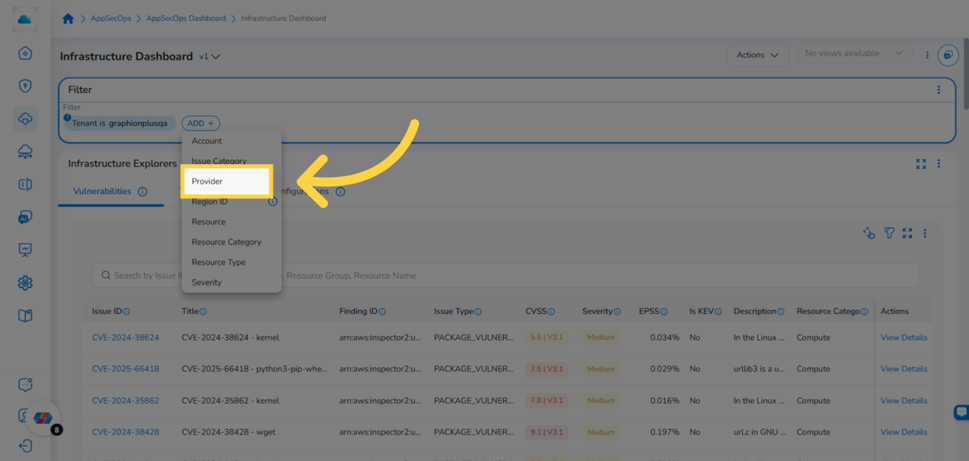
Filter attribute drop-down with Provider selected as the filter type
- Click the value drop-down for the selected attribute and choose one or more values from the list.
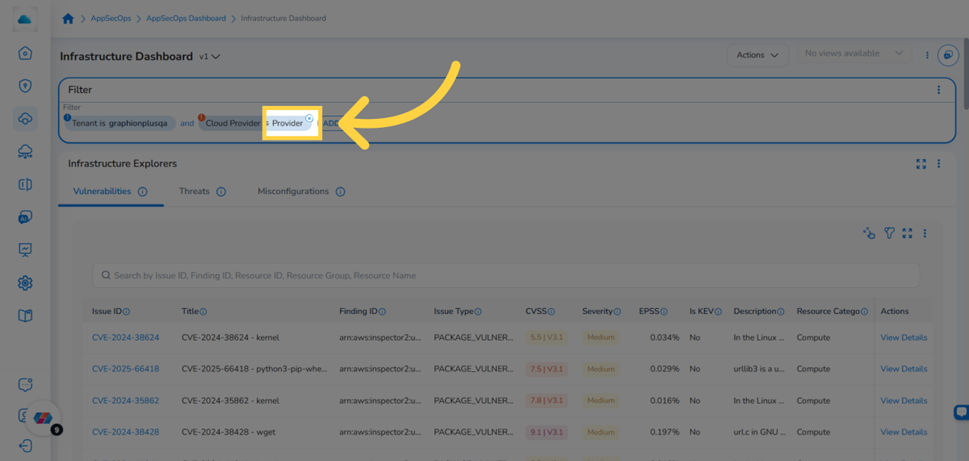
Provider filter value drop-down expanded showing cloud provider options to select
- Click Ok. All widgets update immediately to reflect the filtered scope.
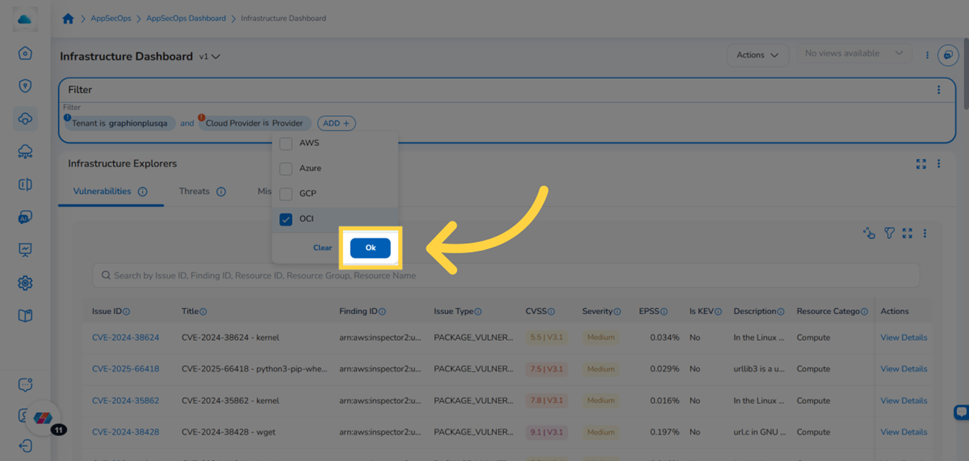
Global filter bar with the Ok button highlighted to confirm the filter selection
To remove a custom filter, click the × next to it in the filter bar. The Tenant selector remains active and must be changed separately.
Frequently Asked Questions
Q: The Infrastructure Dashboard doesn't appear in my drop-down list. What should I check first?
The Infrastructure Dashboard is only available to users with the AppSecOps Reader or AppSecOps Admin role in a tenant that has the Graphion or Graphion+ bundle enabled. Ask your Tenant Admin to confirm both conditions. After your role is assigned or the bundle is activated, log out and back in to refresh your session, then return to AppSecOps > Dashboard and open the drop-down selector.
Q: The global filter is set to a specific provider, but some widgets still show data from other providers. Why?
If a widget appears to be ignoring the global filter, it may be rendering cached data. Refresh the page to force all widgets to re-evaluate the active filter. If the discrepancy persists after a refresh, contact CoreStack support with your tenant ID and the widget name.
Q: How current is the data shown on the dashboard?
The Infrastructure Dashboard reflects the most recent scheduled security ingestion cycle — it is not a live stream. To check when data was last refreshed for each connected account, navigate to AppSecOps > Settings and review the last scan timestamp per account.
Q: I clicked a chart segment to drill into findings, but the explorer tab opened with no data. Why?
Clicking a chart segment pre-applies a filter to the findings tab. If that filter matches no ingested records — for example, a severity level with no current findings for the selected account — the table will be empty. Open the filter panel in the widget and check which filter was pre-applied. Remove it to confirm whether unfiltered data is present.
Q: Can I view data from multiple tenants on the same dashboard view?
No. The Infrastructure Dashboard is scoped to one tenant at a time via the global Tenant selector. To compare data across tenants, switch the Tenant filter and note the key metrics for each individually. Cross-tenant consolidated views are not available on this dashboard.
Troubleshooting
Infrastructure Dashboard does not appear in the drop-down selector.
Cause: The Graphion or Graphion+ bundle is not enabled for the tenant, or the user account does not have an AppSecOps role assigned.
Solution:
- Ask your Tenant Admin to confirm that the appropriate bundle is active for your organization.
- Ask your Tenant Admin to confirm your account has been assigned the appropriate roles and permissions.
- Log out of CoreStack and log back in to refresh your session permissions.
- Navigate to AppSecOps > Dashboard and open the drop-down selector again.
If the dashboard is still not listed, contact CoreStack support with your tenant ID, your user email address, and the bundle name shown in your account settings.
All widgets on the dashboard show empty data.
Cause: No connected cloud accounts have completed a successful security scan, or the active global filter is scoped to a provider or account with no ingested findings.
Solution:
- Check the global filter bar. If a custom filter is active, remove it and confirm whether data appears in the unfiltered view.
- If the unfiltered view is also empty, navigate to AppSecOps > Settings and confirm that at least one cloud account is connected and shows a completed scan with a recent timestamp.
- If a scan was completed recently but no data is visible, log out and back in, then return to the dashboard.
If widgets remain empty after confirming a completed scan and removing all custom filters, contact CoreStack support with your tenant ID, the names of the cloud accounts you expected data from, and the timestamp of the last successful scan.
Updated about 2 months ago