

FinOps Posture
Introduction
Having clear visibility and a solid understanding of the cloud spend across all your cloud accounts is crucial. By using cost analysis, you can better plan for optimization and cost savings. FinOps Posture in the platform provides visibility into overall cloud costs across all your cloud accounts.
FinOps posture information is available through Cost Posture dashboards, which are made available through the FinOps Dashboard page.
Accessing the Cost Posture Dashboards
The Cost Posture dashboard option shows the consolidated spend by cloud and overall spend of each cloud provider. Two specific views are available for this dashboard:
- Cost Posture (Account and Tenant View) - This version of the dashboard only allows Account and Tenant View, but not across multiple accounts.
- Cost Posture (Admin View) - This version of the dashboard is designed for Account Admins, and provides a view of various account type hierarchies to get a better view across multiple accounts and customers.
To access the Cost Posture dashboard options, navigate to FinOps > Dashboard, then select wither option from the dashboard drop-down menu.
Note:To ensure that the platform is able to define and fetch the budgets available in your native cloud services, it’s required for the platform to have access to those cloud services. That means this feature may not be available for accounts onboarded with Read-Only access enabled.
Cost Posture (Legacy) Account/Tenant View Dashboard
This version of the Cost Posture dashboard covers the consolidate cloud spend across a specific Account/Tenant.
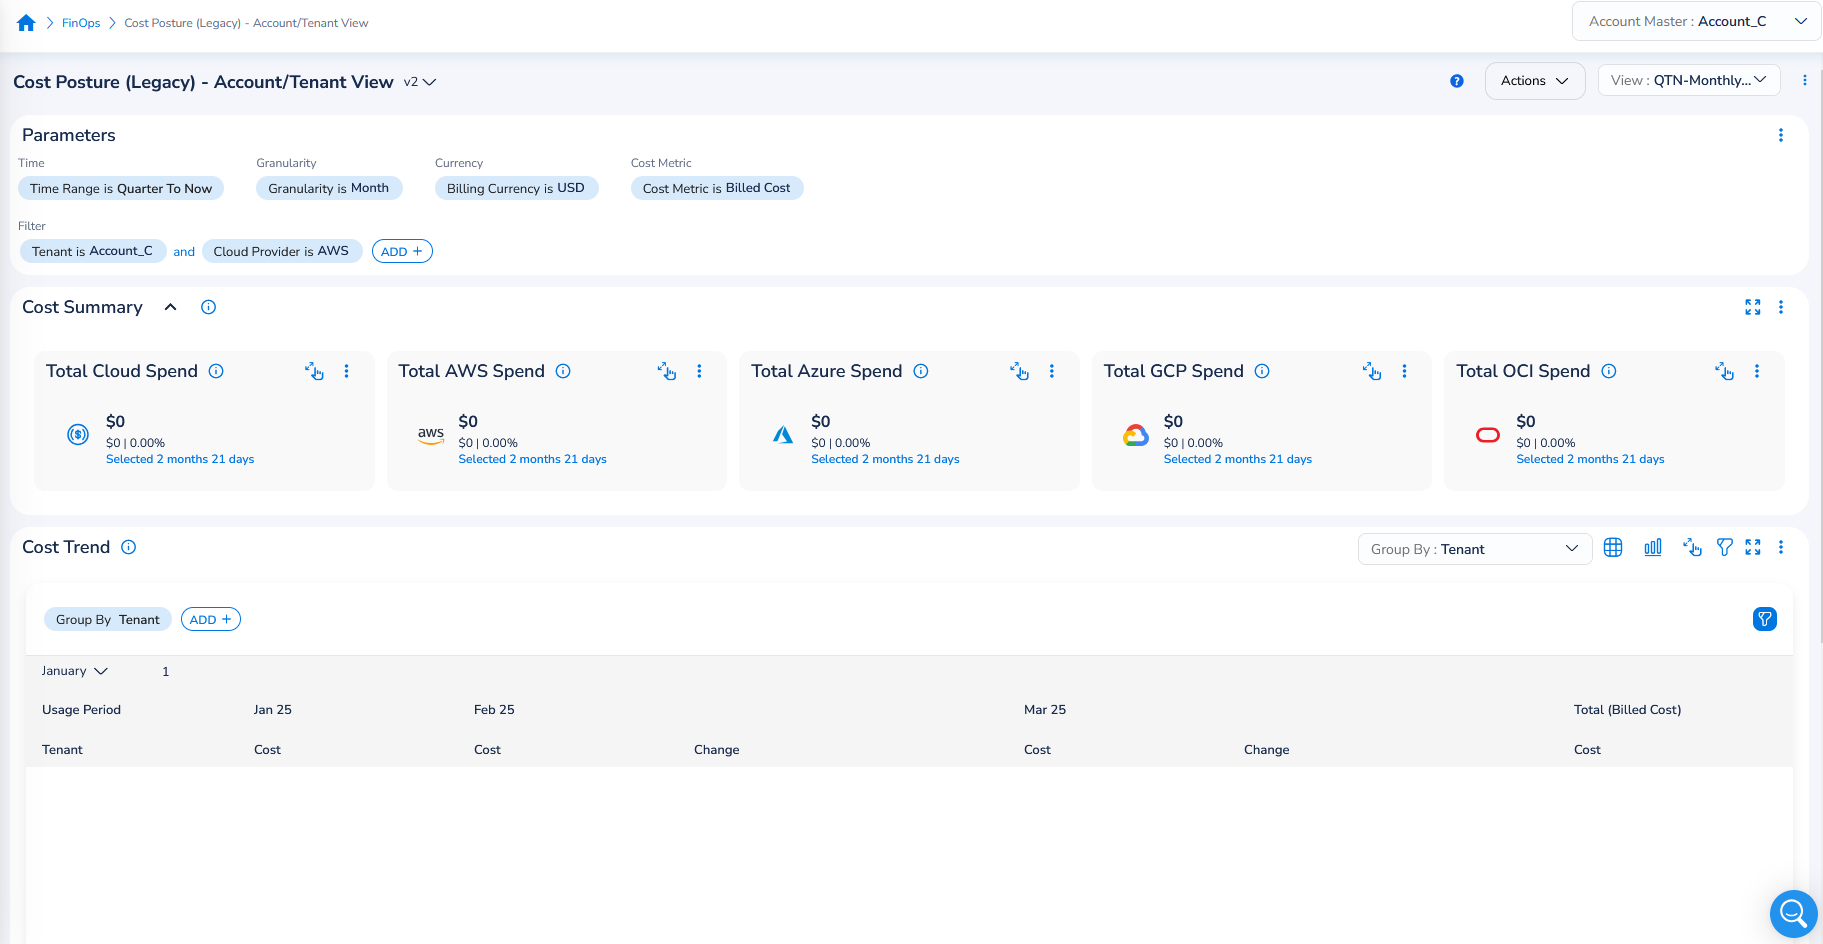
This dashboard is comprised of the following main sections:
- Parameters -- Displays the key parameters used and allows the user to set specific time ranges and filters to customize the dashboard view.
- Cost Summary -- Provides a summary of cloud account costs across the different cloud providers available. You can click to drill-down further into each cloud provider.
- Cost Trend -- Provides the cloud spend by Cloud Provider, Account, or Tenant view, as well as drill-down options across various dimensions. You can also add additional filters and switch between Chart and Table views for the data.
Cost Posture (Legacy) Admin View Dashboard
This version of the Cost Posture dashboard covers the consolidated cloud spend across a various Account/Tenant hierarchies and is designed for Account Admins.
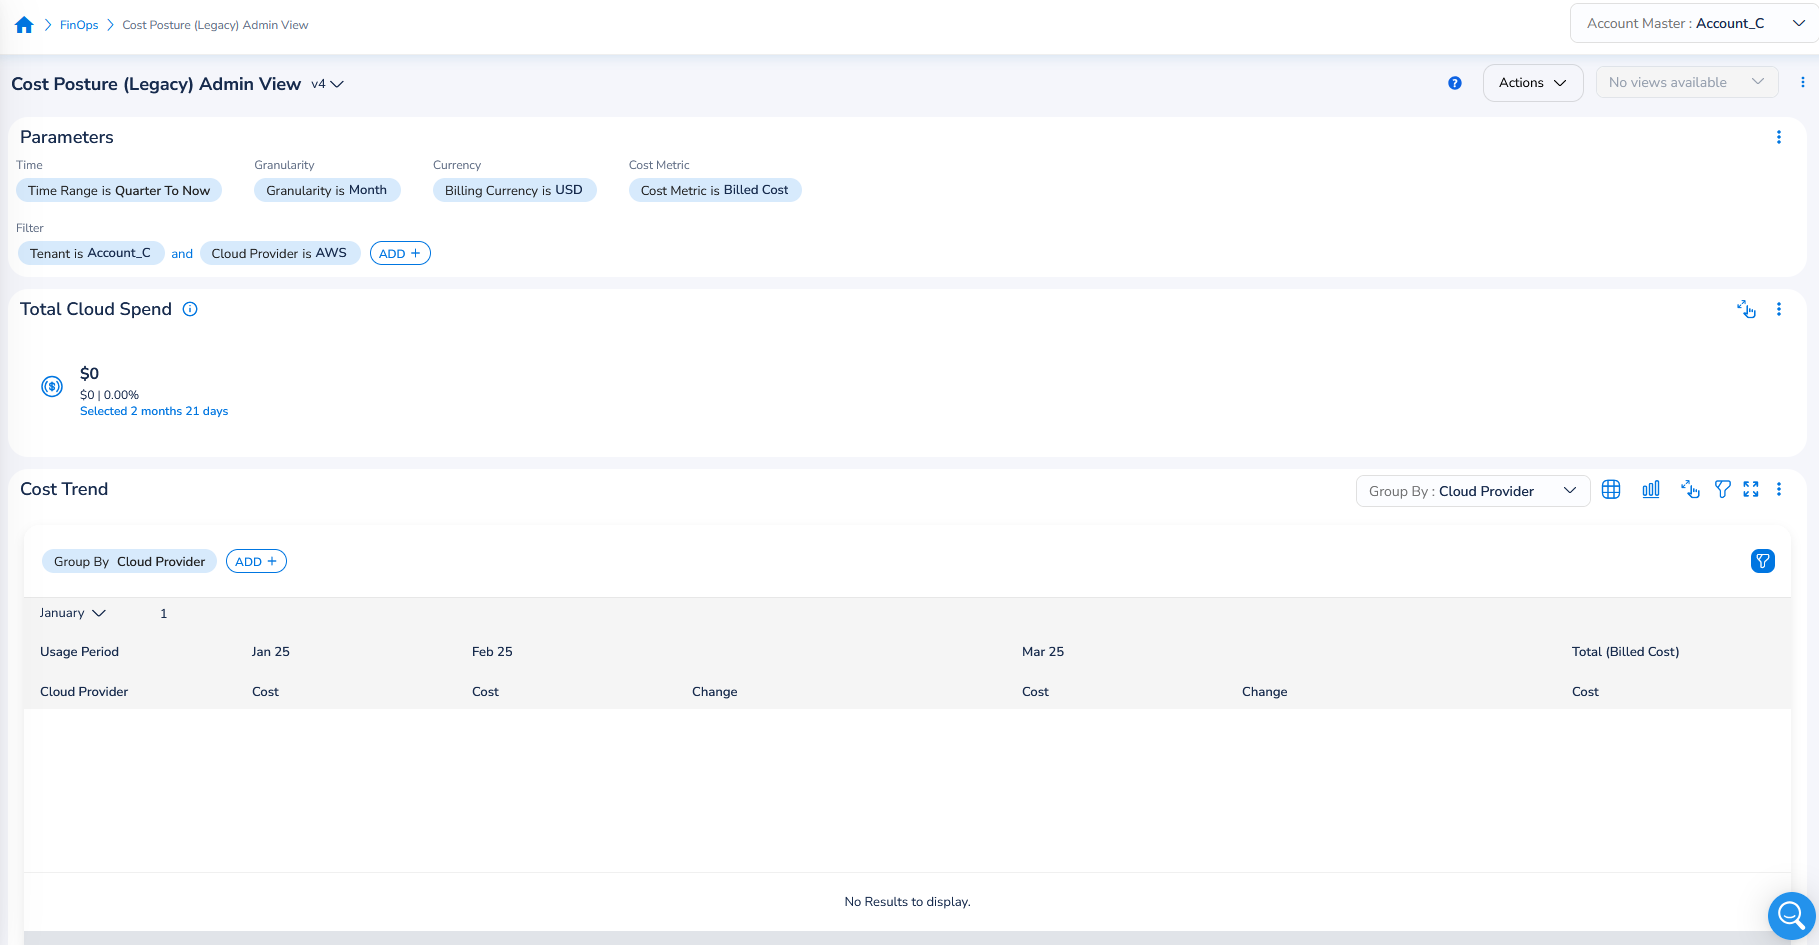
This dashboard is comprised of the following main sections:
- Parameters -- Displays the key parameters used and allows the user to set specific time ranges and filters to customize the dashboard view.
- Total Cloud Spend -- Provides a summary of the total cloud account costs across all cloud account types and cloud providers. Users can click the available summary cards to drill-down further.
- Cost Trend -- Provides the cloud spend by Cloud Provider, Account, or Tenant view, as well as drill-down options across various dimensions. You can also add additional filters and switch between Chart and Table views for the data
Using the Cost Posture Dashboards
Follow the below steps for guidance on how to interact with each of the main sections in these dashboards.
Parameters
The parameters sections provides a summary of the main parameters used to adjust the data values displayed in the Cost Dashboard. It also provides users with a way to add/edit filters and select different time ranges for the data.
This section displays the following parameters:
- Time -- Sets the range of time that the displayed cost data is collected from. (e.g. Previous Month)
- Granularity -- Describes the granularity level for how the time range is being measured (e.g. Month)
- Currency -- Describes the currency type being used for data displayed on the dashboard (e.g. USD).
- Cost Metric -- Describes the cost metric used for the spend data (e.g. Billed Cost).
Change Time Range
To change the Time Range used for the Cost Dashboard, select the Time Range box to open a drop-down menu.
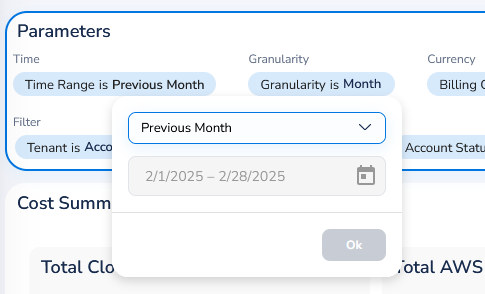
Here, you can select the drop-down menu to view the list of available Time Range options. Once you've selected a time range option, select OK to save your changes.
Add Filters
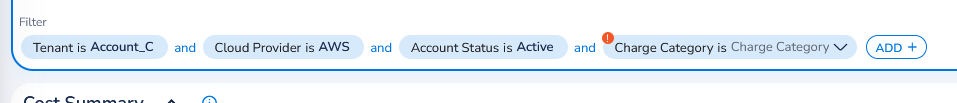
To add a new filter to the dashboard view, select the ADD+ button.
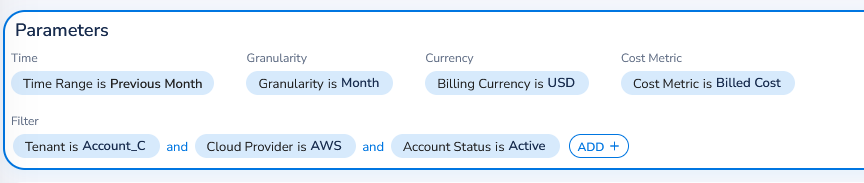
Then, select a filter for the list of available options. Some of the options have tool-tips beside them that can be hovered over to show more information about them.
Once you've selected a filter, you may need to set a value for that filter to. Filters that are missing a set value will be marked with a red warning icon in the top left corner.
To set a value, click on the new filter in the Parameters section to see the list of available option, then select one as per your preferences.
Remove Filters
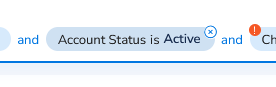
To remove a filter, simply hover over it then select the 'X' icon that appears in the top right corner.
Cost Summary
The Cost Summary section provides a summary of cloud account costs across the different cloud providers available, but only within a specific Account/Tenant. Viewing cloud account costs across all platform Accounts/Tenants is only available in the Admin View version of the Cost Dashboard.
The section displays the total cloud spendfor each cloud provider that you've onboarded cloud accounts for, separated by tile, such as:
- Total Cloud Spend
- Total AWS Spend
- Total Azure Spend
- Total GCP Spend
- Total OCI Spend
Users can click on each of the tiles to drill-down further into each Total Spend option.
Total Cloud Spend
The Total Cloud Spend section provides a summary of cloud account costs across the different cloud providers available, and also across all Accounts/Tenants.
The total cloud spend for all your cloud accounts is displayed on a tile, which can be selected by users drill- down further in the data further.
Cost Trend
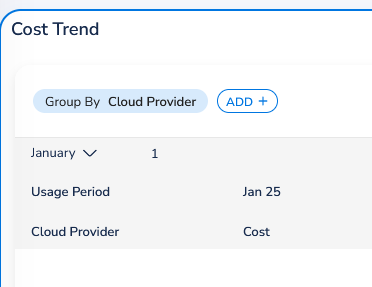
The Cost Trend section displays the cloud spend based on Cloud Provider, Account, or Tenant view, and provides users with tools to drill-down further into the data using Group By and Filter options.
Add a Group By
To add a new Group By, select the ADD+ button then select one of the available options listed. Once selected, the table should update in real time and show the updated results.
You can remove a Group By by hovering over it, then selecting the 'X' icon that appears in the top right.
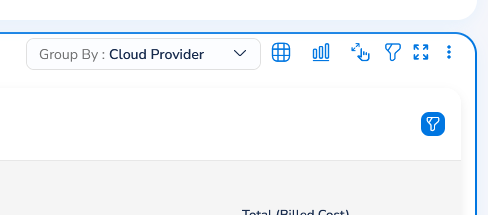
Change Chart Types and Filters
Users can change the way the table data is displayed by using the icons available in the top right of the able to switch between Table View and Chart View.
Too add new filters and/or edit the existing filters used for this table, select the Filters icon. This will display the filters available for the table, and allow users to add new filters or modify the existing ones.
Create a View
To create a new View for either version of the Cost Dashboard, select the three dots in the upper right corner of the page to open the View menu.
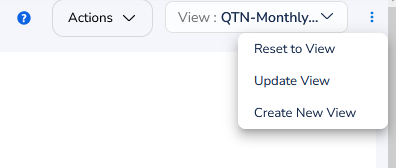
Then, select one of the available options:
- Reset to View -- Choose this to reset the current dashboard view to the default.
- Update View -- Choose this to update the current;y selected view with any changes you've made.
- Create New View -- Choose this to create a new saved view based on the current dashboard configurations.
Once you've created or updated a view, you can select it from the View drop-down menu.
Updated 8 months ago