Anomaly Dashboard
This section guides you to configure the detection of cost anomalies in your cloud account using CoreStack.
Cost Anomaly Detection
The Cost Anomaly feature in CoreStack is used to detect any abnormal costs incurred in a cloud account. Anomalies can be detected if the actual spend is higher than the expected spend. Anomaly trends will be shared with users, who can take preventive actions accordingly.
A cost anomaly is detected through the billing data provided by the cloud provider. Anomalies identified through billing data takes approximately 24 - 48 hours to identify depending on the cloud provider, since there is a wait time involved with billing data being shared by the cloud provider. For a particular resource category, the cost data for at least 15 days is used to detect any cost anomalies. The anomaly algorithm runs on a daily basis, processing up to 60 days of cost data.
Users can view the following section for Cost Anomaly in CoreStack:
- Cost Anomaly (Billing) - Summary
After a cost anomaly is identified, an email notification is sent to the user as per the notification settings updated by them. The user can then take the required remediation steps from their end to manage their costs as per their preferences.
Cost Impact Definition
Below are the definitions for each term you’ll see as part of the Cost Anomaly feature:
- Actual spend: The amount actually spent on a particular resource or service.
- Expected spend: The forecasted cost predicted by an AI service.
- Cost impact: The difference between the actual spend and the expected spend. The platform excludes any deviations that fall within the acceptable range defined by the anomaly detection algorithm's upper and lower limits.
- Sensitivity: The sensitivity parameter is key to tuning the detection results. In general, a high sensitivity value means the model is more sensitive to outliers and is likely to identify more anomalies. A low sensitivity value usually means the model will tolerate minor outliers. The sensitivity number is crucial in deciding the expected spend. This parameter is configurable at tenant level and cloud account levels. Refer to Configuration for Sensitivity to know about the configuration steps.
Refer to the example of logic or calculation given below that is used to detect cost anomalies:
- Actual spend = 1301
- Expected spend = 1200
- Cost Impact = Actual spend - Expected spend = 1301 – 1200 = 101
View Cost Anomaly by Billing
There are different options available to view cost anomalies as per the available billing data. The Cost Anomaly (Billing) – Summary section displays the following graphs and bar charts:
- Cost Impact by Cloud Provider
- Cost Impact by Cloud Account
- Cost Impact by Product Category
- Cost Impact by Resource Category
Perform the following steps in the platform to view cost anomalies:
-
Click Cost > Anomaly Dashboard.
-
In the Tenant list, click to select a tenant.
-
In the Cloud Provider list, click to select the appropriate option(s), and then click Ok.
-
In the Currency list, click to select an appropriate currency.
-
In the Time Range list, click to select the time period for which the cost anomaly needs to be viewed.
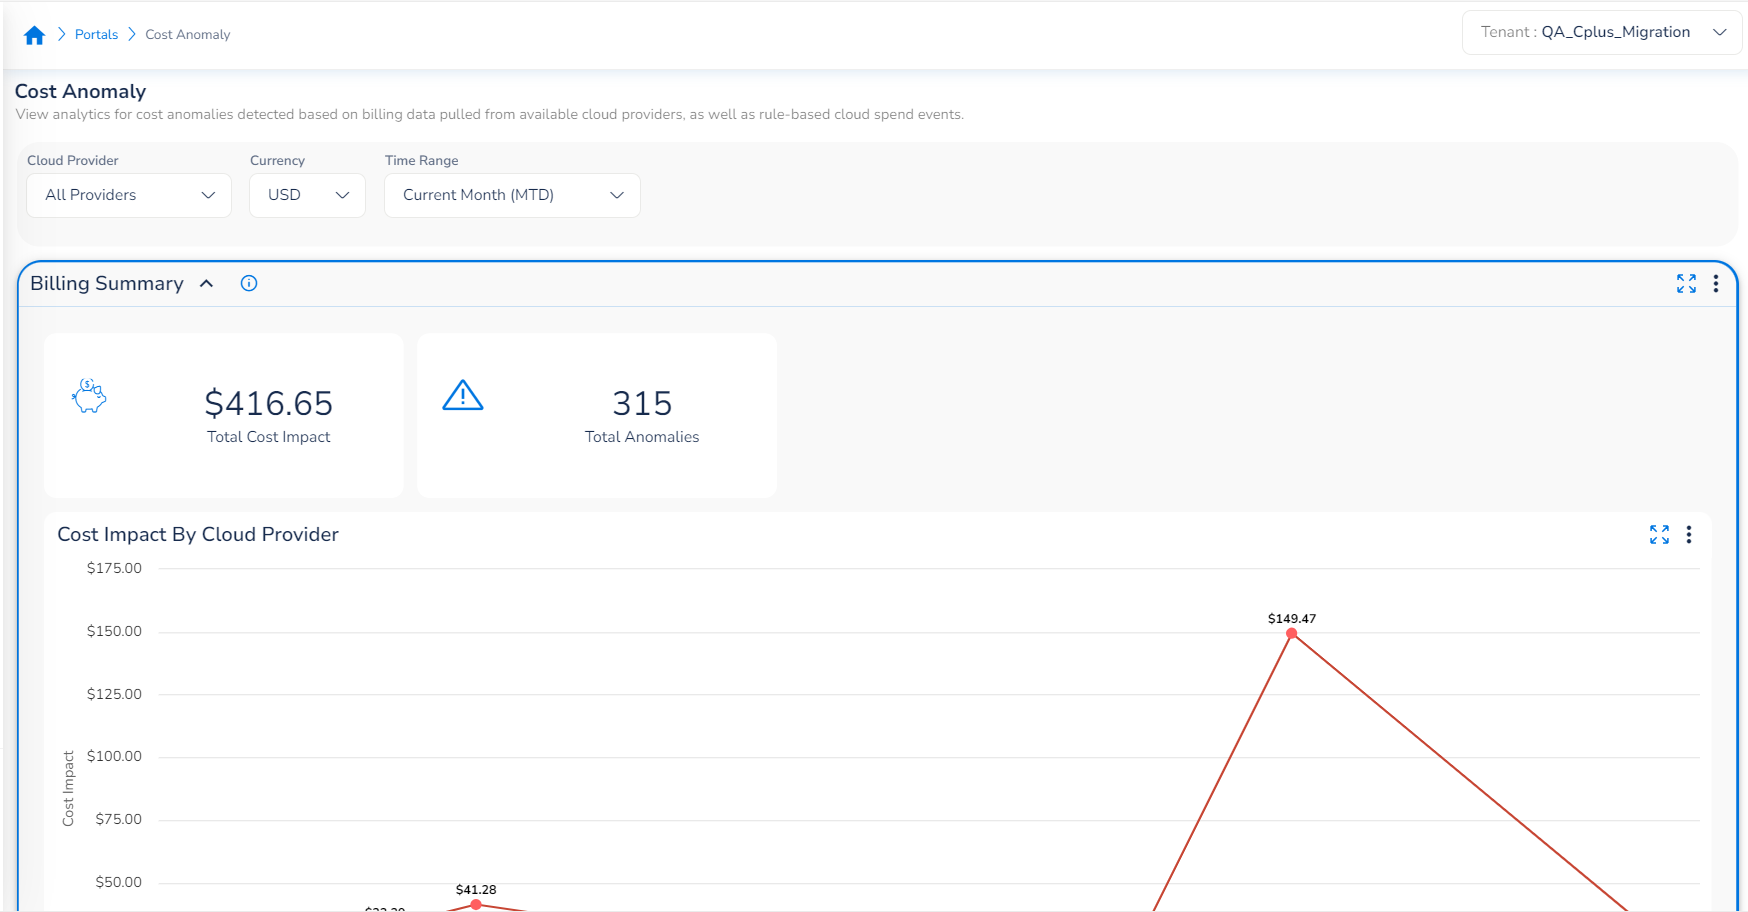
The Total Cost Impact, Total Anomalies, Cost Impact by Cloud Provider, Cost Impact by Cloud Account, Cost Impact by Product Category, and Cost Impact by Resource Category for the selected cloud account will be displayed. These details are based on the billing information provided by the cloud provider.
- Total Cost Impact: This shows the cost impact for multiple anomalies detected within a specific time period, and according to other filters chosen by the user.
- Total Anomalies: This shows the total number of anomalies identified.
- Cost Impact by Cloud Provider: This is a graph that shows the trend of cost impact within a set time period. For example, in the graph shown below, the cost impact trend for the month of June is displayed. Users can also see the cost impact amount for a particular date.
- Cost Impact by Cloud Account: This bar chart shows the cost impact as per different cloud accounts.
- Cost Impact by Product Category: This bar chart shows the cost impact as per different product categories.
- Cost Impact by Resource Category: This bar chart shows the cost impact as per different resource categories.
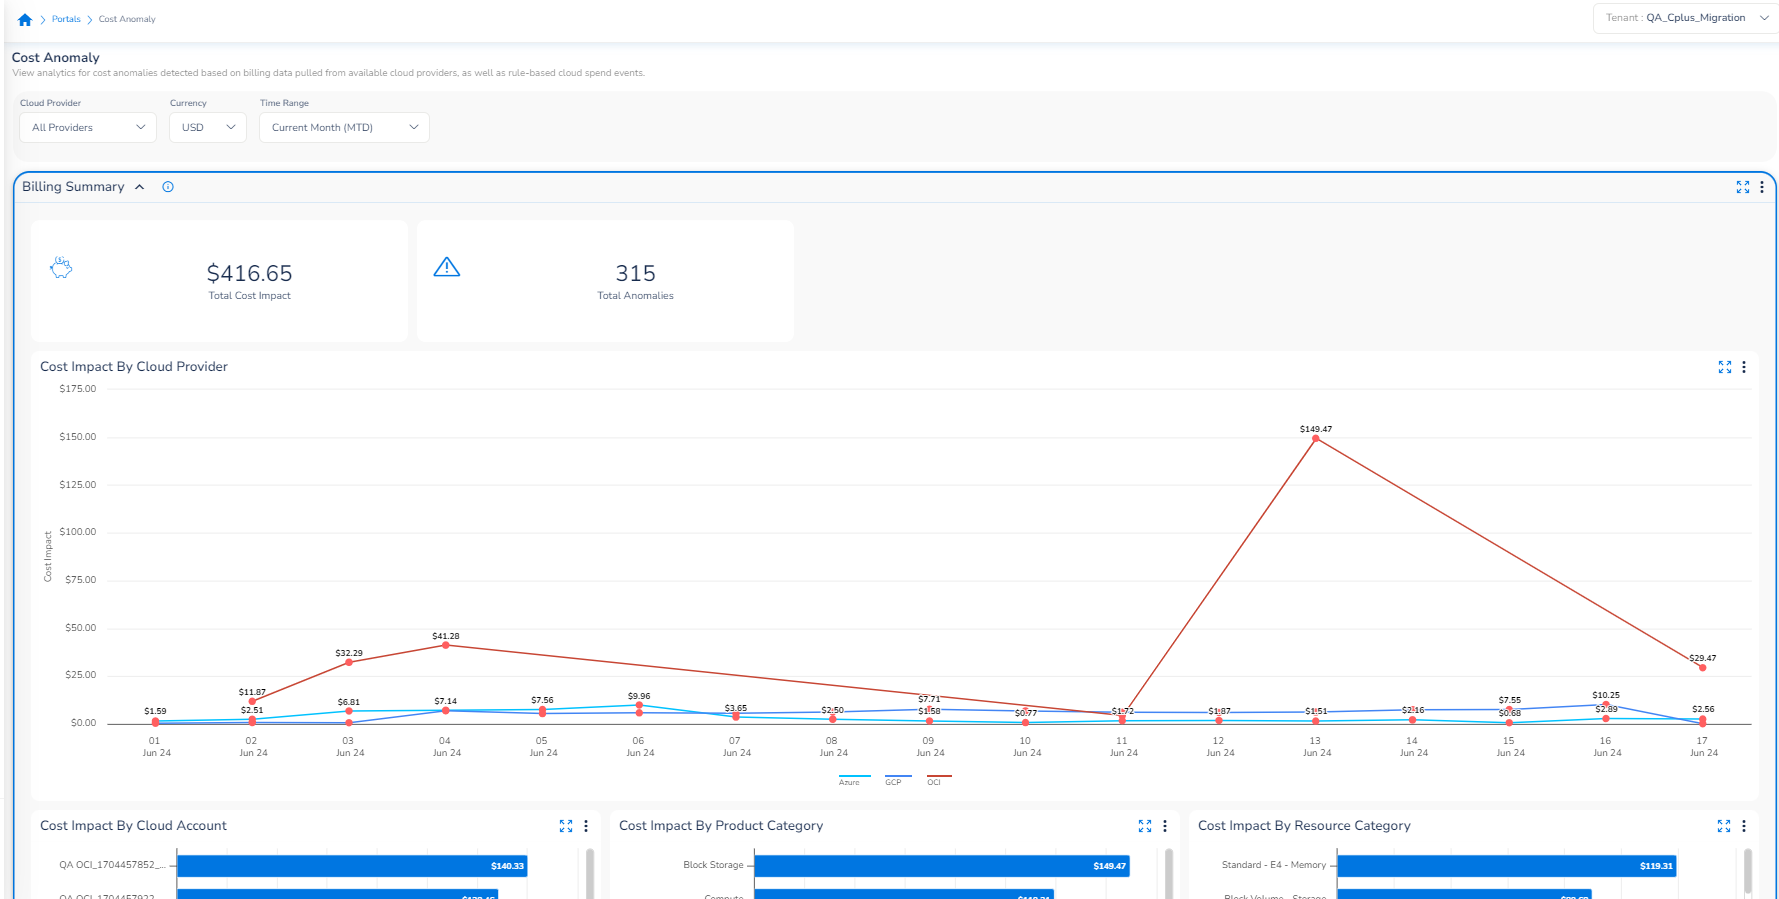
The horizontal bar charts are shown in descending order of cost impact – that is, the cloud account, product category, or resource category with the highest cost impact shows on the top and the one with lowest cost impact shows at the bottom.
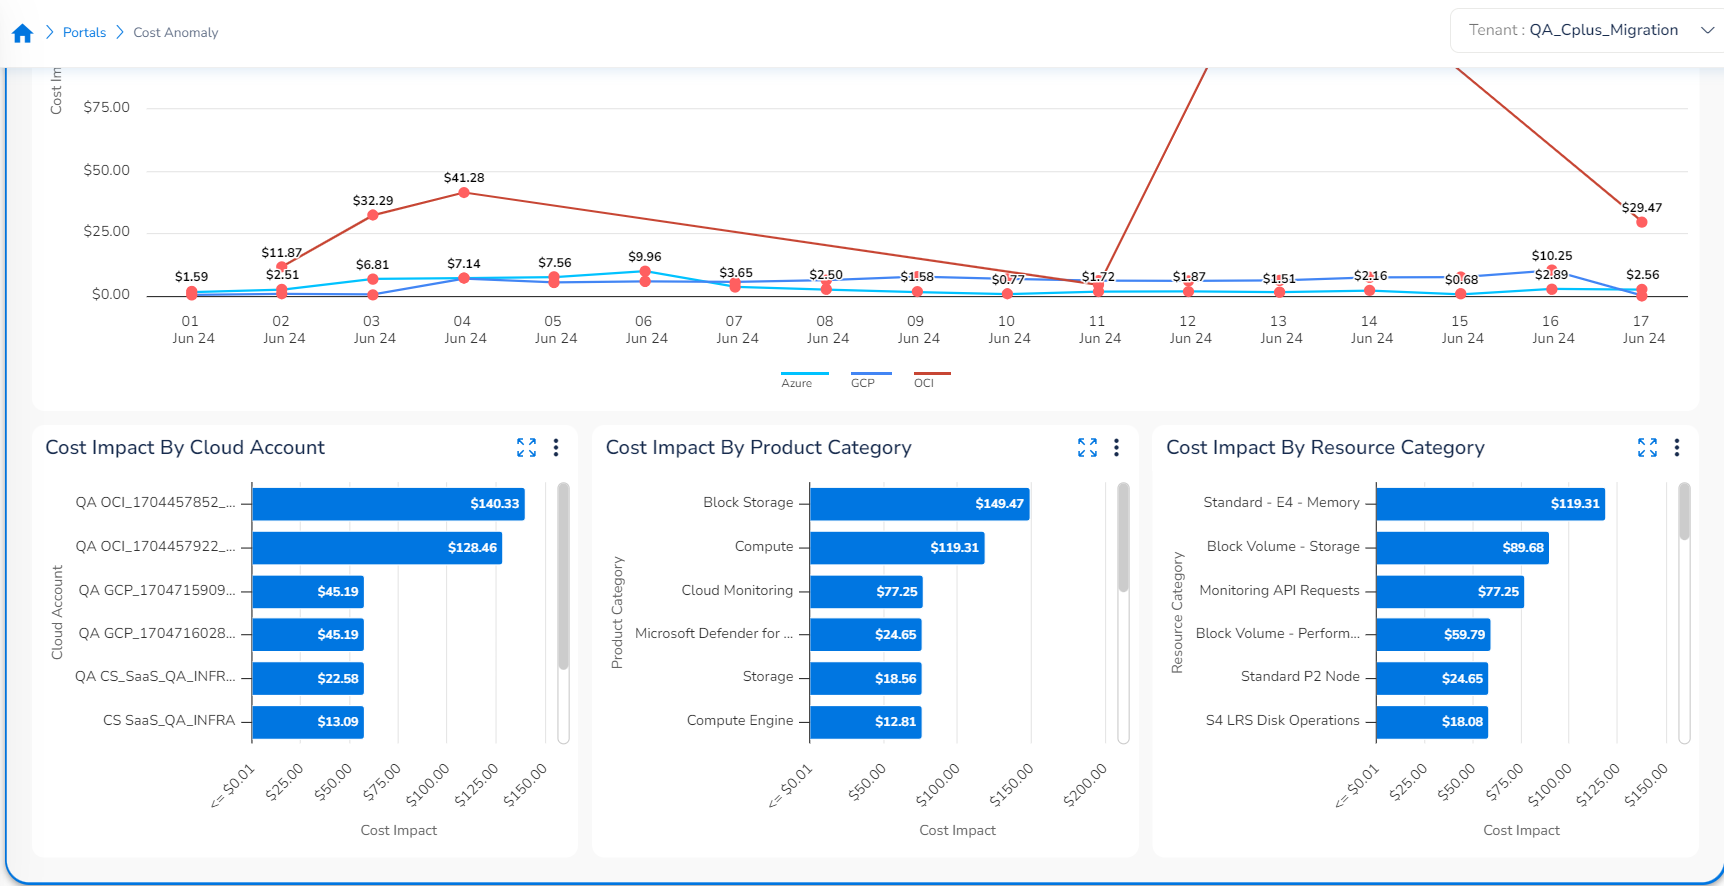
Note:For the Cost impact by Cloud Account chart, users can click any of the blue horizontal bar, and can view different charts that shows the root cause of the cost anomaly, that is, they can view -- Cost Impact by Cloud Account, Cost Impact at Product & Resource Categories, and Cost Impact by Cloud Provider - Detailed View.
- On the Cost Impact by Cloud Provider graph, click any red dot (Cost Anomaly) to view more details. The Cost Anomaly – Root Cause section displays details about the root cause of an anomaly. Users can also view the Cost Impact at Product & Resource Categories graph and Cost Impact by Cloud Provider - Detailed View.
In the Cost Impact at Product & Resource Categories graph, the product categories are listed on the left side and the resource categories are listed on the right side. A user can click any product category to view the list of resource categories related to it. Alternately, a user can click a resource category to view the product category mapped to it.
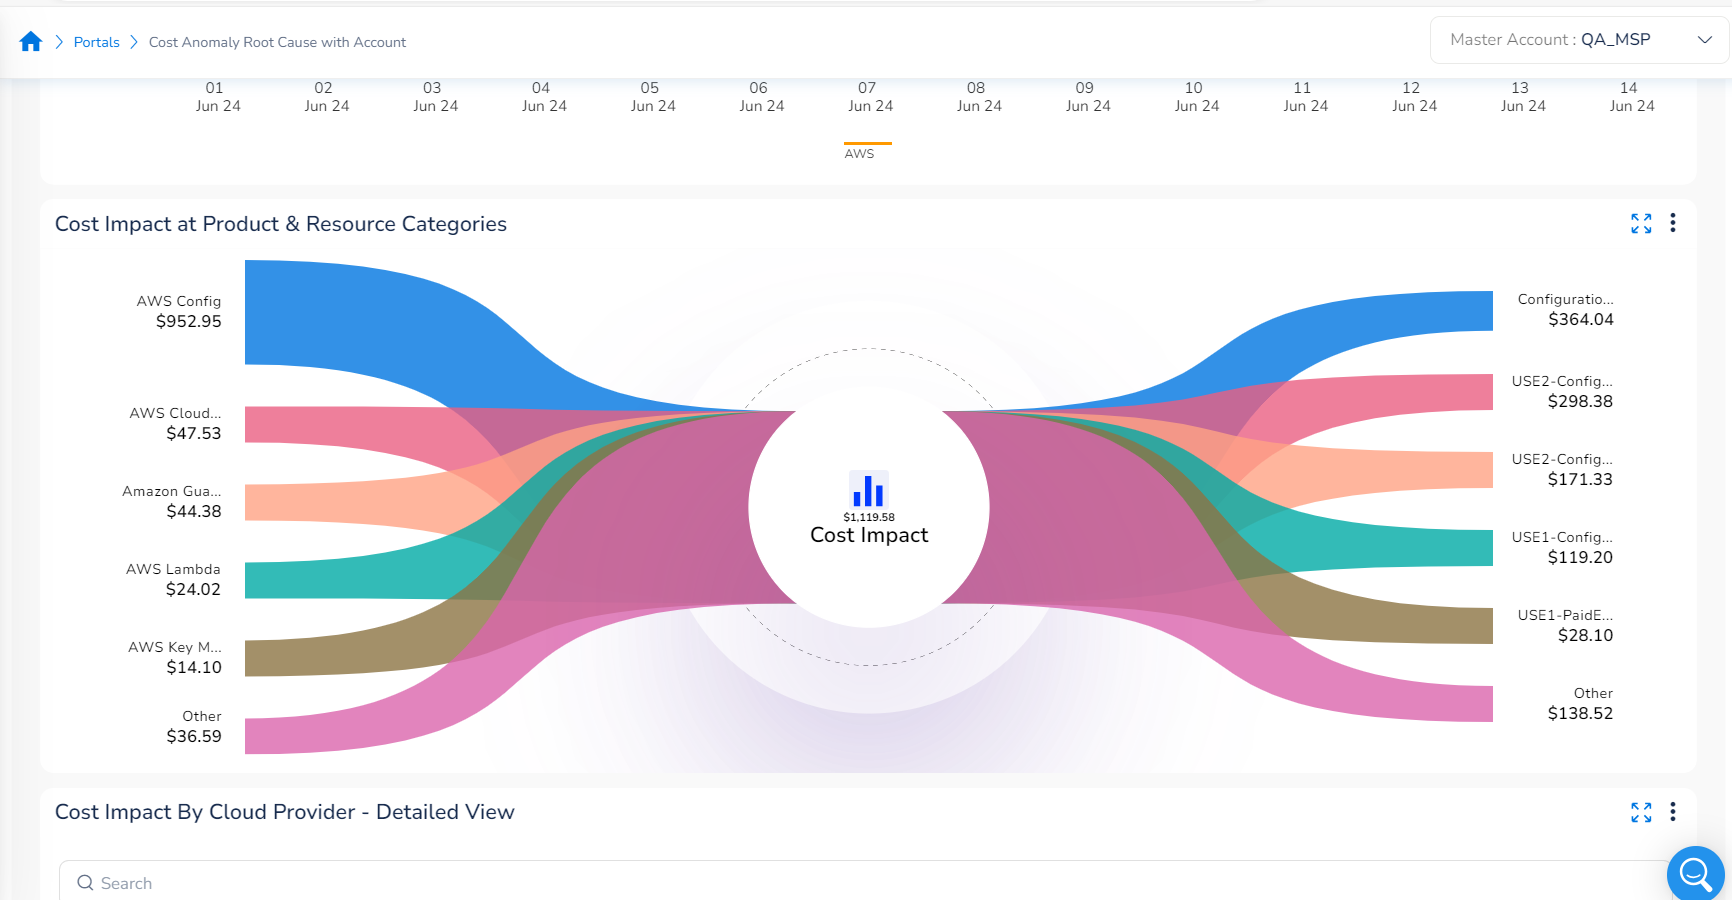
- To view the Cost Impact at Product & Resource Categories chart for specific cloud account(s), a user can select the appropriate option(s) in the Cloud Account list and then click Ok.
The Cost Impact at Product & Resource Categories chart will be displayed as per the options selected. The Cost Impact by Cloud Provider - Detailed View section shows the cost details in tabular format. Users can view Date, Tenant, Cloud Provider, Cloud Account, Product Category, Resource Category, and Cost Impact details.
Note:
- Users can expand a particular chart to get an enlarged view.
- Users can click the ellipses for a particular chart and then click Export config to download the chart details.
- To download chart details in CSV/PNG format, users can click the ellipses > Download > CSV or PNG for a particular chart.
- In the Cost Impact at Product & Resource Categories chart and Cost Impact by Cloud Provider - Detailed View table, to view the chart in another format, click the ellipses > View As > select an option -- Line or Flow or DataTable.
- Users can click the Table Column Selector option at the bottom-right side of the Cost Impact by Cloud Provider - Detailed View table, rearrange the order of columns and select/deselect the column that will be displayed in the table.
Configuration for Sensitivity
Cost Anomaly settings can be configured at the tenant and cloud account levels. Users can modify the sensitivity number and set it as per their needs in order to help detect anomalies.
Users can configure tenant settings that will apply to all accounts. If users wish to override the tenant-level settings, they can define specific settings at the cloud account level.
Tenant Level Configuration
Perform the following steps to configure sensitivity:
- Navigate to the following path:
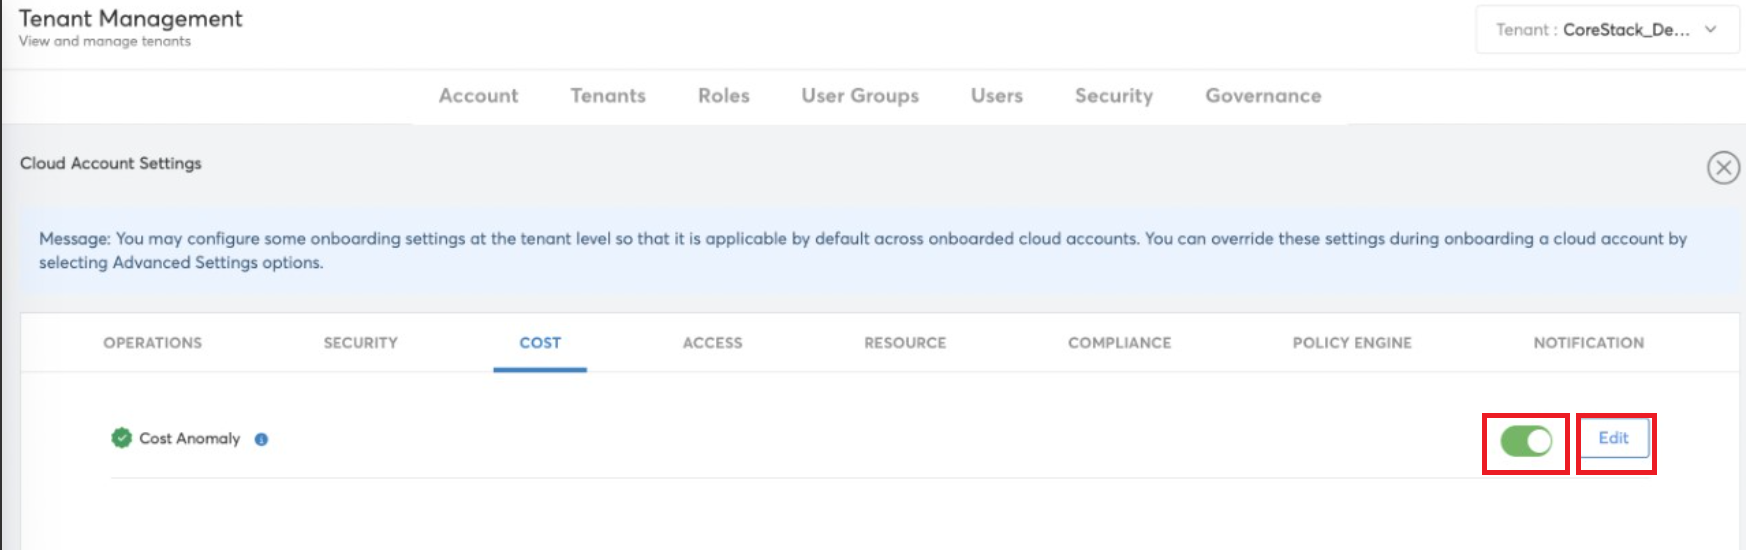
- Tenant level: Settings > Tenants > Tenants > select a tenant > Cloud Account Settings > View Full Settings > Cost
- Click to move the slider to right to enable Cost Anomaly at the tenant level.
- Click Edit.
- To edit the sensitivity number, click the pencil icon.
- In the Sensitivity box, type the desired number if it needs to be changed.
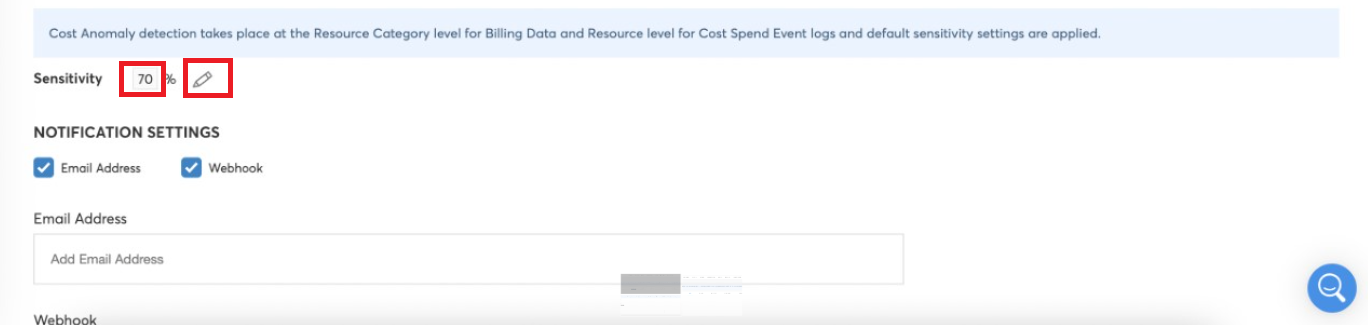
By default, the sensitivity is set to 70. If you want to change the sensitivity number, then you can modify it.
Cloud Account Level Configuration
Perform the following steps to configure sensitivity:
-
Navigate to the following path:
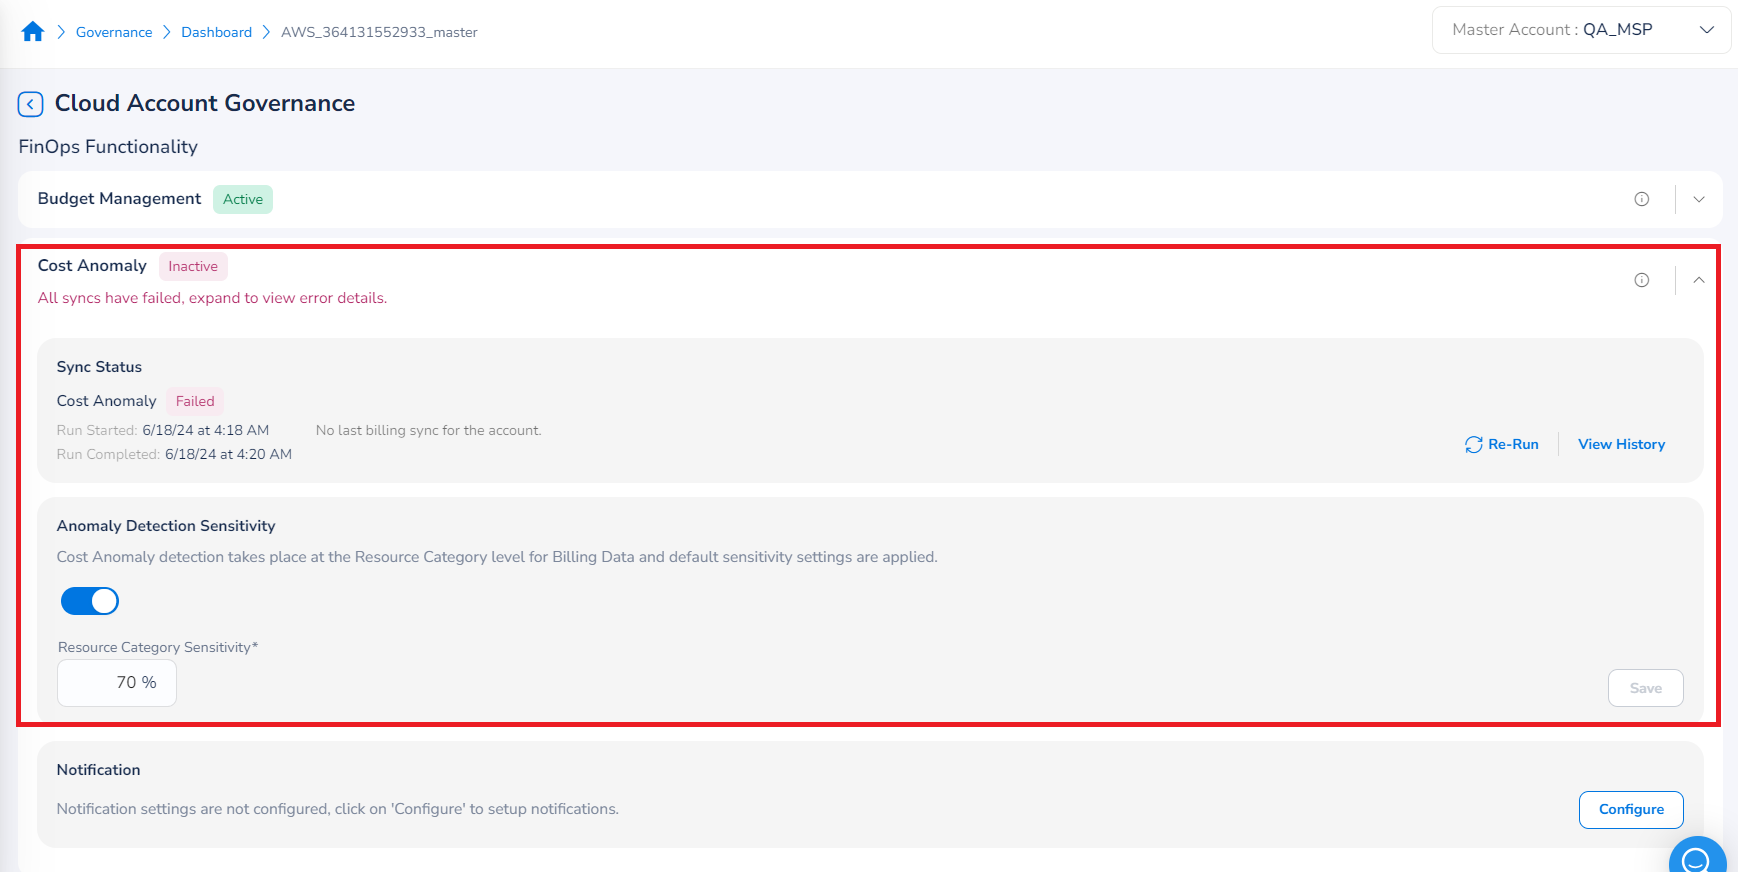
- Cloud Account Level: Governance > Account Governance > Cloud Accounts > identify the account for which sensitivity configuration needs to be made > click ellipses under Actions column > View > FinOps
-
Expand the Cost Anomaly section.
-
Ensure that Anomaly Detection Sensitivity field is enabled (the slider is on the right side).
-
In the Resource Category Sensitivity box, the settings are applied by default. If you want to edit the default setting, add the sensitivity based on which anomaly would be detected.
-
Click Save.
Cost Anomaly – Email Notifications
Overview
In the platform, the email notification settings for cost anomalies can be done at the tenant level and cloud account level. An email notification is sent to users whenever a cost anomaly is detected – that is, when the cost spent value goes above the threshold value, then an anomaly is detected, and an email notification is sent to users with all the relevant details.
Users can configure tenant settings that will apply to all accounts. If users wish to override the tenant-level settings, they can define specific settings at the cloud account level.
The email notifications are sent within 24–48 hours of detection. Users can then take action accordingly based on the anomaly details provided to them.
Refer to the sample notification email shown below. The anomaly details can be viewed in the email.
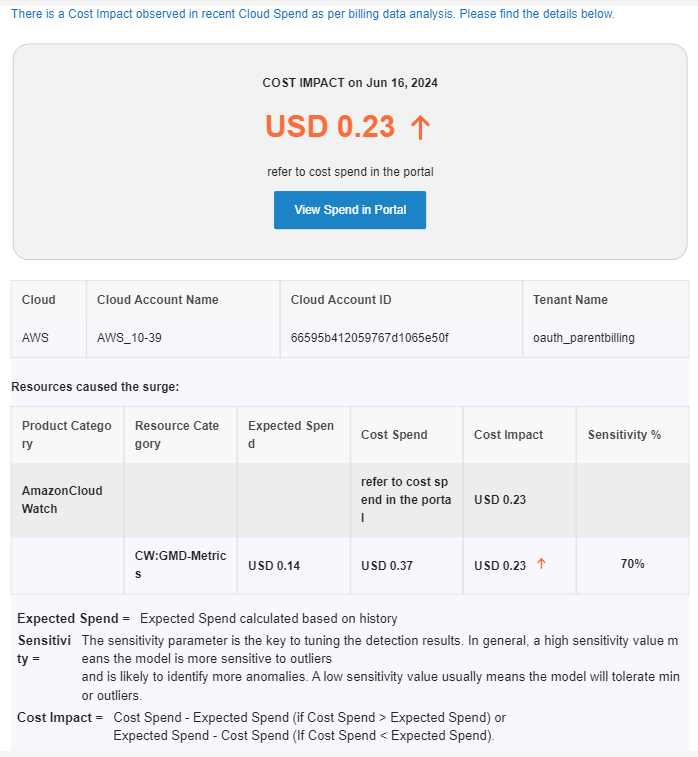
The email shows the date when the cost anomaly occurred, cost impact amount, cloud account name, cloud provider type, cloud account ID, tenant name, product category, resource category, expected spend, cost spend, sensitivity percentage, etc.
Note:For GCP accounts, the notifications are sent within 6-24 hours and for other accounts, the notifications are sent between 24-48 hours.
Tenant Level Configuration for Email Notifications
Perform the following steps to set up cost anomaly email notifications:
-
Navigate to the following path:
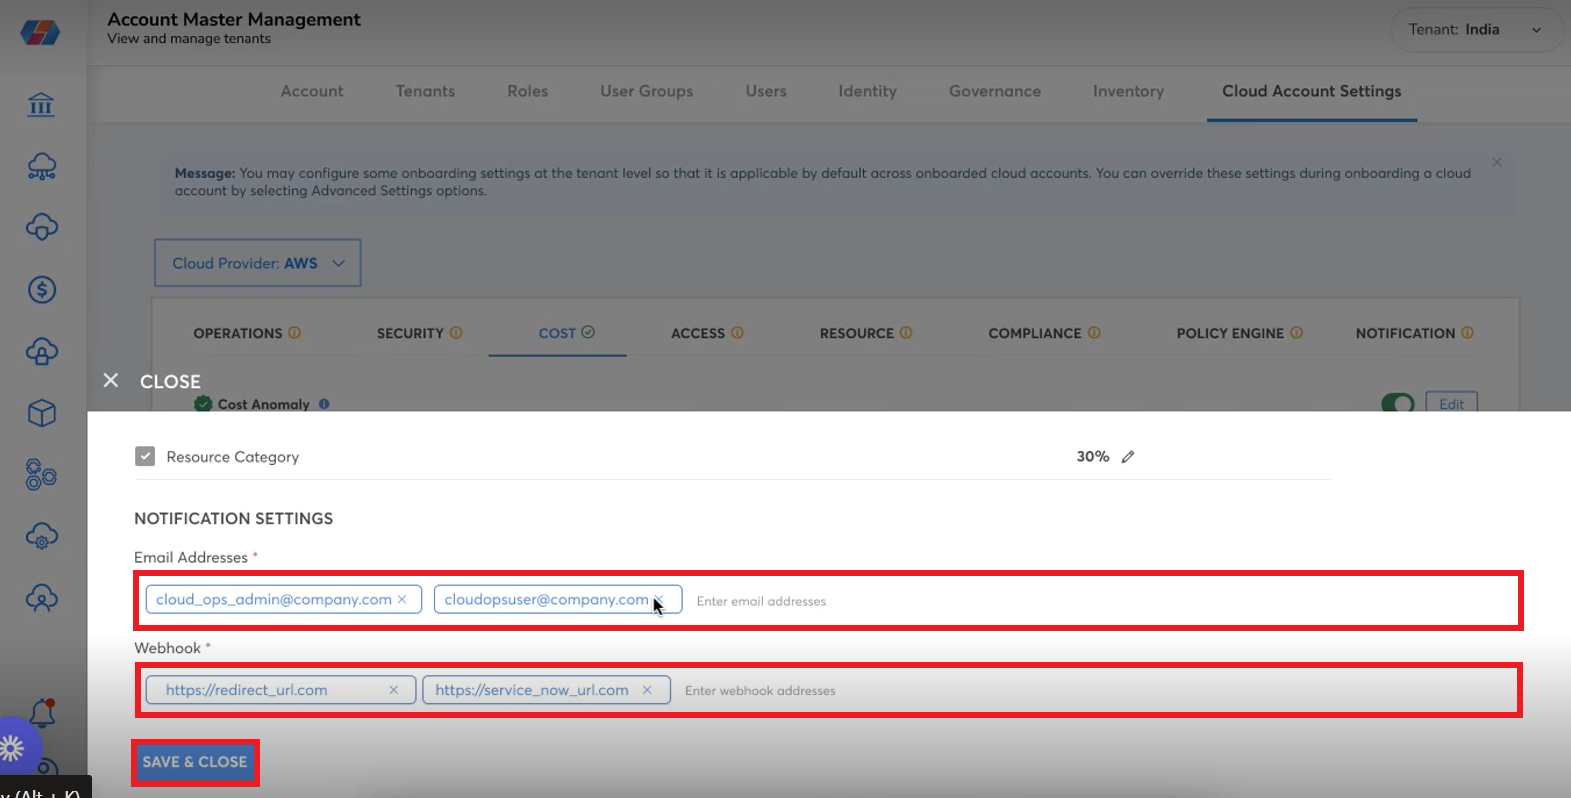
- For Tenant level: Settings > Tenants > Tenants tab > select a tenant > Cloud Account Settings > View Full Settings > Cost tab > Cost Anomaly.
-
Click to move the slider to right to enable Cost Anomaly at tenant levels.
-
Click Edit.
-
In the NOTIFICATION SETTINGS section, click to select Email Address and Webhook or either of these options.
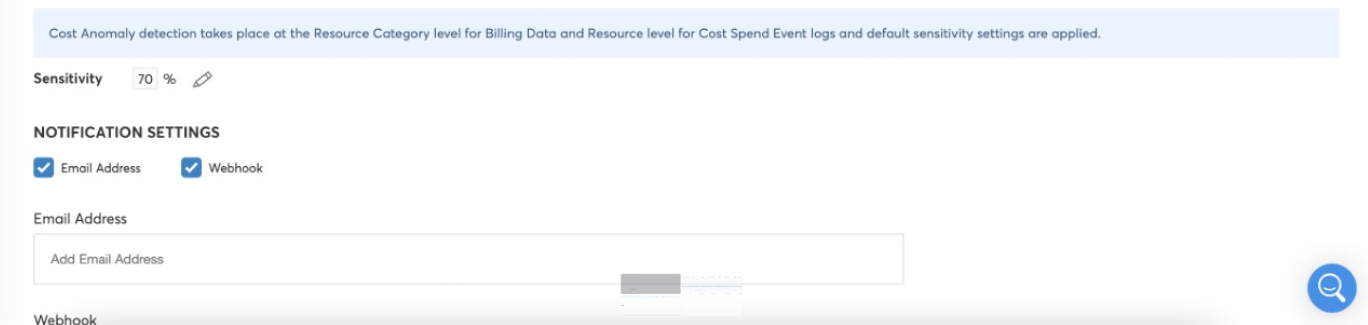
Based on the selected options, field(s) will be displayed below.
-
In the Email Addresses box, type the relevant email addresses of the recipients.
-
In the Webhook box, type the URL of platforms where the integration is enabled.
-
Click SAVE & CLOSE.
Account Level Configuration for Email Notifications
Perform the following steps to set up cost anomaly email notifications:
-
Navigate to the following path:
- Cloud Account Level: Governance > Account Governance > Cloud Accounts > identify the account for which notification configuration needs to be made > click ellipses under Actions column > View > FinOps
-
Expand the Cost Anomaly section.
-
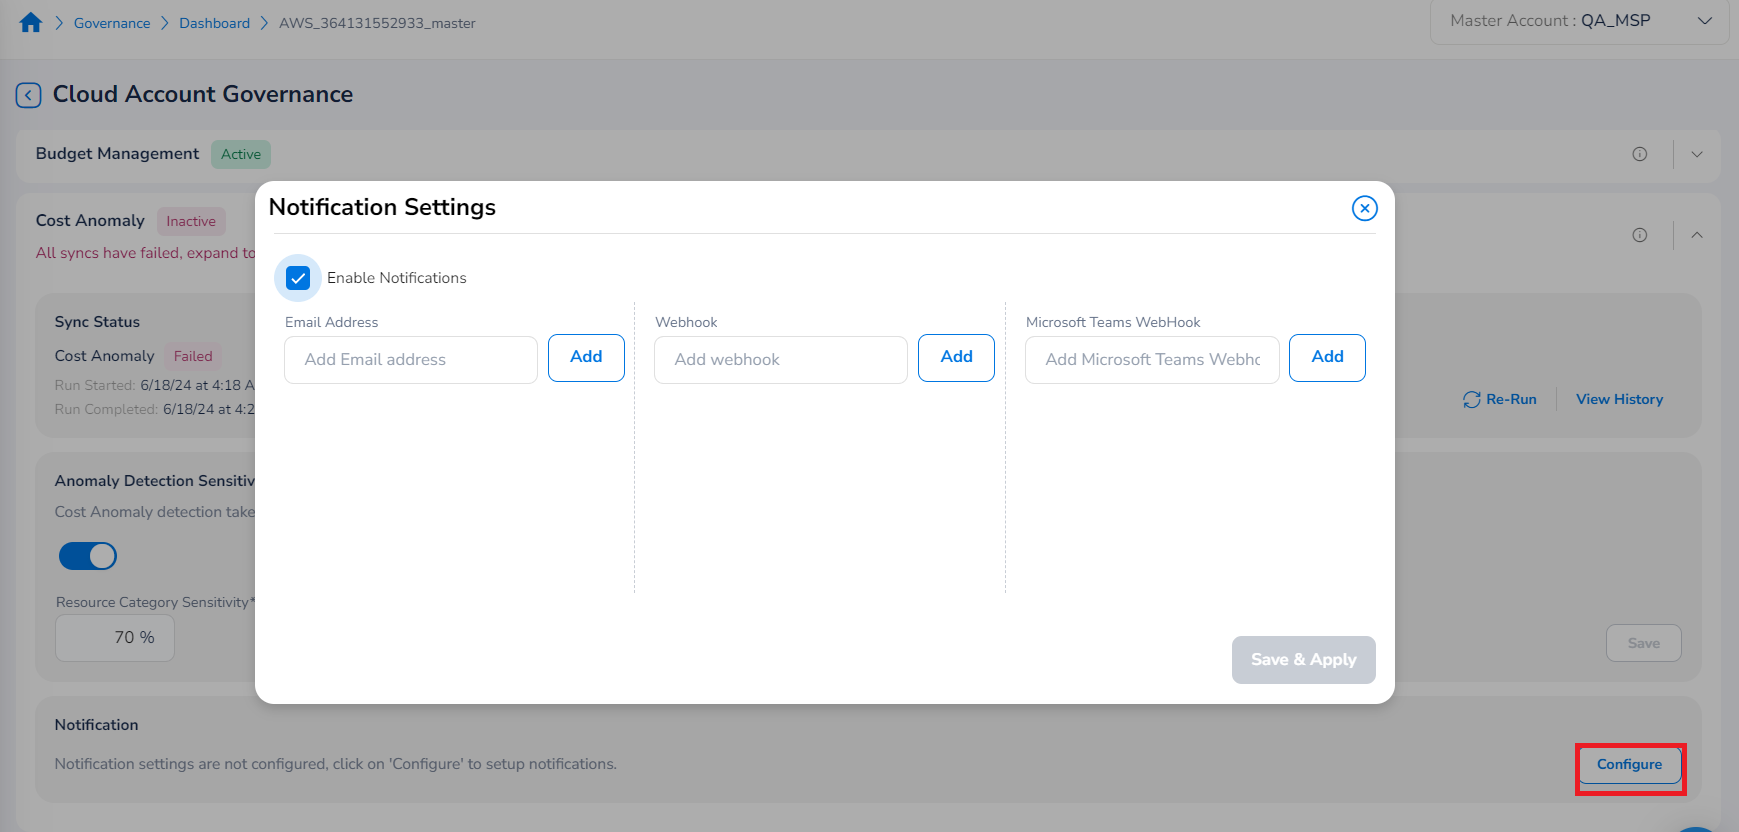
In the Notification section, click Configure. The Notifications Settings dialog box appears.
-
Select the Enable Notification checkbox. The Email Address, Webhook, and Microsoft Teams Webhook fields are displayed and needs to be filled based on the need.
- In the Email Address box, type the email address of the user(s) and click Add.
- In the Webhook box, type the webhook link(s) and click Add.
- In the Microsoft Teams Webhook box, type the URL(s) for Microsoft Teams Webhook and click Add.
-
Click Save & Apply.