Zabbix
Overview
CoreStack supports the following use cases for Zabbix when integrated.
- Host Configurations (Basic & Advanced) using Templates
- Receive Alerts for various Host metrics in CoreStack CloudOps Dashboard
- Perform Remediation actions based on Zabbix Alerts
- View Metric Trends from Zabbix as part of the Cloud Inventory
- View Machine Learning based Forecast for the Metrics
- View Utilisation Reports based on Zabbix Metrics
Versions Supported: 4.0
Pre-Requisites before Onboarding
- Create an user for CoreStack App
- User Privileges
- Read access is sufficient if you intend to use only utilisation data & metrics
- Admin access is required if you need to configure hosts, metrics from CoreStack
- Have the URL and credentials ready for onboarding
- The Resource Name (from cloud provider) must match with the Host Name configured in Zabbix
- This is a requirement to automatically start fetching the metrics
- In case they are different, you can still map them manually – see configuration instructions
Onboarding Zabbix Account
Login to CoreStack portal > Settings > Integrated Tools > Zabbix > Add Account .
The onboarding has 3 steps involved:
- Authentication
- Configuring Triggers & Actions
- Authorization
Authentication
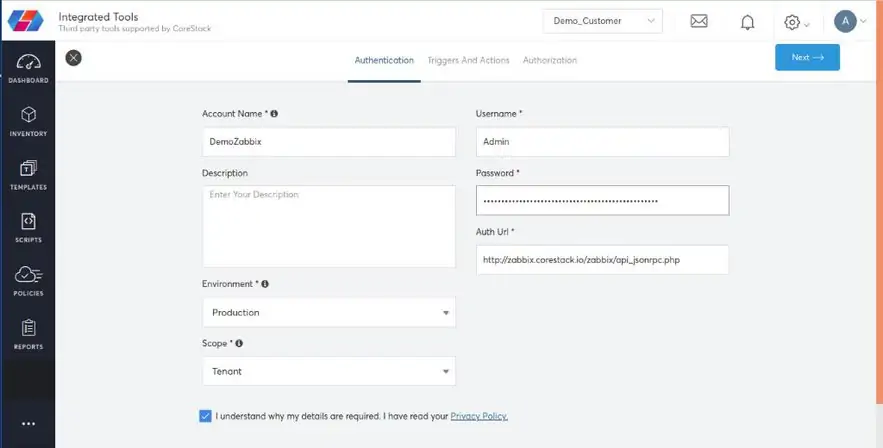
Provide Zabbix Username, Password and API auth URL
- For Utilization data and metric alerts – The provided user should be under a group which should have read access to all host/host groups
- For host configuration such as adding new host, adding a new metric under the host using templates – User should have read/write access (Zabbix Admin)
Configuring Alerts/Metrics
This page will have two sections
- Zabbix Host Config
- Zabbix Trigger Config
Zabbix Host Config
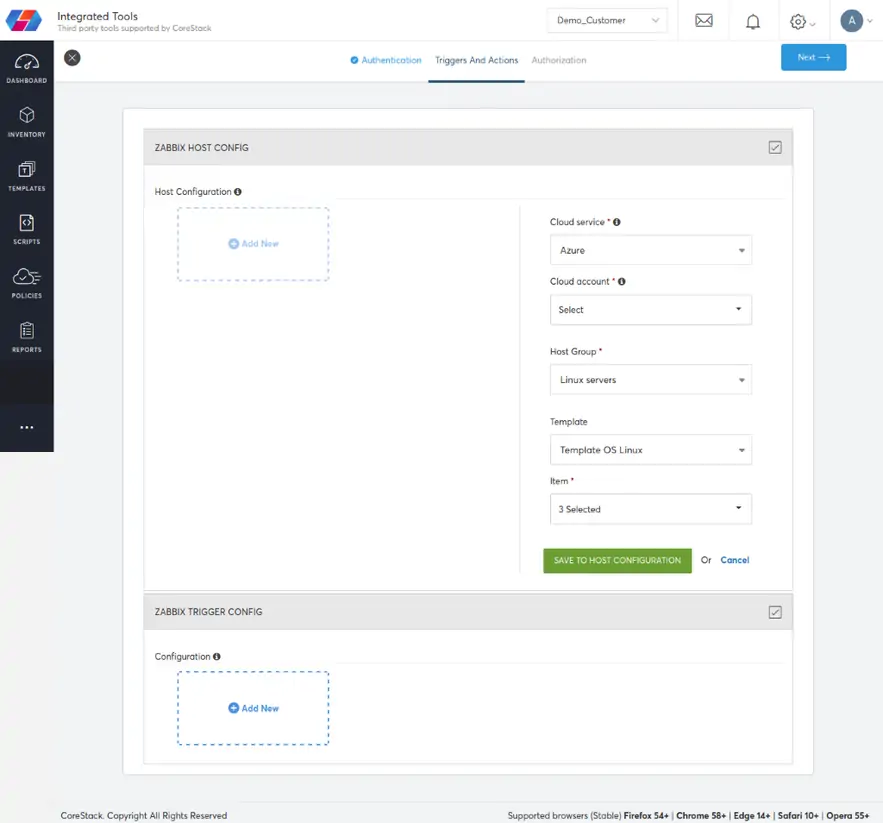
This configuration is used to select the metrics (Zabbix Items) that needs to be managed by CoreStack in order to get the utilization data. Select the Cloud, Cloud account, Host Group, Template and then items under the template to collect data.
Note:
The configuration is specific to Host Group/Template. To select items for other host groups/template, repeat the above steps.
Zabbix Trigger Config
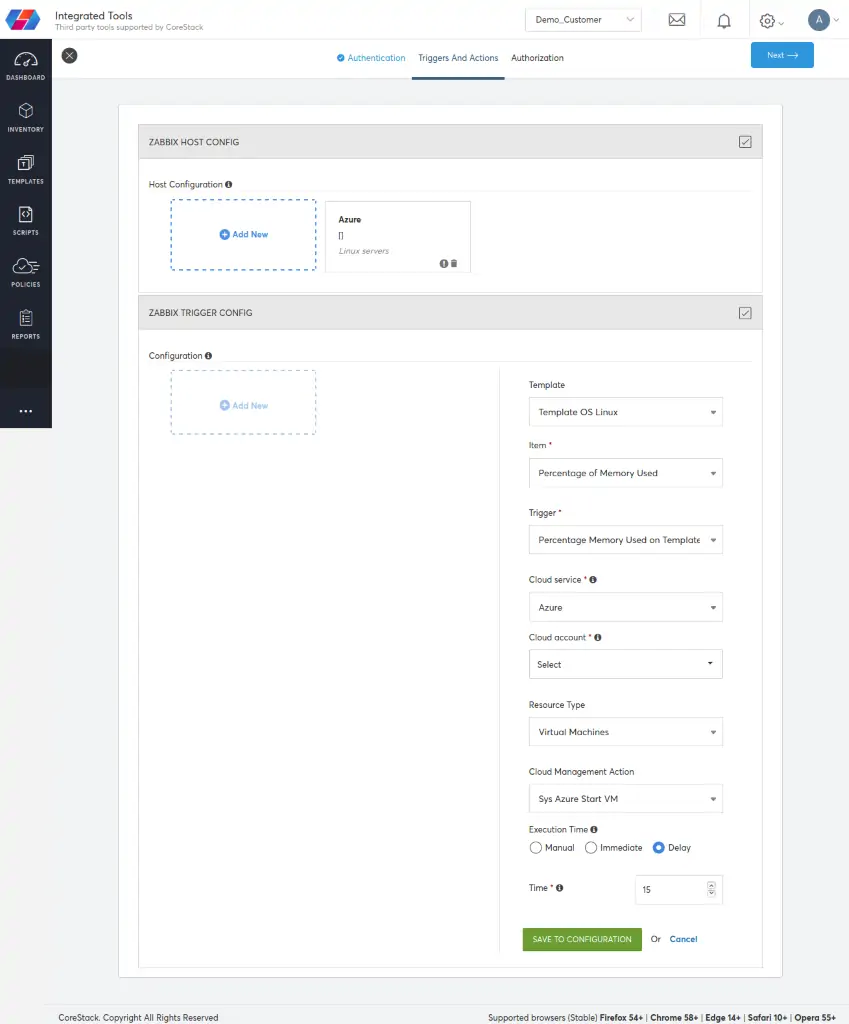
This configure is used to set metric alerts and remediation actions. For eg, If CPU utilization threshold reached 70%, restart VM.
- Select Template -> Item -> Trigger (threshold condition)
- Select Cloud, Cloud Accounts -> Resource Type -> Remediation Action -> How to execute remediation actions
- Remediation Actions can be executed Manual, Immediate or with a delay
Authorization
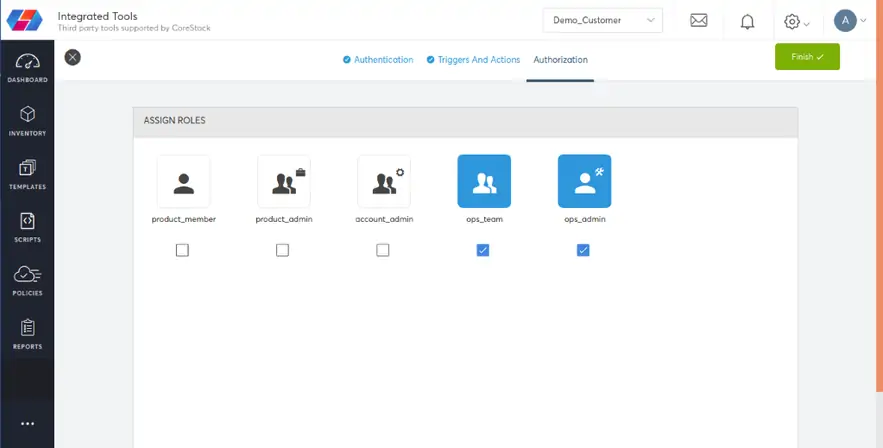
Select the CoreStack roles to provide access to this Zabbix account and click finish.
Viewing Utilization Data
The metric items selected under “Host config” can be viewed under
- Inventory -> Select Category (compute) -> Resource Type (Instances) -> Select particular resource -> Utilizations
- Select Type -> Integrated Tools -> Zabbix
You can see the configured metric’s data
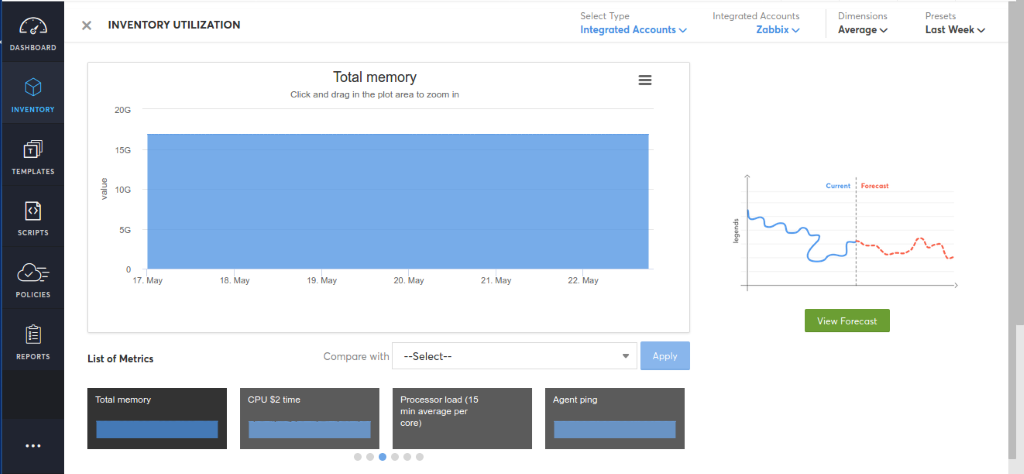
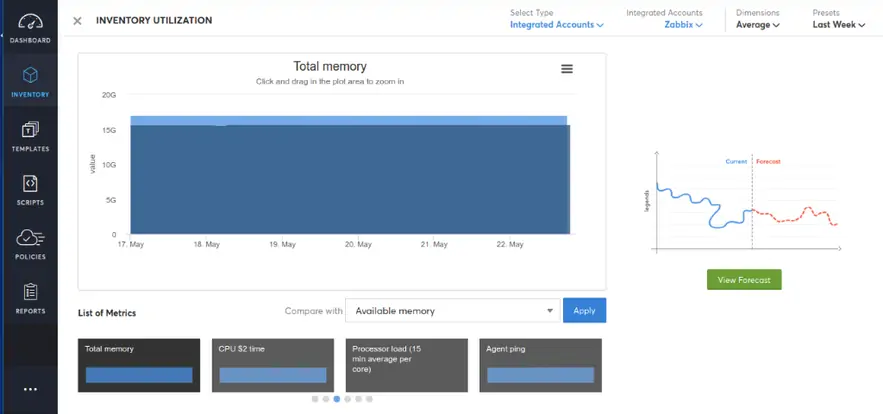
All the other configured metrics will be available below the graph, select the item to see the corresponding data. You can also select another item in “Compare with” to compare the graph.
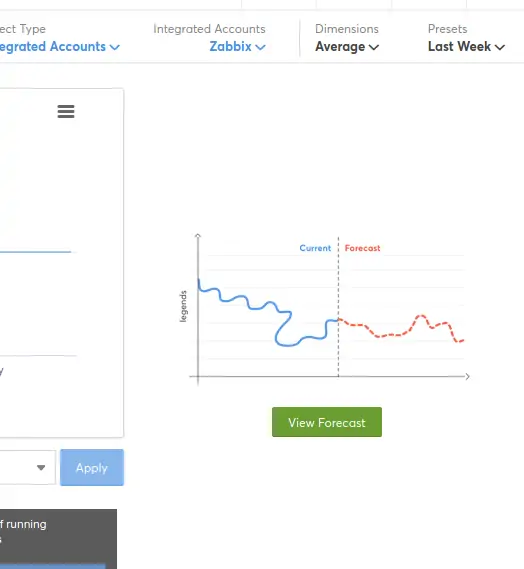
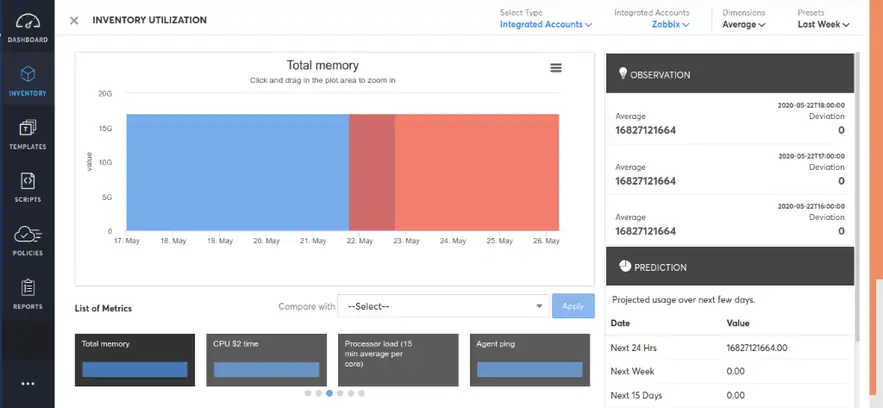
Click view forecast to see the forecast data
Configure Zabbix Hosts
Map Existing Host Names with Cloud Resource Names
CoreStack will automatically fetch the utilization data based on the condition that the “resource name” (from cloud provider) matches with the “host name” configured in Zabbix. If this doesn't match, CoreStack will not collect data.
If there are hosts configured in Zabbix, which have different names in the cloud, you can follow the below instructions to map them manually.
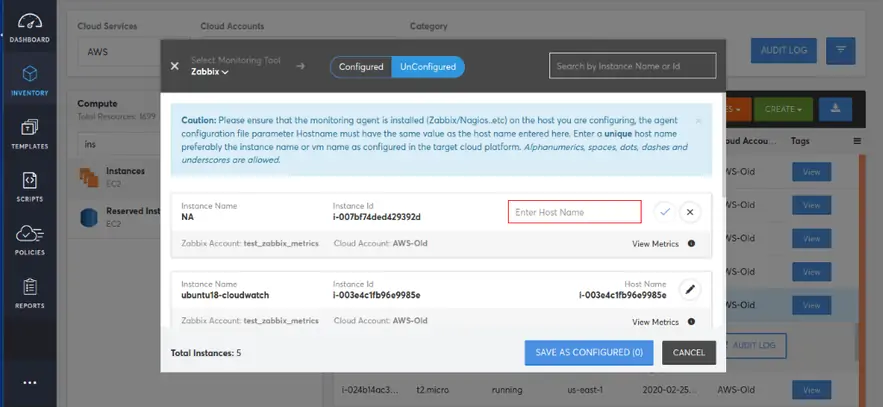
- Go to Inventory ->Enable Services -> Monitoring

Unconfigured -> This will list down all resources that are not configured for utilization data Click edit icon on the left side of the corresponding resource and provide the host name configured in Zabbix. The provided name will be validated against the corresponding Zabbix account configured. If host is valid and available, CoreStack will start collecting utilization data.
Add New Hosts to Zabbix
CoreStack provides you out of the box (Marketplace) Templates to add a new hosts to Zabbix. There are templates for adding with/without agent.
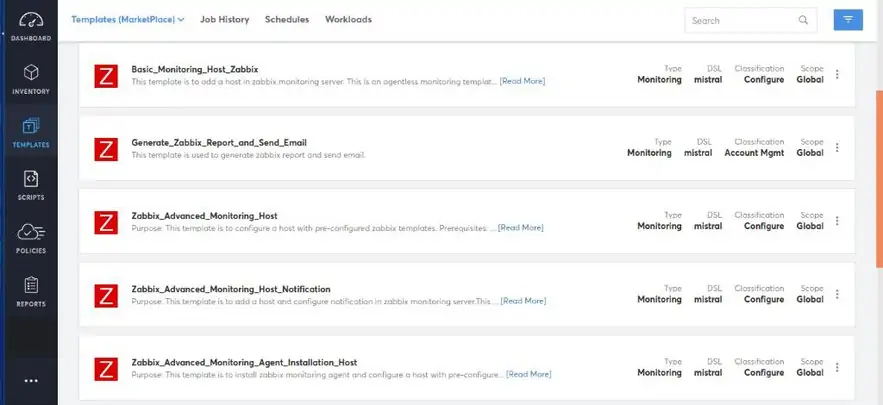
Users can execute those templates against the Zabbix account onboarded with the required inputs. This is particularly useful to include them as a standard task while provisioning new resources in the cloud.
Alerts and Remediation
If the configured trigger (threshold alert) under “trigger config” is reached, CoreStack will receive a metric alert. User can see the alert in Cloud ops > Threshold Alerts.
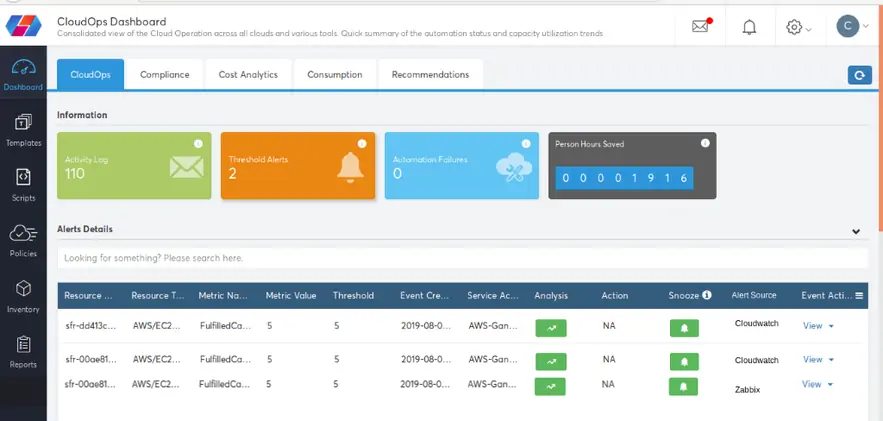
Based on the configured remediation action, CoreStack will execute the remediation if it is not manual (immediate/delayed). In case of manual, user has to manually resolve using the “Resolve” button.

Updated about 1 year ago