
AppDynamics
CoreStack integrates with Cisco AppDynamics to provide you with crucial metrics that can help optimize your applications.
These metrics include:
- Application performance: Customers' application issues can massively impact their digital experience, and by extension, your brand reputation. Therefore it's critical to avoid downtime that affects or disrupts a user's experience and prevents you from meeting Service-Level Agreements (SLAs).
- CPU usage: The central processing unit (CPU) is responsible for executing instructions in computer programs. Any CPU performance degradation can affect disk read and write speeds and create significant memory issues. So AppDynamics tracks CPU usage metrics to avoid these issues.
- Error rates: AppDynamics scans for errors, such as web requests, that result in operations failing during memory-intensive processes. This enables you to keep an eye on web requests that could result in application-affecting errors.
- Request rates: AppDynamics collects data around spikes in application traffic activity, periods of inactivity and the number of active users. This helps to identify issues with applications and areas of the application that may need optimizing.
- Response times: Slow application responses can be mission-critical. Loading times of more than several milliseconds can result in users losing trust in your brand and taking their business elsewhere. With AppDynamics, having historical data on application response times, enables you to track application slowdowns in real-time.
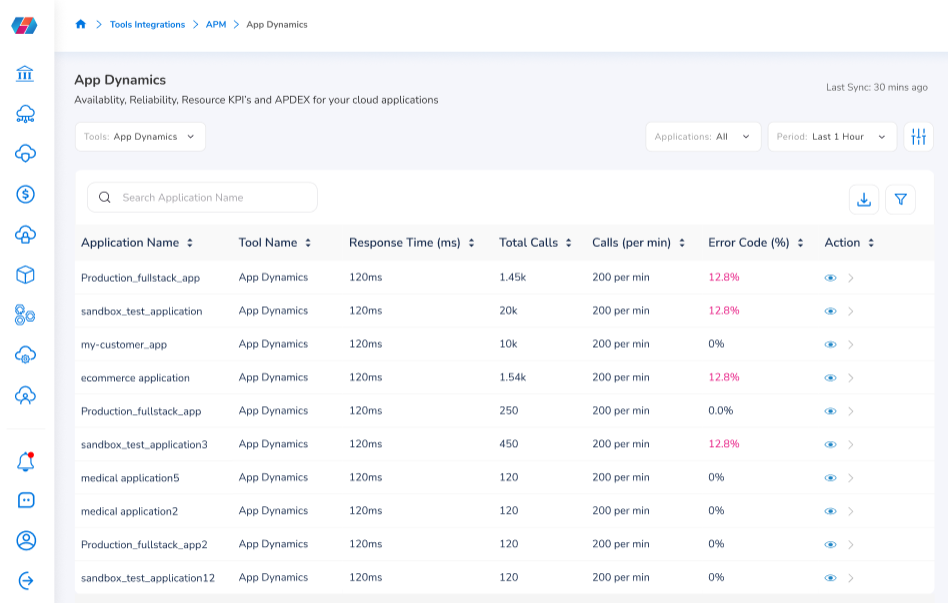
To open the AppDynamics dashboard in CoreStack, navigate to Security > APM > App Dynamics.
Updated over 1 year ago