
Resource Analytics
| Report Group | Report Name | Report Description |
|---|---|---|
| Cloud Service Analytics | EC2 Analytics | Provides in depth analytics on your AWS EC2 resources including orphaned resources, under-utilized, over-utilized, stopped / started state etc. |
| Cloud Service Analytics | S3 Analytics | Provides in depth analytics on your AWS S3 buckets including orphaned, aging, size etc. You can also view the list of objects for the buckets. |
| Inventory Analytics | All Resource Inventory | This report provides a full inventory report across all resource types. |
| Inventory Analytics | Inventory by Application | Cloud inventory report by the Application / Workload. |
| Inventory Analytics | Inventory by Application with Group | Cloud inventory report by the Application / Workload with group. |
| Inventory Analytics | Application view of Inventory | This is a printable report on the Application wise cloud inventory. |
| Inventory Analytics | Asset 360 | This report is a perspective report based on inventory. This report provides details about costs, security threats or vulnerabilities for particular resources, guardrail recommendations to be optimized, etc. |
Inventory Reports
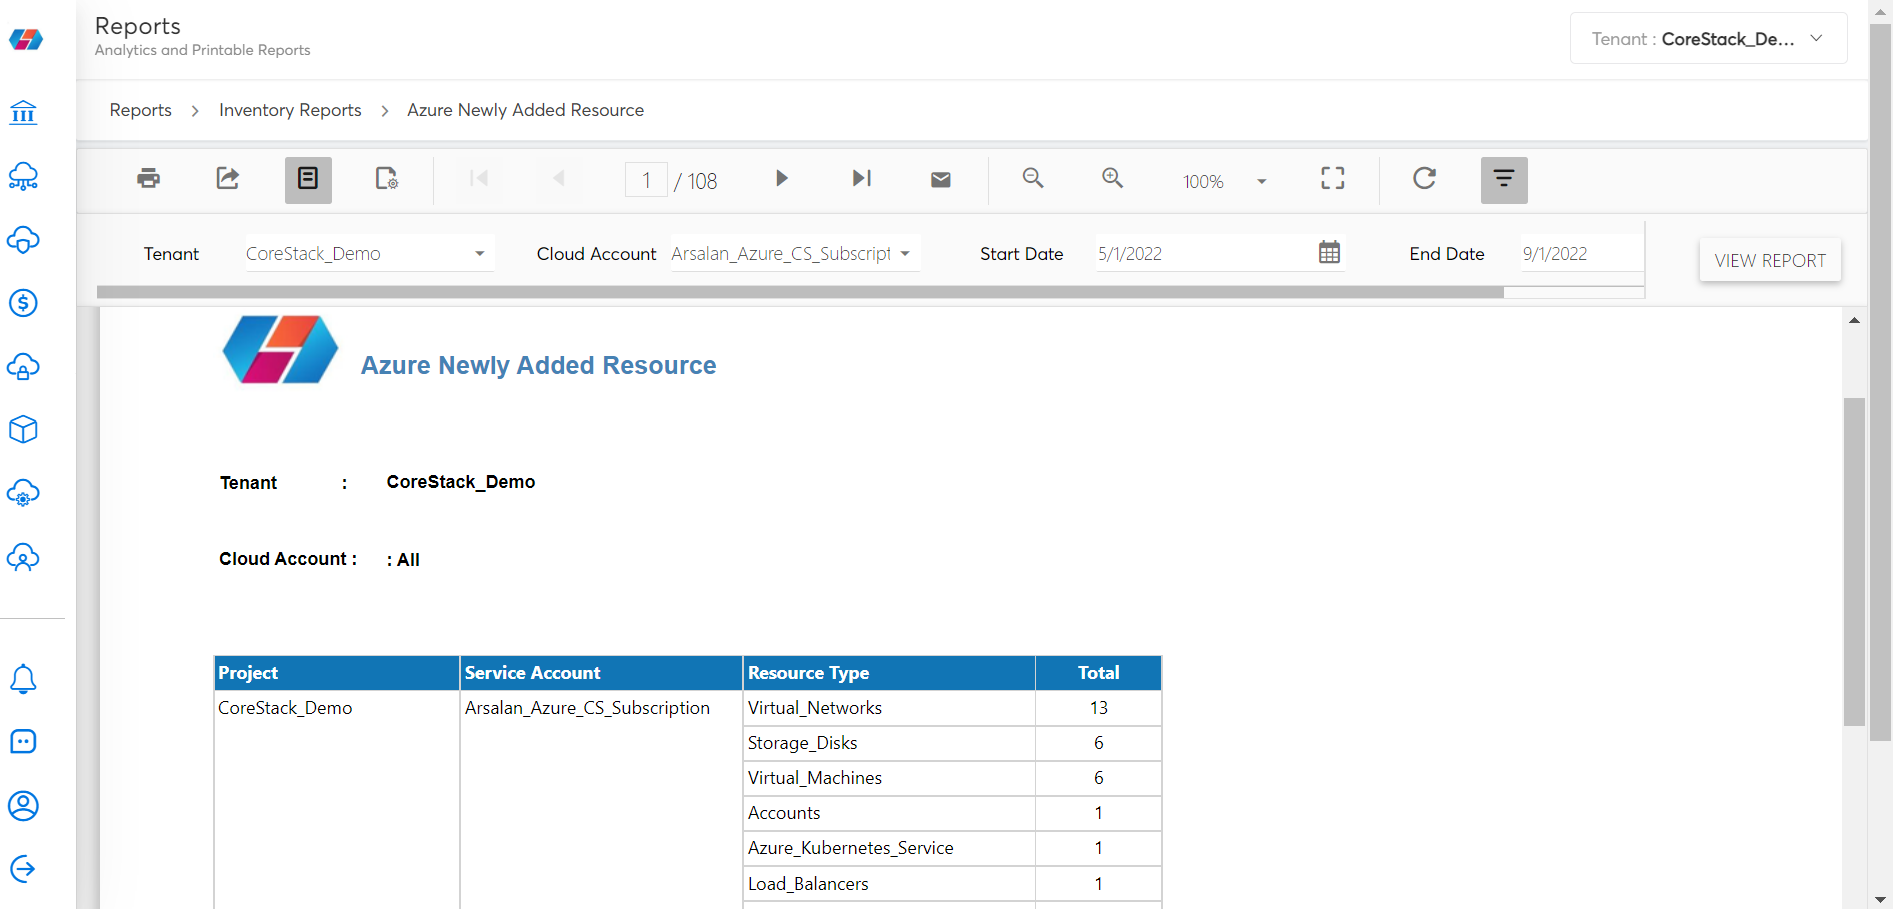
Azure Newly Added Resource
You can use SQL Server Reporting Services (SSRS) report for scheduling.
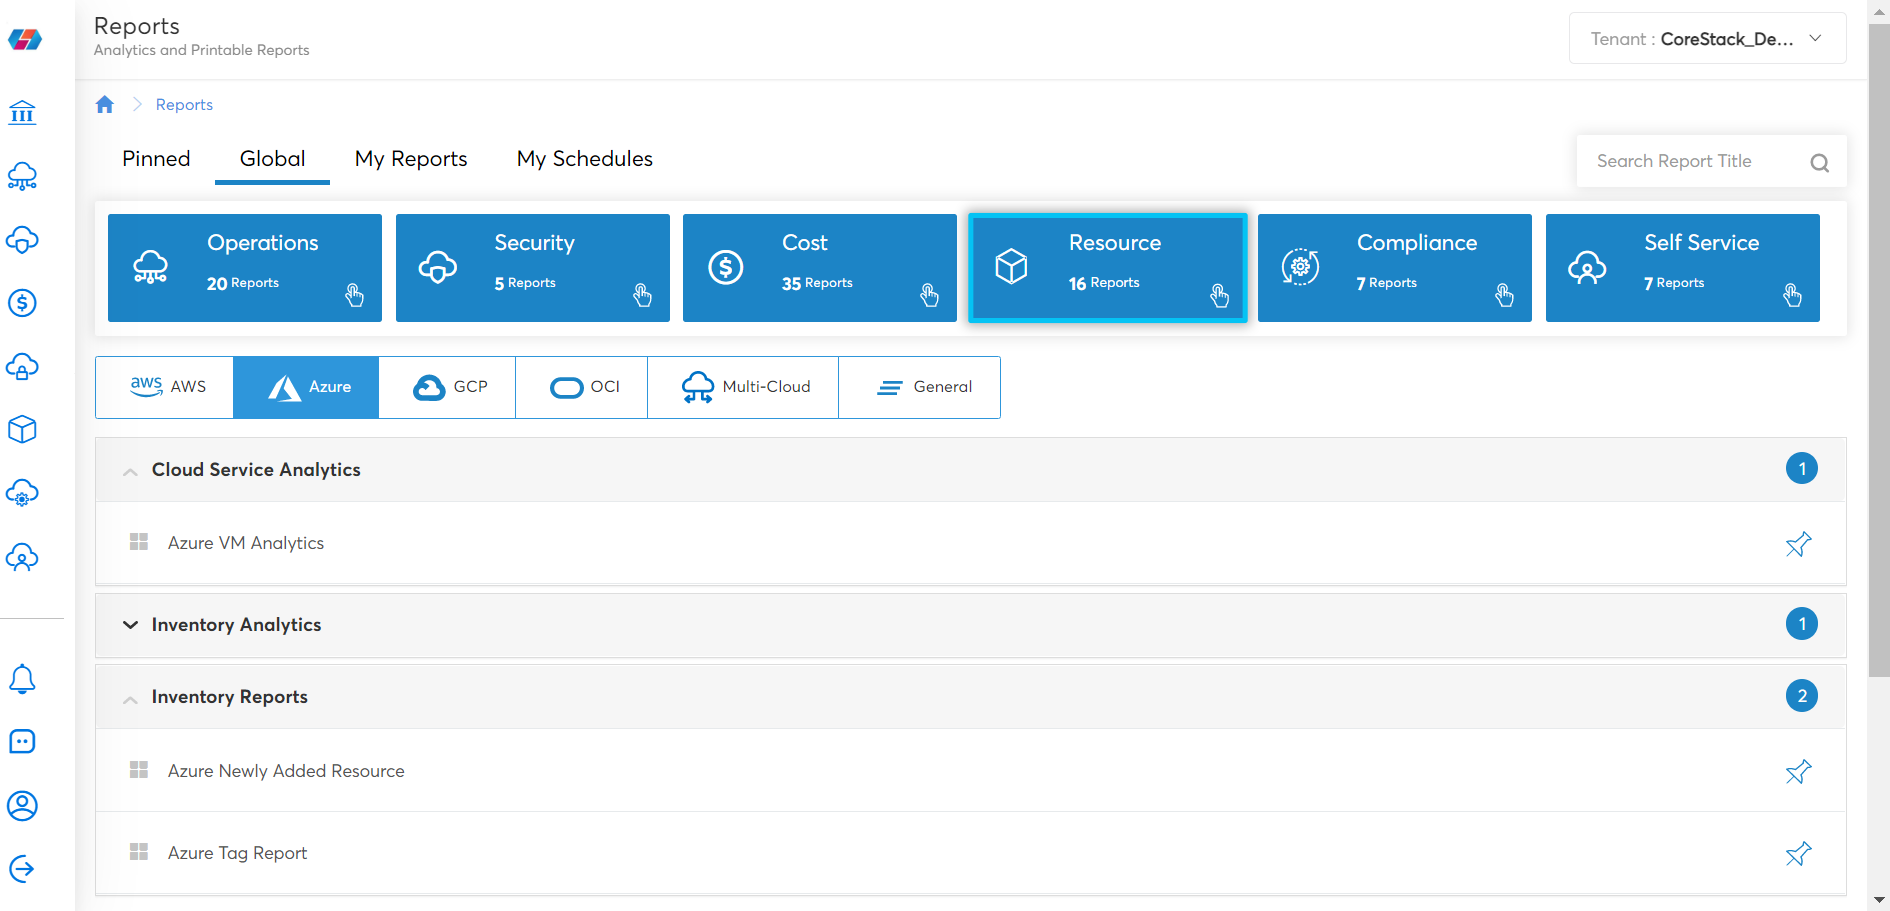
- Click Reports.
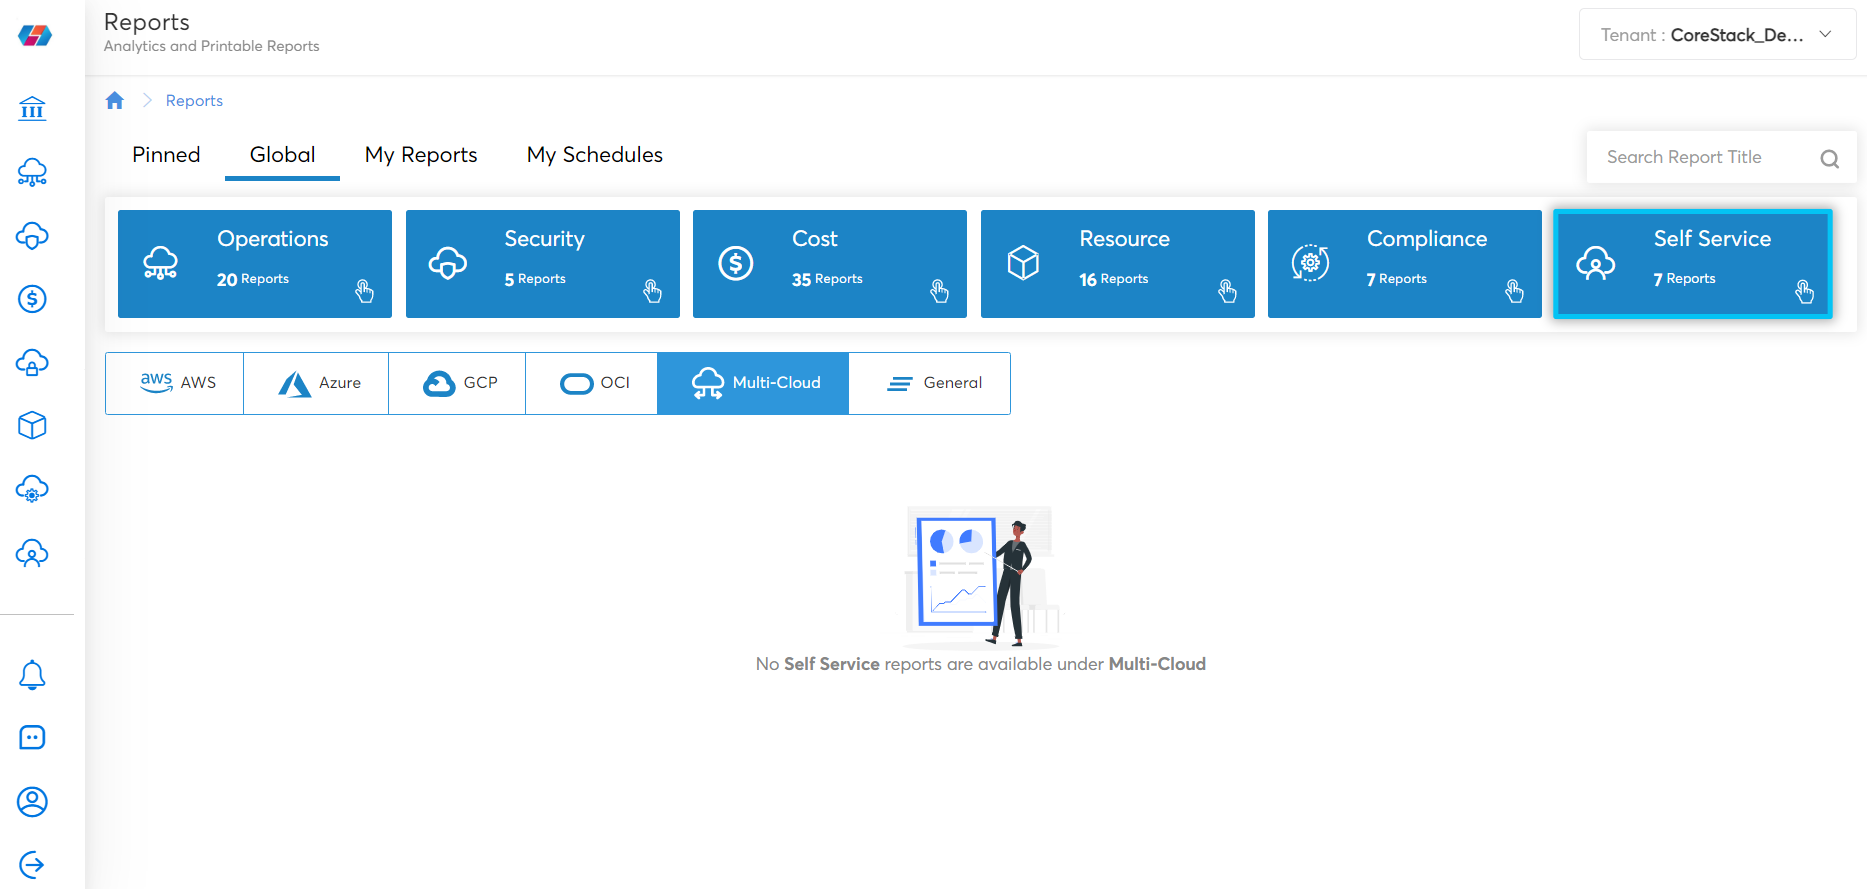
- Click Resource.
- Click Azure.
- Click Inventory Reports.
- Click Azure Newly Added Resource.
- Add Tenant, Cloud Account, Start Date and End Date.
- Click View Report.
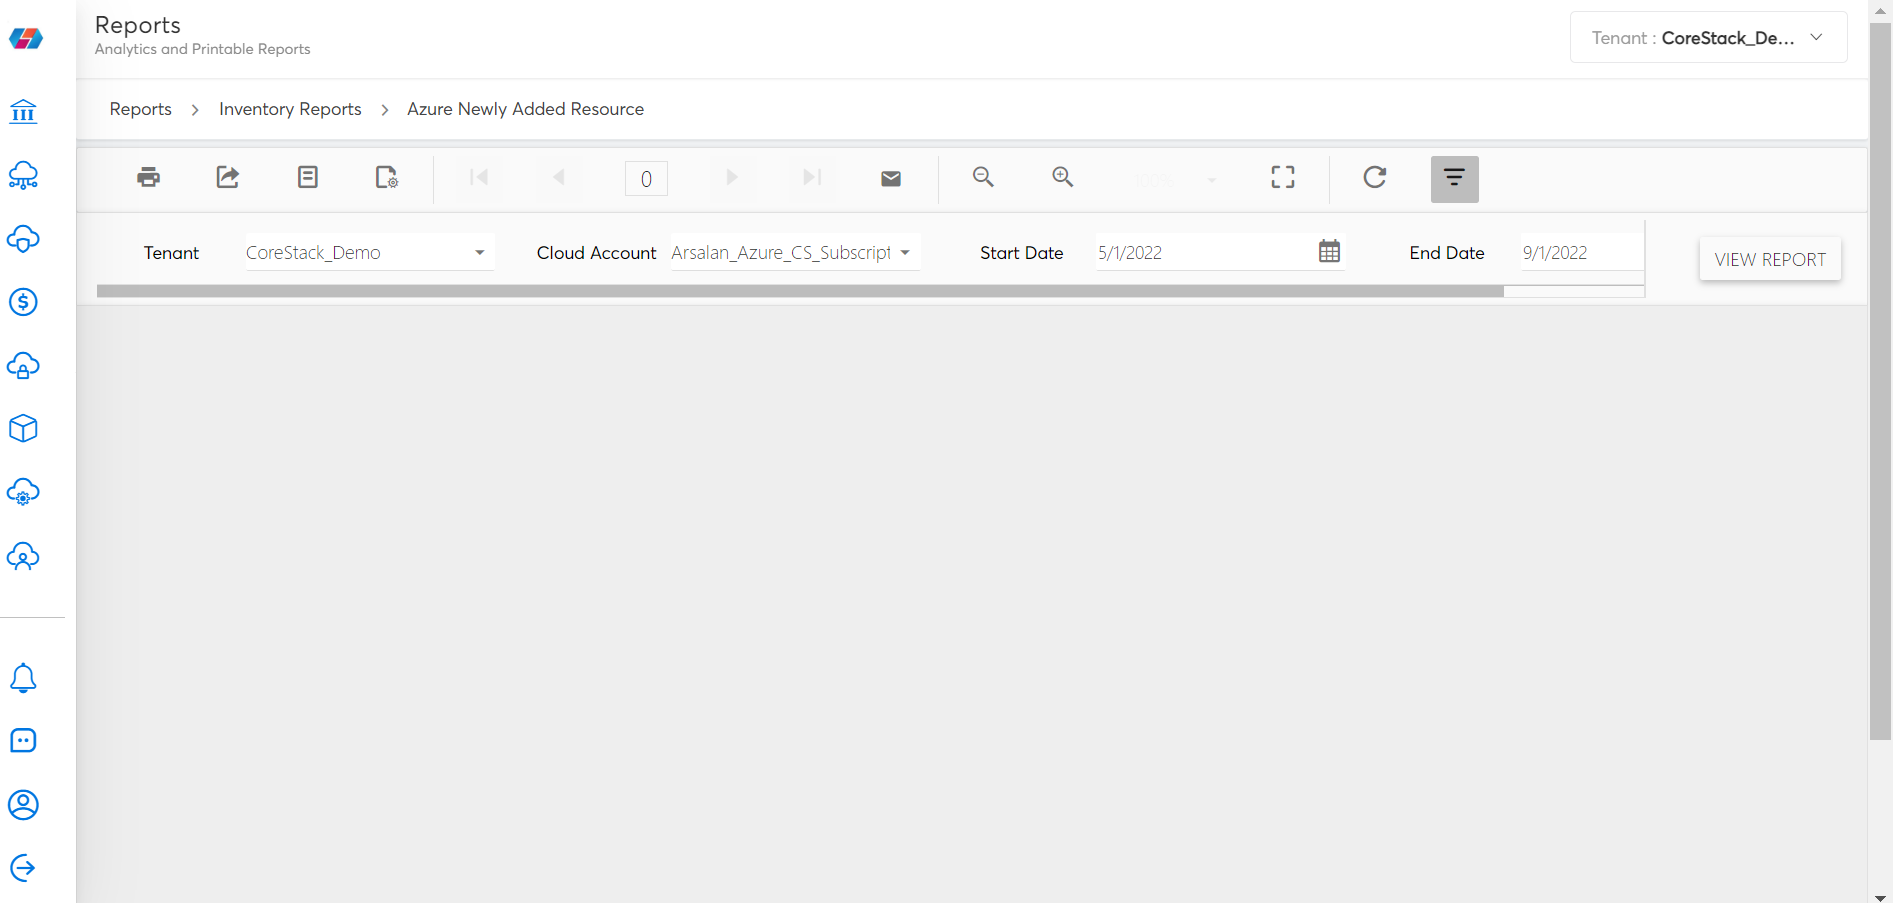
The Azure Newly Added Resource report appears.
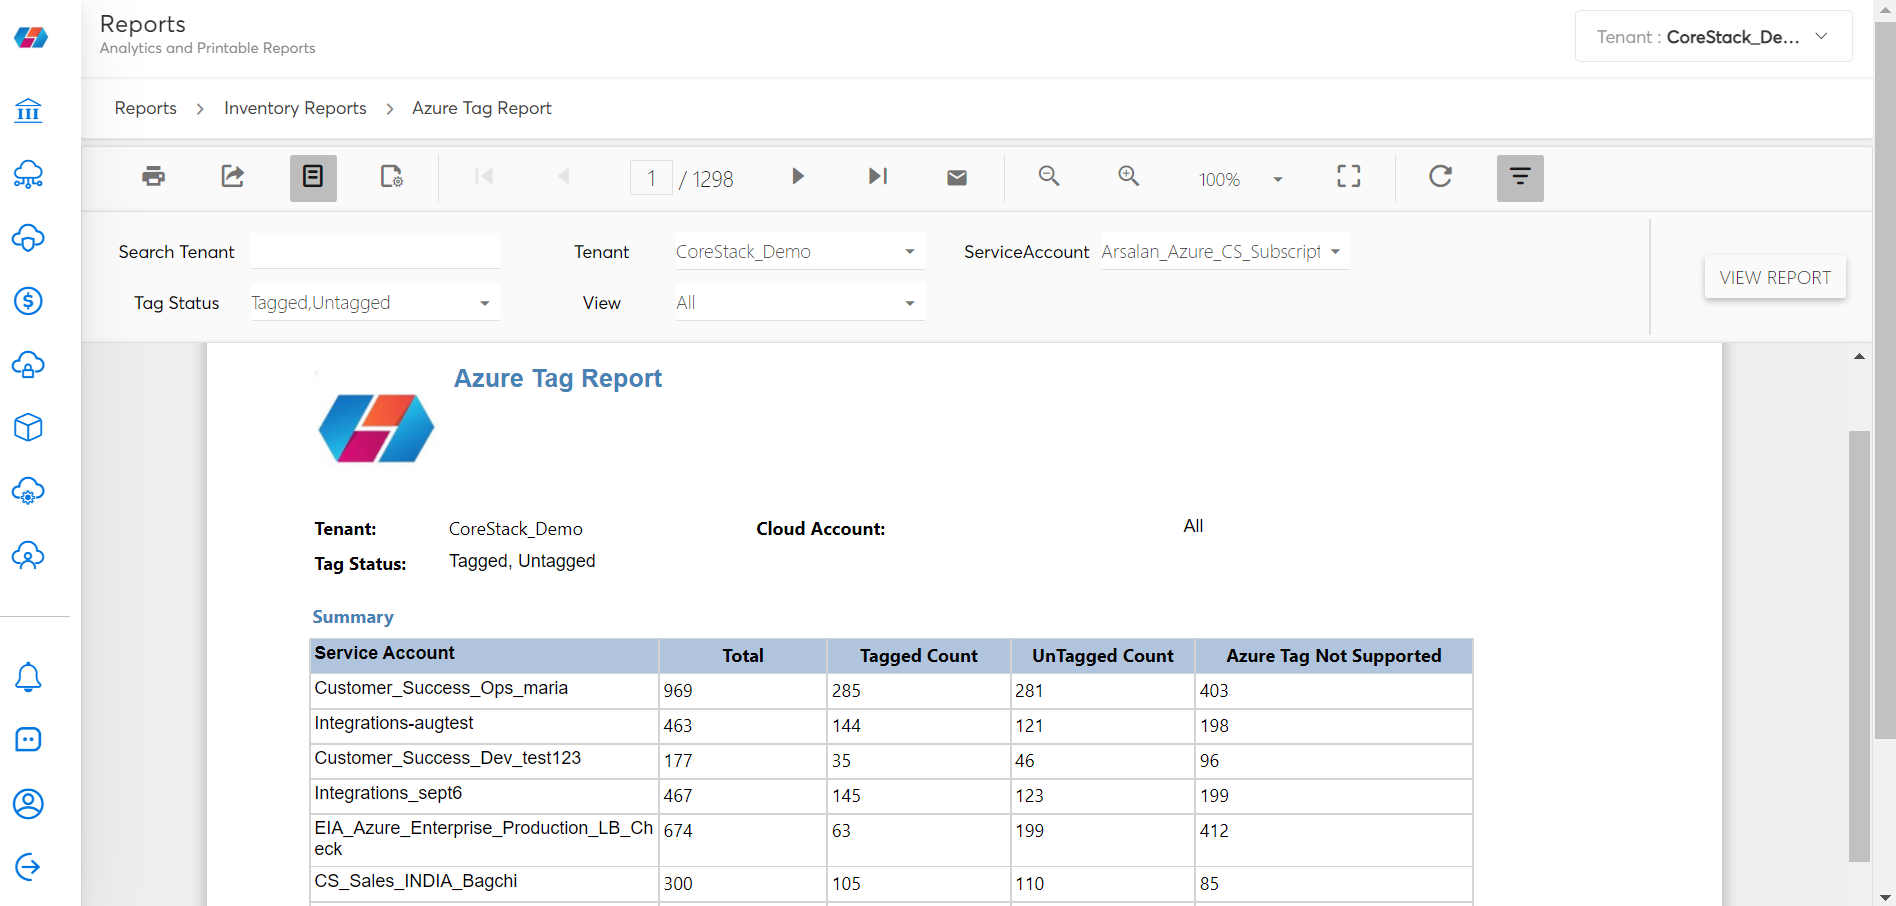
Azure Tag Report
Tags are metadata elements that you apply to your Azure resources. They are key-value pairs that help you identify resources based on settings that are relevant to your organization. You can apply tags to your Azure resources, resource groups, and subscriptions.
- Click Reports.
- Click Resource.
- Click Azure.
- Click Inventory Reports.
- Click Azure Tag Report.
- Add Tenant, Cloud Account, Start Date and End Date.
- Click View Report.
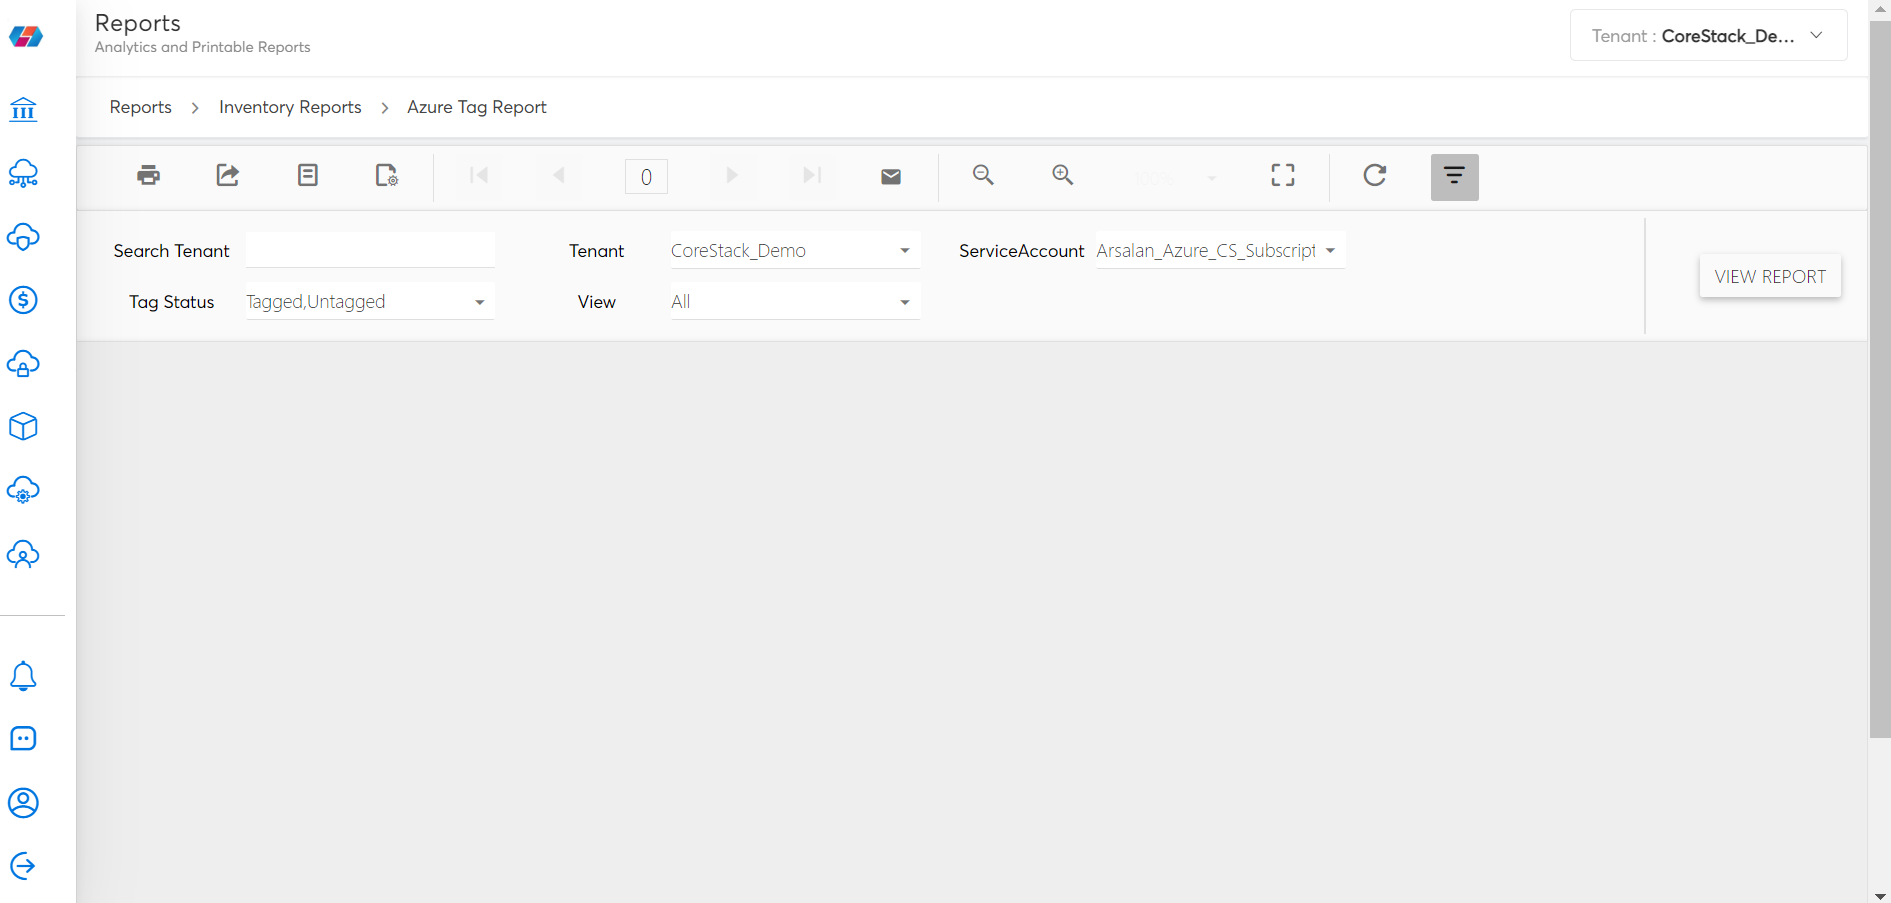
The Azure Tag Report appears.
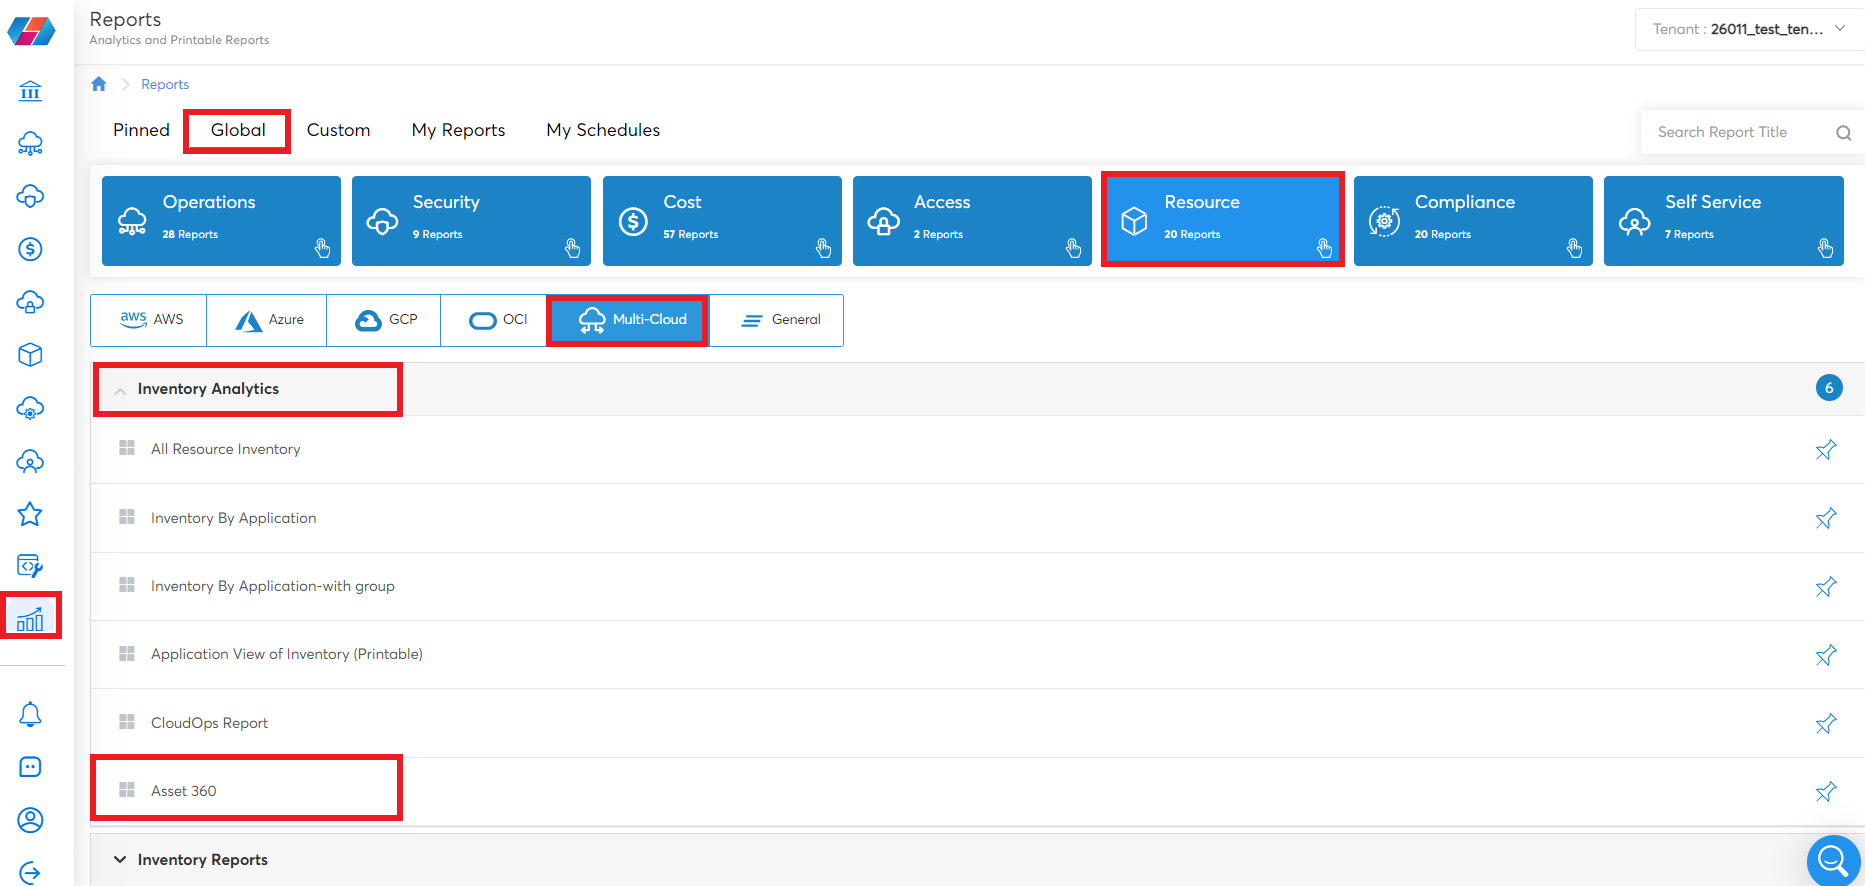
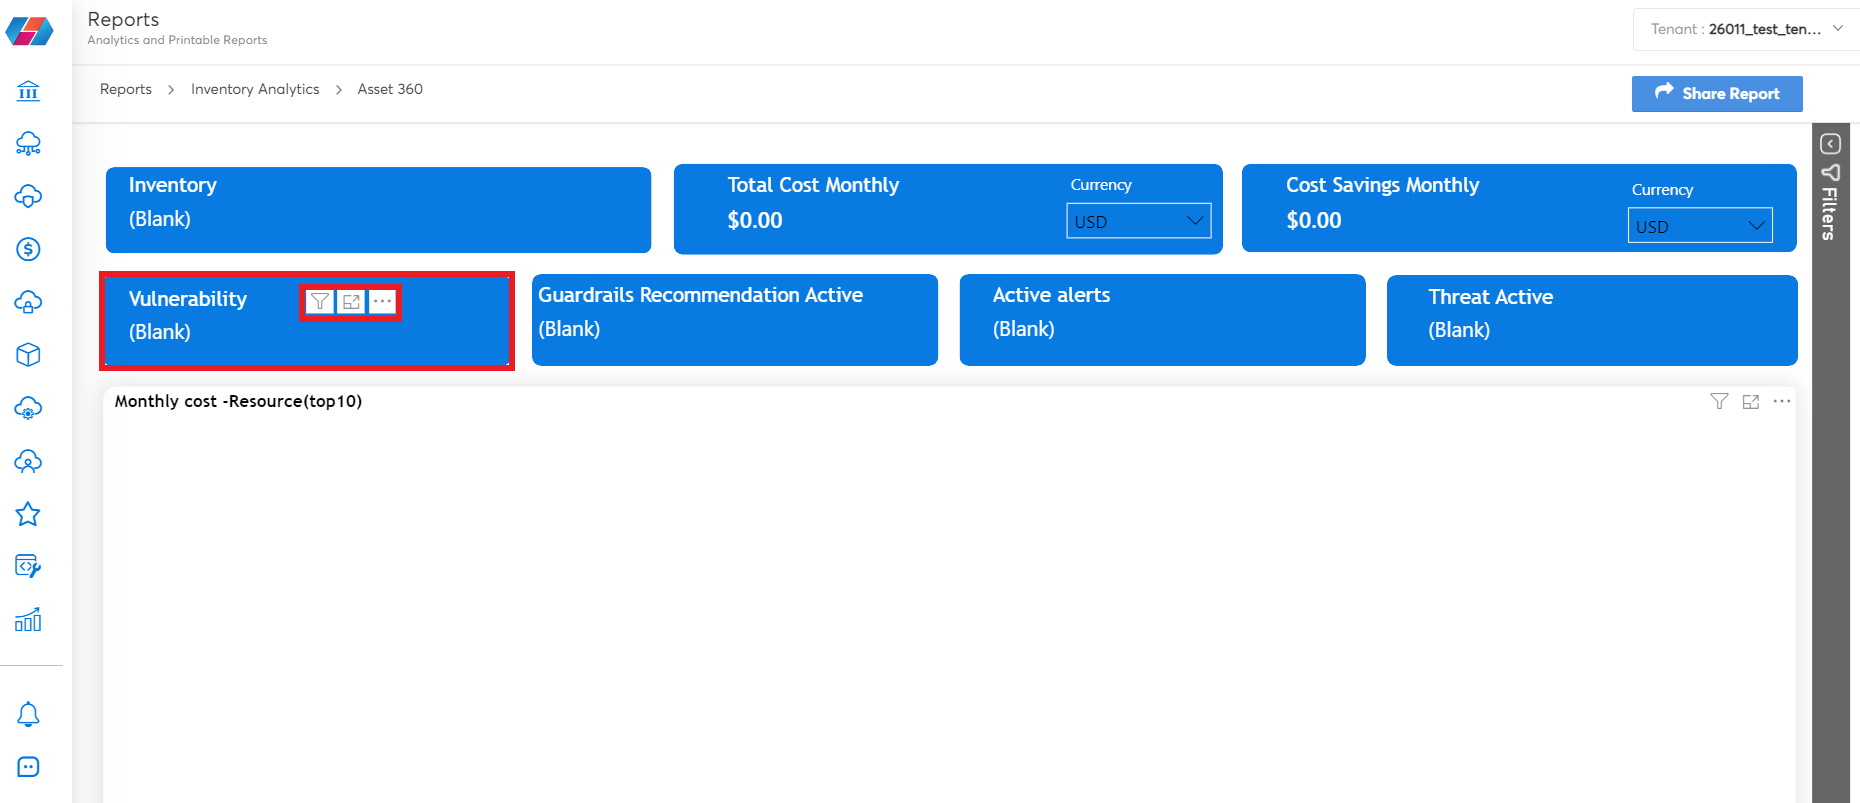
Asset 360 Report
The Asset 360 Report is a perspective report based on inventory. This report provides details about costs, security threats or vulnerabilities for particular resources, guardrail recommendations to be optimized, etc. This report provides a high-level, 360-degree view of details related to cloud inventories.
To view the Asset 360 Report, in the CoreStack application, click Reports > Global > Resource > Multi Cloud > Inventory Analytics > Asset 360.
A user can view the following details in the Asset 360 Report:
- Inventory: Shows the inventory count.
- Total Cost Monthly: Shows the total monthly cost.
- Cost Savings Monthly: Shows cost saving monthly amount.
- Vulnerability: Shows the vulnerability count.
- Guardrails Recommendation Active: Shows the active Guardrails Recommendation count.
- Active Alerts: Shows the count of active alerts.
- Threat Active: Shows the count of active threats.
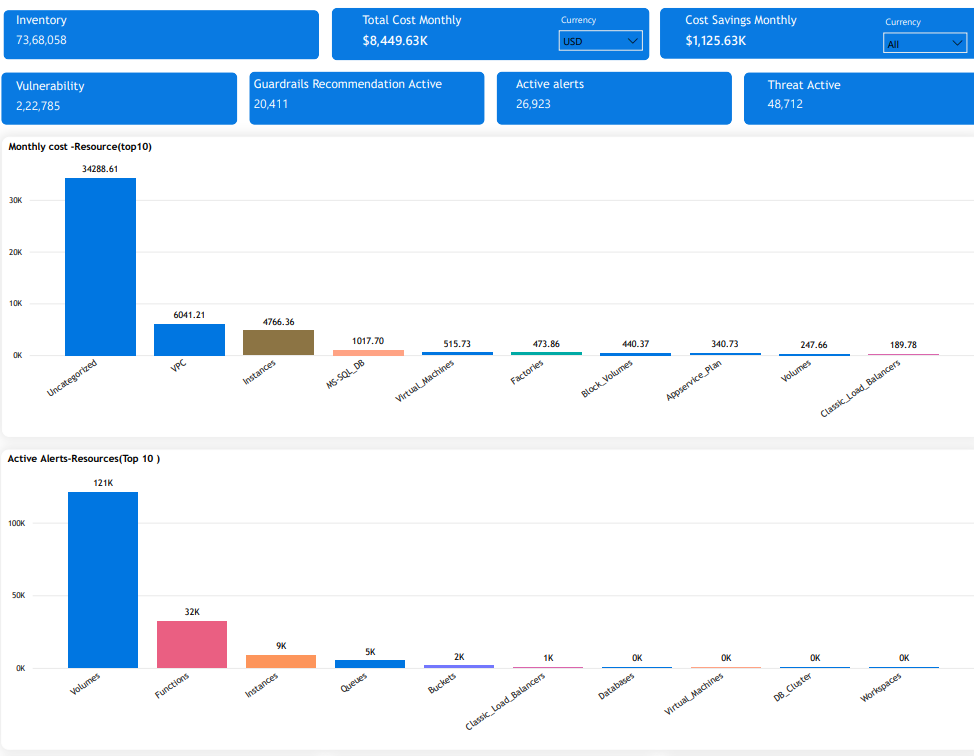
- Monthly Cost-Resource (Top 10): Shows the trend of top 10 resources as per cost.
- Active Alerts-Resources (Top 10): Shows the trend of active alert resources as per cost.
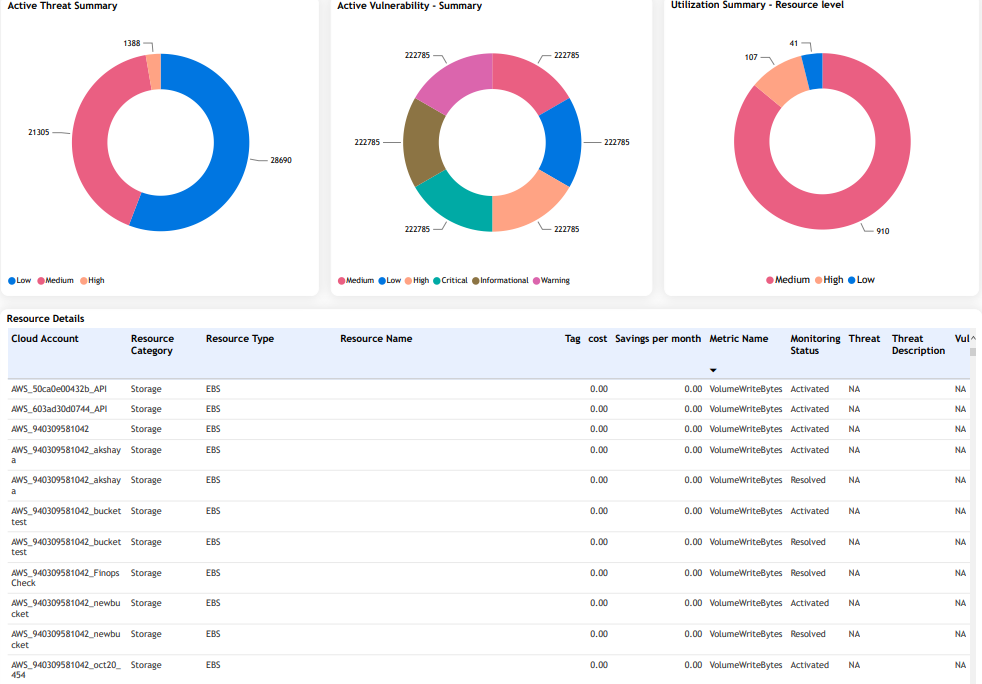
- Active Threat Summary: Shows the count of active threats as per severity.
- Active Vulnerability – Summary: Shows the count of active vulnerabilities as per severity.
- Utilization Summary – Resource Level: Shows the resource level utilization summary as per severity.
- Resource Details: Shows all the resource details such as resource type, resource name, resource category, threats, cost saving details, etc, in tabular format.
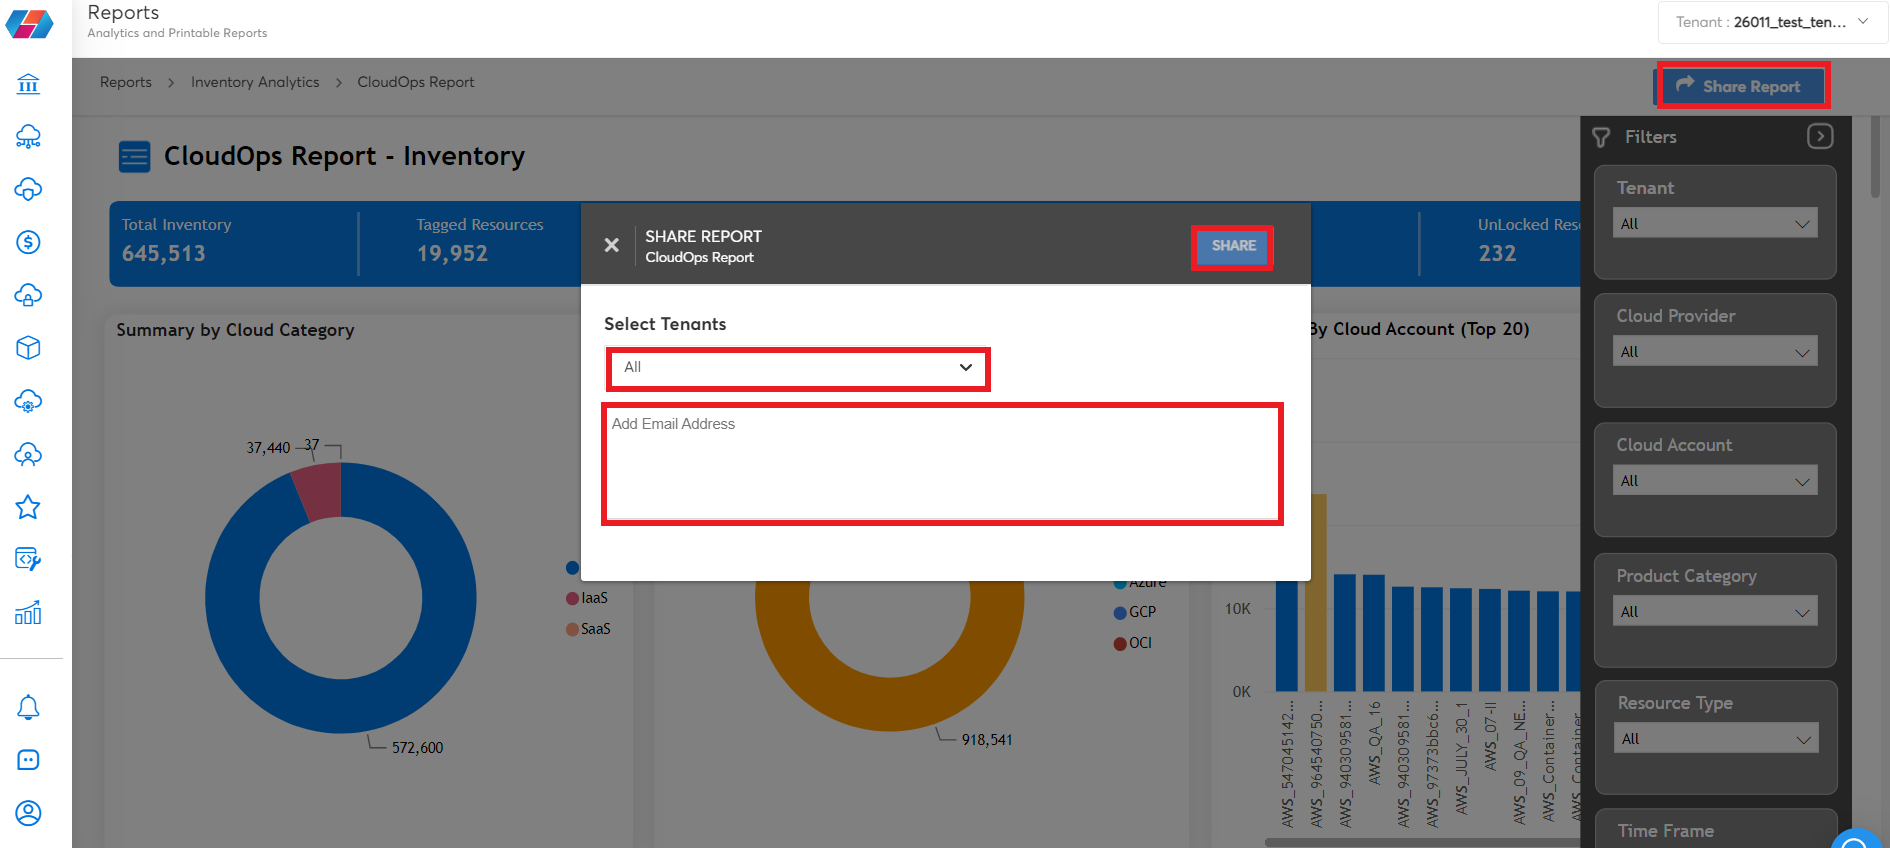
To share the report, perform the following steps:
- Click Share Report.
- In the SHARE REPORT dialog box, in the Select Tenants list, select the tenants with whom the report needs to be shared, and click Apply.
- In the Add Email Address text box, type the email address of the recipient.
- Click SHARE.
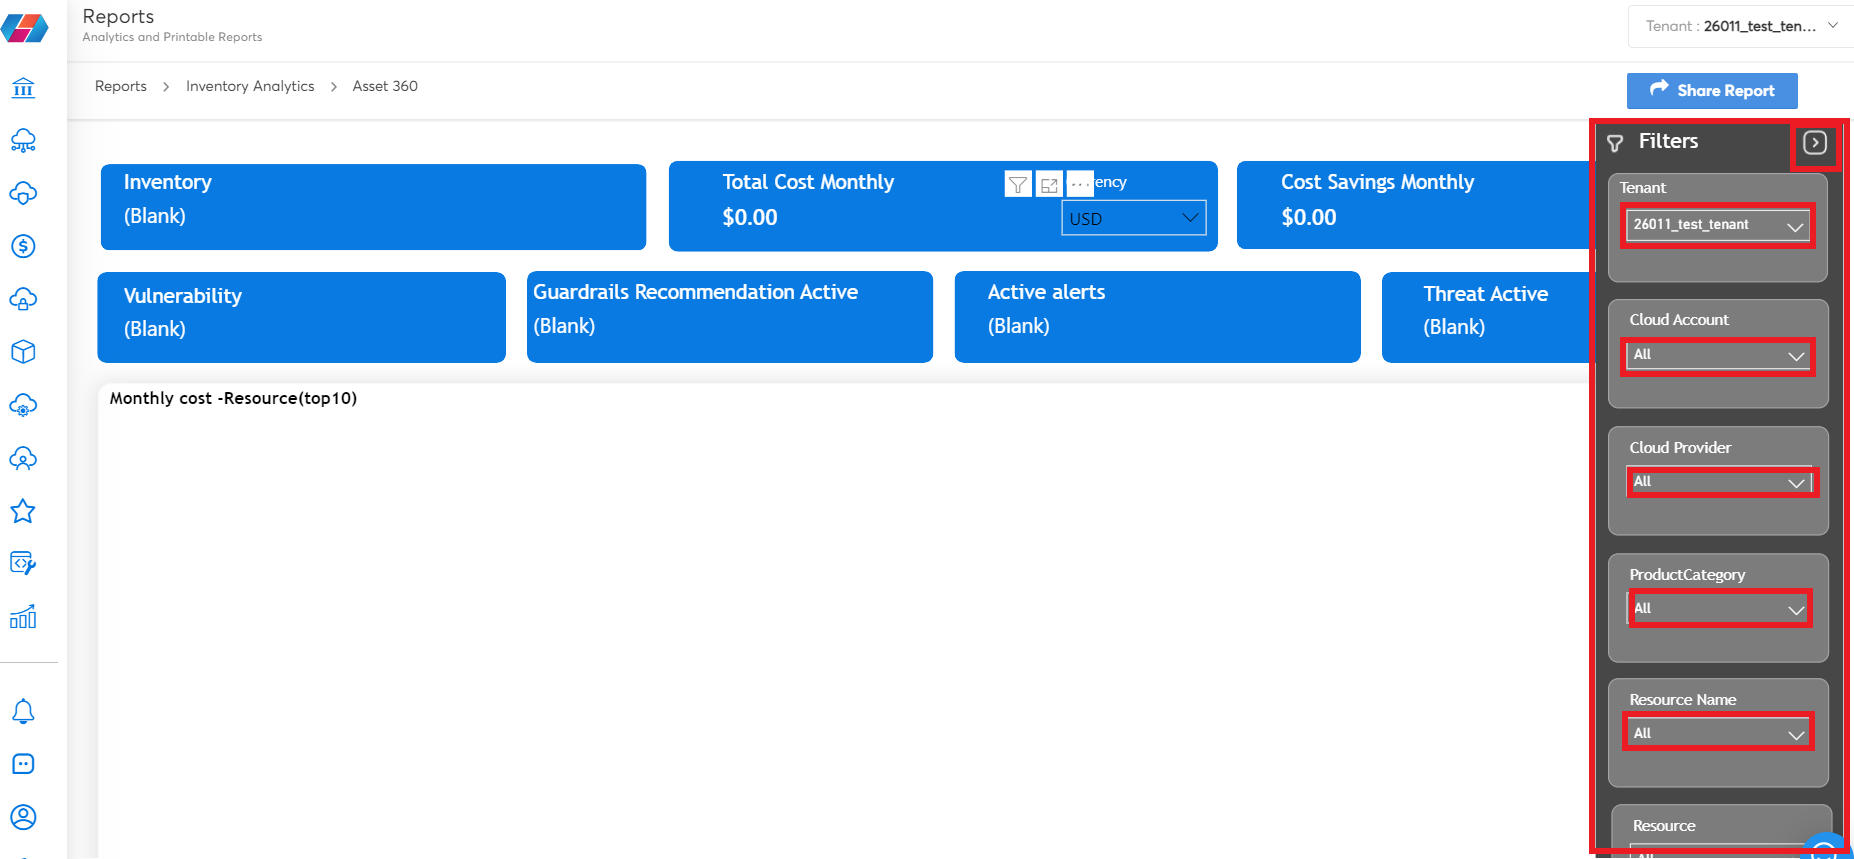
To view specific information in the Asset 360 report, the user can apply any appropriate filters and view the report.
Perform the following steps to apply filters to a report:
-
On the filter pane located on the right side of the screen, click the arrow icon.
-
In the various fields that are displayed on the filter pane, click to select relevant option(s):
- Tenant
- Cloud Provider
- Cloud Account
- Product Category
- Resource Type
- Resource
- To apply additional filters, choose a rectangular box, and select a relevant option from among the available options:
- Filters on Visual
- Focus mode
- More options
The report is displayed as per the selected options in the filter pane.
Note: Click Clear Filter to reset the filter selections.
Updated over 1 year ago