
Cost Analytics
Introduction
The Cost Analytics section allows you to review your billing data in a fully-featured reporting structure, providing you with complete visibility and cost intelligence through detailed reporting and filtering.
Reports
| Report Group | Report Name | Report Description |
|---|---|---|
| Cost Reports | AWS Orphaned Resources | Report of orphaned resources. |
| Cost Reports | Multi Tenant AWS Consolidated Charges Report | Report of AWS cloud account costs/charges across different charge types like SavingsPlanCoveredUsage, Tax, SavingsPlanNegation, Usage, etc. |
| Cost Reports | AWS Consolidated Charges with Markup | Report of a per-account, monthly summary of AWS costs with the option to apply charge types like markups, discounts, credit, RI Fee, Tax etc. |
| Cost Reports | AWS Consolidated Charges | Report of a single tenant monthly summary of AWS costs, allowing customers to understand their expenditures and group them by product code and resource usage. Users can customize the report using filters for product code, charge type, top 100 resource filters, etc. |
| Cost Reports | Azure Orphaned Resources | Report of orphaned resources intended to help end-users optimize costs. |
| Cost Reports | Azure Consolidated Charges with Markup | Report of consolidated markup charges across the resources in the user’s subscription. |
| Cost Reports | Azure Detailed Daily Report | Report of multi-tenant, multi-cloud account daily cost report for Azure. |
| Cost Reports | Azure Consolidated Charges | Report of consolidated Azure Billing information. |
| Cost Reports | Azure VM Cost Report | Report of costs for a VM and its attached resources like storage, bandwidth, and network for a specific cloud account. |
| Cost Reports | RI Compute Report | Report of Reserved Instance (RI) intended to help users save money. |
| Cost Reports | GCP Orphaned Resources | Report of orphaned resources that are no longer in use or have been forgotten, but are still present in the customer's GCP environment, consuming resources and incurring costs. |
| Cost Reports | GCP Consolidated Charges with Markup | Report of billing features that allow GCP customers who work with a service provider or reseller to receive a single invoice covering all their GCP usage, with the addition of a markup or margin for the service provider. |
| Cost Reports | GCP Consolidated Charges | Report of consolidated GCP Billing information. |
| Cost Reports | GCP VM Cost Report | Report of costs for a VM and its attached resources like storage, bandwidth, and network for a specific cloud account. |
| Cost Reports | OCI Consolidated Charges | Report of consolidated charges for all resources within the selected compartment or group of compartments, broken down by service and usage type. |
| Cost Reports | OCI Consolidated Charges with Markup | Report of consolidated charges for all resources within the selected compartment or group of compartments, broken down by service and usage type. This includes any markup that has been applied. |
| Cost Usage Reports | Resource Group-Wise Usage Cost | Report of total usage cost details in a particular currency by resource group for a particular service/cloud account. |
| Cost Usage Reports | Azure Reservation Utilization | |
| Cost Recommendations | Azure RI Recommendation | Report of ways to save money on your Azure infrastructure costs by committing to a specific instance type and payment term. |
| Partner Cost Reports | Azure CSP Consolidated Charges | Report of billing feature that allows Azure customers who purchase Azure services through a Cloud Solution Provider (CSP) partner to receive a single invoice covering all their Azure usage, rather than separate invoices for each individual subscription. |
| Partner Cost Reports | Azure EA Consolidated Charges | Report of billing features that allow Azure customers who have an Enterprise Agreement (EA) to receive a single invoice covering all their Azure usage, rather than separate invoices for each individual subscription. |
| Partner Cost Reports | Azure CSP Cost Monthly | Report of multi-tenant, multi-cloud account monthly cost reports for Azure CSP accounts. |
| Partner Cost Reports | Azure EA Cost Monthly | Report of multi-tenant, multi-cloud account monthly cost reports for Azure EA accounts. |
| Cost Analytics | AWS Cost Monthly | Report on monthly billing costs for selected AWS accounts. |
| Cost Analytics | AWS Cost Daily | Report on daily billing costs for selected AWS accounts. |
| Cost Analytics | Azure Cost Monthly Global Currency | Report of multi-tenant, multi-cloud account monthly costs. |
| Cost Analytics | Azure Cost Daily | Report on daily billing costs for selected Azure subscriptions. |
| Cost Analytics | Azure Cost Monthly | Report on monthly billing costs for selected Azure subscriptions. |
| Cost Analytics | GCP Parent Billing Account | Report of special type of GCP account that is used to manage billing and payments for all projects and resources within a GCP organization. |
| Cost Analytics | GCP Cost Monthly | Report on monthly billing costs for selected GCP projects. |
| Cost Analytics | GCP Cost Daily | Report on daily billing costs for selected GCP projects. |
| Cost Analytics | OCI Cost Daily | This report tracks the Oracle cloud account daily costs for the current month and last month. The dimensions include cloud account, product category, and region. |
| Cost Analytics | OCI Cost Monthly | This report tracks the Oracle cloud account monthly costs for the last 12 months. The dimensions include cloud account, product category, region, and tags. |
| Cost Governance | Cost Assessment Summary | CoreStack Cost Governance Assessment Summary. Read more about it in the Visibility section above. |
| Cost Governance | Cost Assessment Detail Report | CoreStack Cost Governance Assessment Detail Report. Read more about it in the Visibility section above. |
| Cost Reports | Monthly Cost by Cloud Accounts | Report of costs incurred by the cloud account(s) for the selected month(s). Users can view the cost details in different currencies. |
Global Currency Support
A global currency (USD) with custom exchange rates can be configured in the CoreStack platform. These configured, custom exchange rates can be used to calculate and aggregate cost spend across cloud accounts with different billing currencies.
Multiple options are available as global currency, such as: USD, Korean Won, and Chinese Yuan.
- To open an Azure account monthly cost report, navigate to Reports > Cost > Cost Analytics > Azure Cost Monthly.
- To view the report in source currency, select Source Currency.
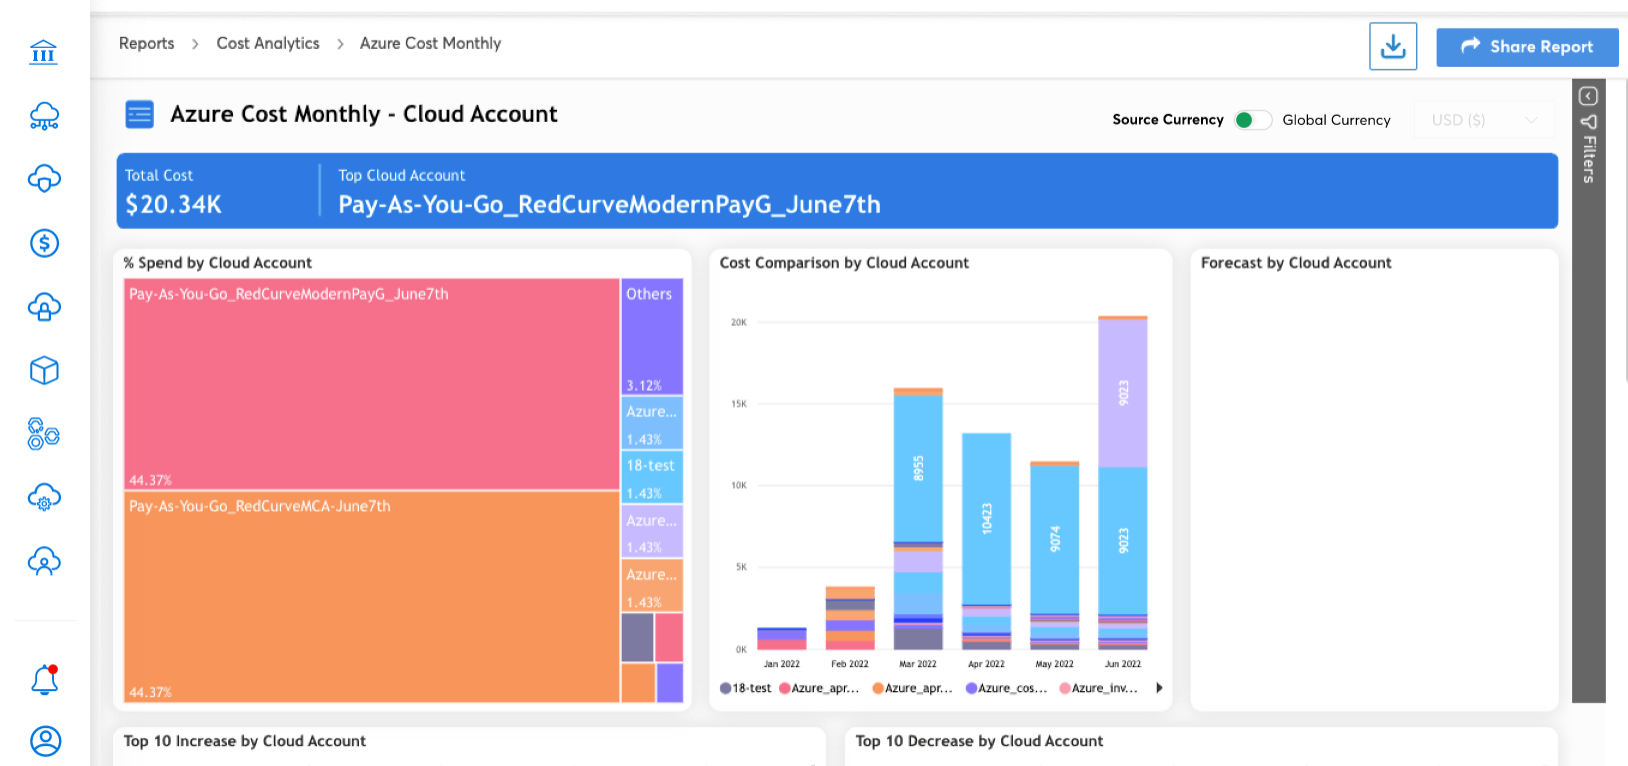
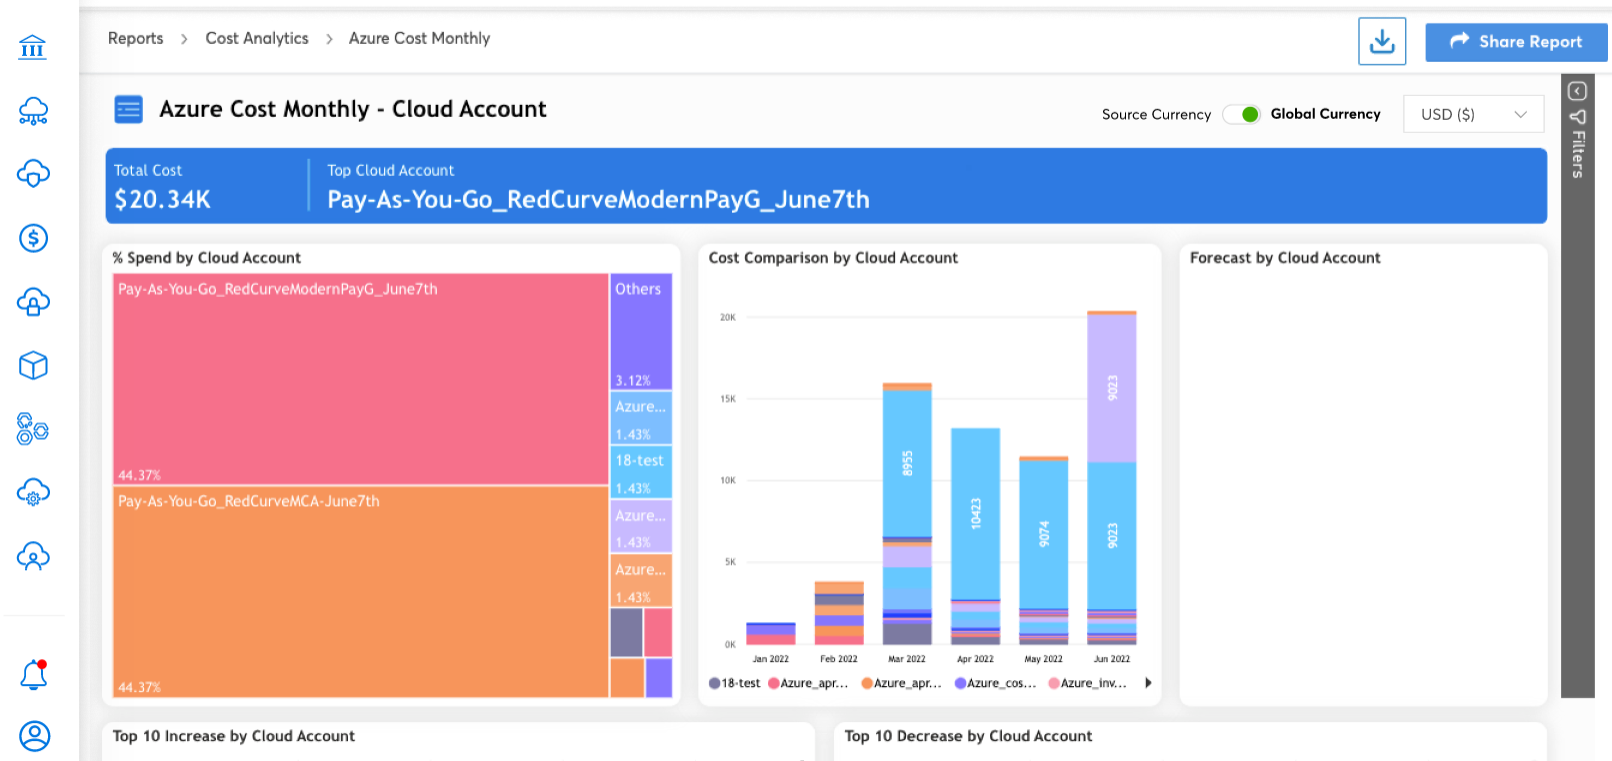
- To view the report in global currency, select Global Currency.
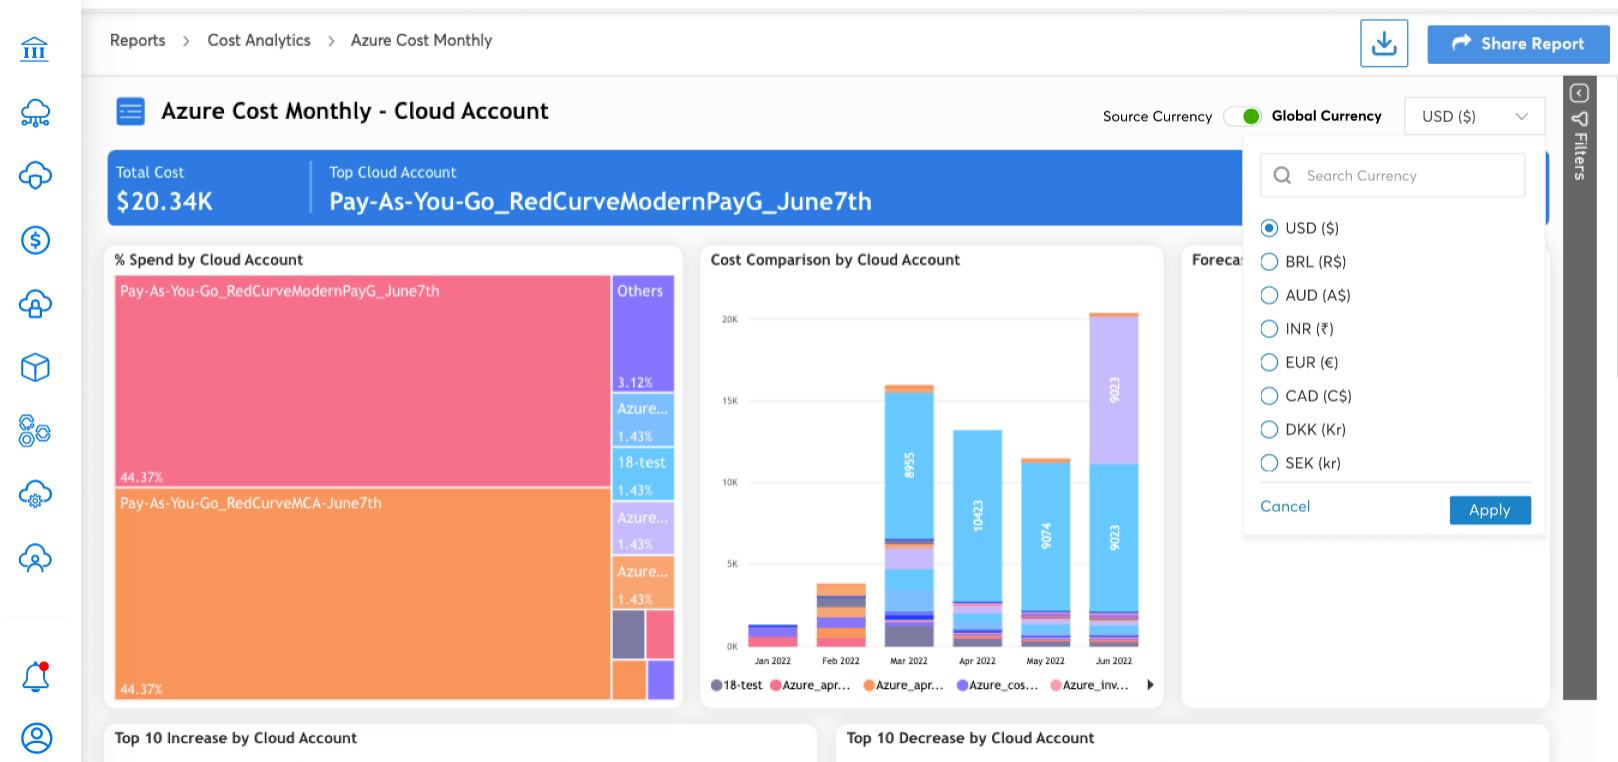
- Under Global Currency, select the desired global currency.
- Click Apply. The Azure account monthly cost report appears in global currency.
Tag Key and Tag Value Filters
Tag Key and Tag Value filters are available for the following cost reports:
- Azure > Cost Analytics > Azure Cost Monthly
- Azure > Cost Analytics > Azure Cost Daily
- AWS > Cost Analytics > AWS Cost Monthly
- AWS > Cost Analytics > AWS Cost Daily
- Azure > Partner Cost Report > Azure CSP Cost Monthly
- Azure > Partner Cost Report > Azure EA Cost Monthly
- GCP > Cost Analytics > GCP Cost Monthly
- GCP > Cost Analytics > GCP Cost Daily
- GCP > Cost Analytics > GCP Parent Billing Account
- OCI > Cost Analytics > OCI Cost Monthly
- OCI > Cost Analytics > OCI Cost Daily
A particular tag key can have multiple tag values. A user can select a tag key and all the available tag values for that selected key can be viewed. The user can then select the required tag values and generate any of the cost reports listed above.
To view a cost report as per Tag Key and Tag Value:
-
In the CoreStack application, click Reports > Cost > select a cloud > select a report to view details.
-
On the top-left of the screen, click the blue square tile and then click to select Tag.
-
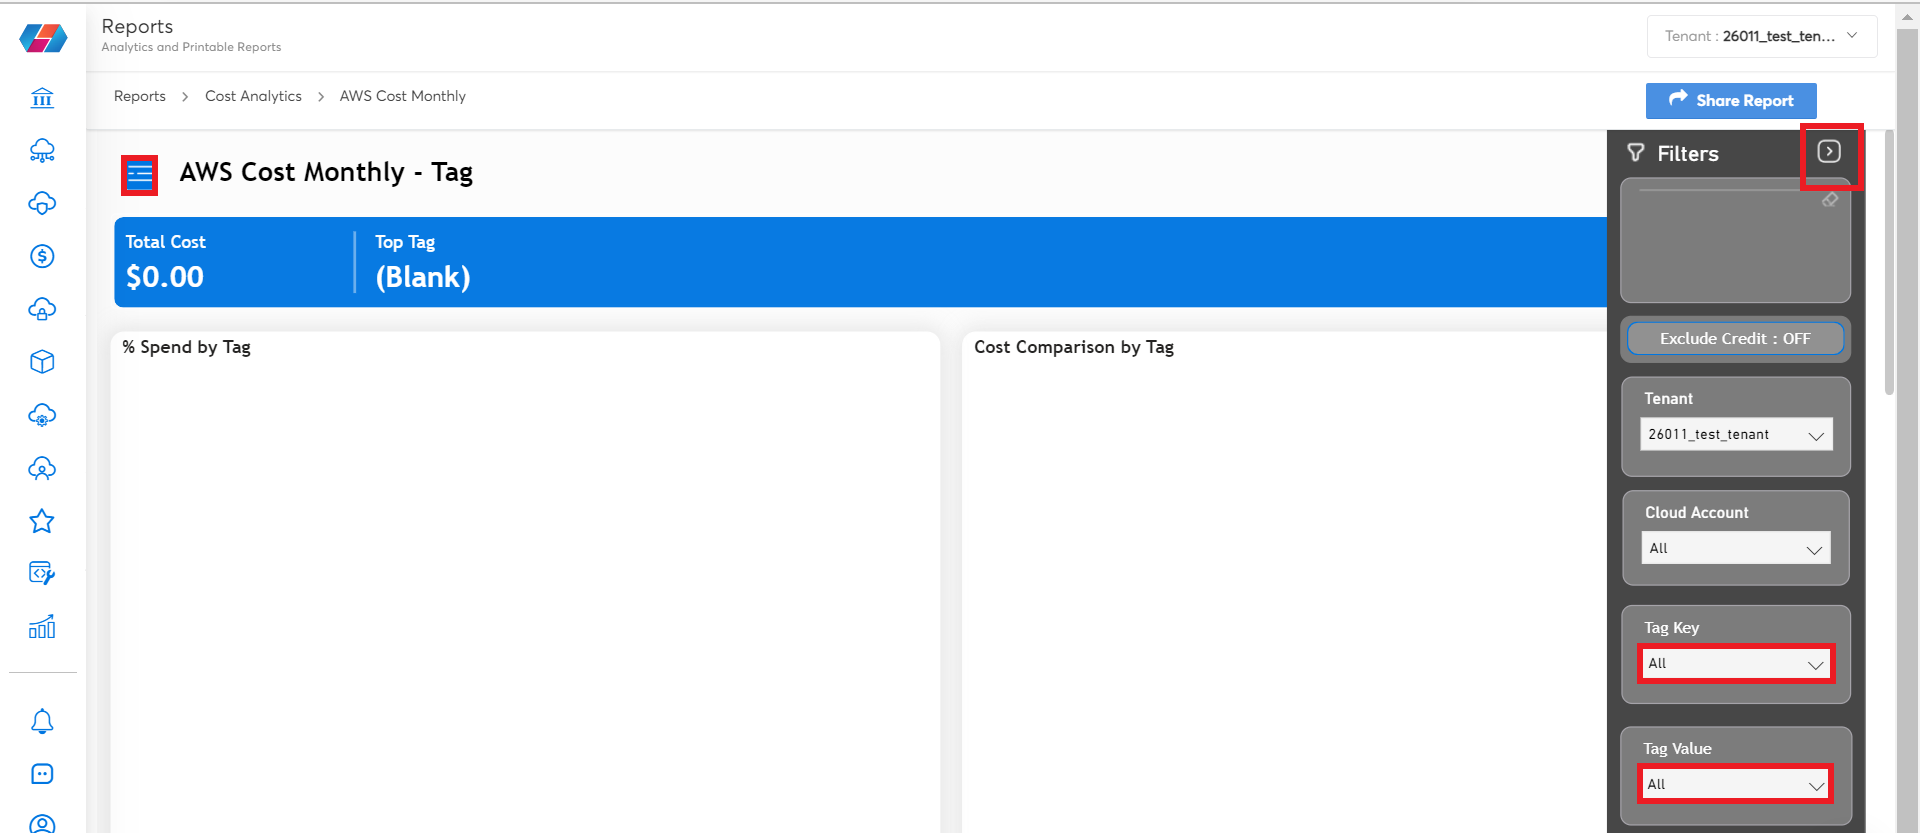
On the vertical pane at the right side of the screen, click the arrow icon.
-
In the Tag Key list, select the relevant keys and in Tag Value list, select the appropriate tag values. The report shows data as per the selected details.
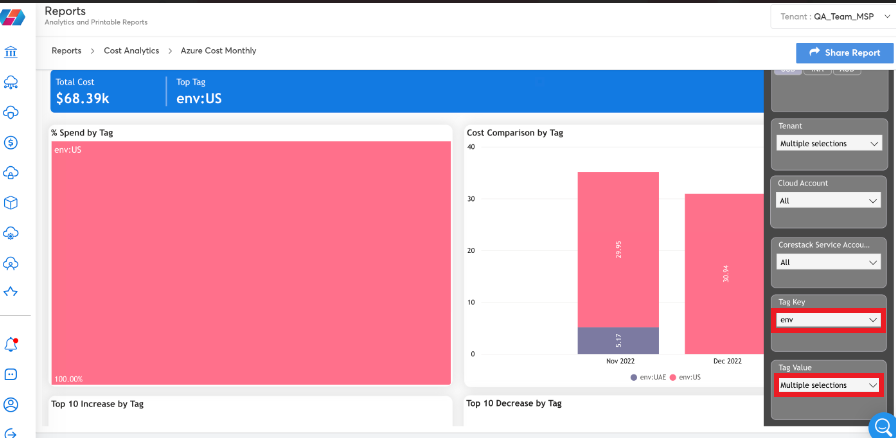
For example, in the screen shown below, in the Tag Key list, the user has selected env. All the tag values that are related to the tag key env will display in the Tag Value list.
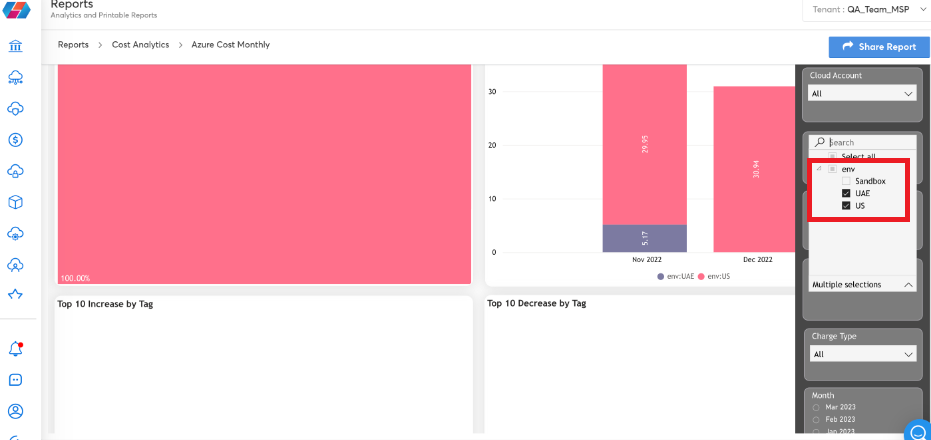
In the screen shown below, the tag key env is mapped to three tag values and in this case, the user has selected the values UAE and US from the Tag Value list. Users can select multiple tag keys and the mapped tag values appear below the corresponding tag key. The user can also refer to the chart that shows on the screen as per the selected tag keys and values.
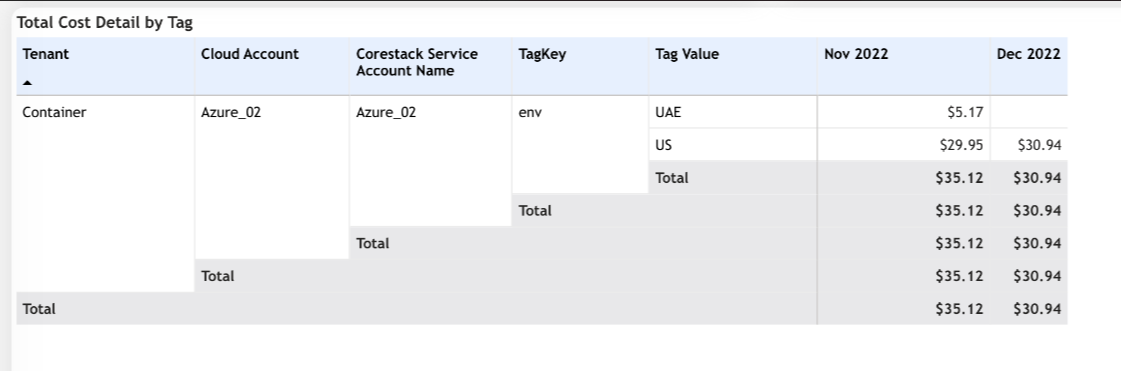
As per the tag keys and values selected by the user, they can view the table Total Cost Detail by Tag with all related details. In this case, users can view the cost information for November 2022 and December 2022 as per the selected tag key and values.
Updated 8 months ago