Security Posture
Introduction
Continuous checks on the security posture of your cloud accounts are essential to maintaining a secure cloud environment. The Security Posture feature in the platform provides information about threats, vulnerabilities, and guardrail findings across your cloud accounts. The summary section provides the consolidated counts across all accounts, and the grid section provides account-specific details.
- Threats: These are consolidated security alerts and threats that originate from cloud-native threat management services such as AWS GuardDuty and Azure Security Center (Standard).
- Vulnerabilities: These are the result of vulnerability assessments of the workloads running in your cloud environments, which are an essential part of cyber security programs. These vulnerabilities are fetched from cloud-native services including AWS Inspector and Azure Security Center across all your cloud accounts.
- Guardrail Findings: These are policy violations identified in your cloud accounts based on the guardrails configured for those accounts. These guardrails are typically comprised of industry standards and best practices, including those recommended by AWS and Azure. Any violations to such checks are listed here so that the appropriate actions can be taken.
Note:
To ensure that CoreStack can fetch threats and vulnerabilities from native cloud services, it’s required that the respective cloud services are enabled in the preferred regions.
Please note that these services are associated with some cost, but they do go a long way in ensuring security and can help save on costs incurred in case of a security breach.
Refer to the following links for pricing details:
- Azure Security Center pricing: https://azure.microsoft.com/en-in/pricing/details/security-center/
- AWS GuardDuty pricing: https://aws.amazon.com/guardduty/pricing/
- AWS Inspector pricing: https://aws.amazon.com/inspector/pricing/
Account Level View
Perform the following steps to view security details for a cloud account:
-
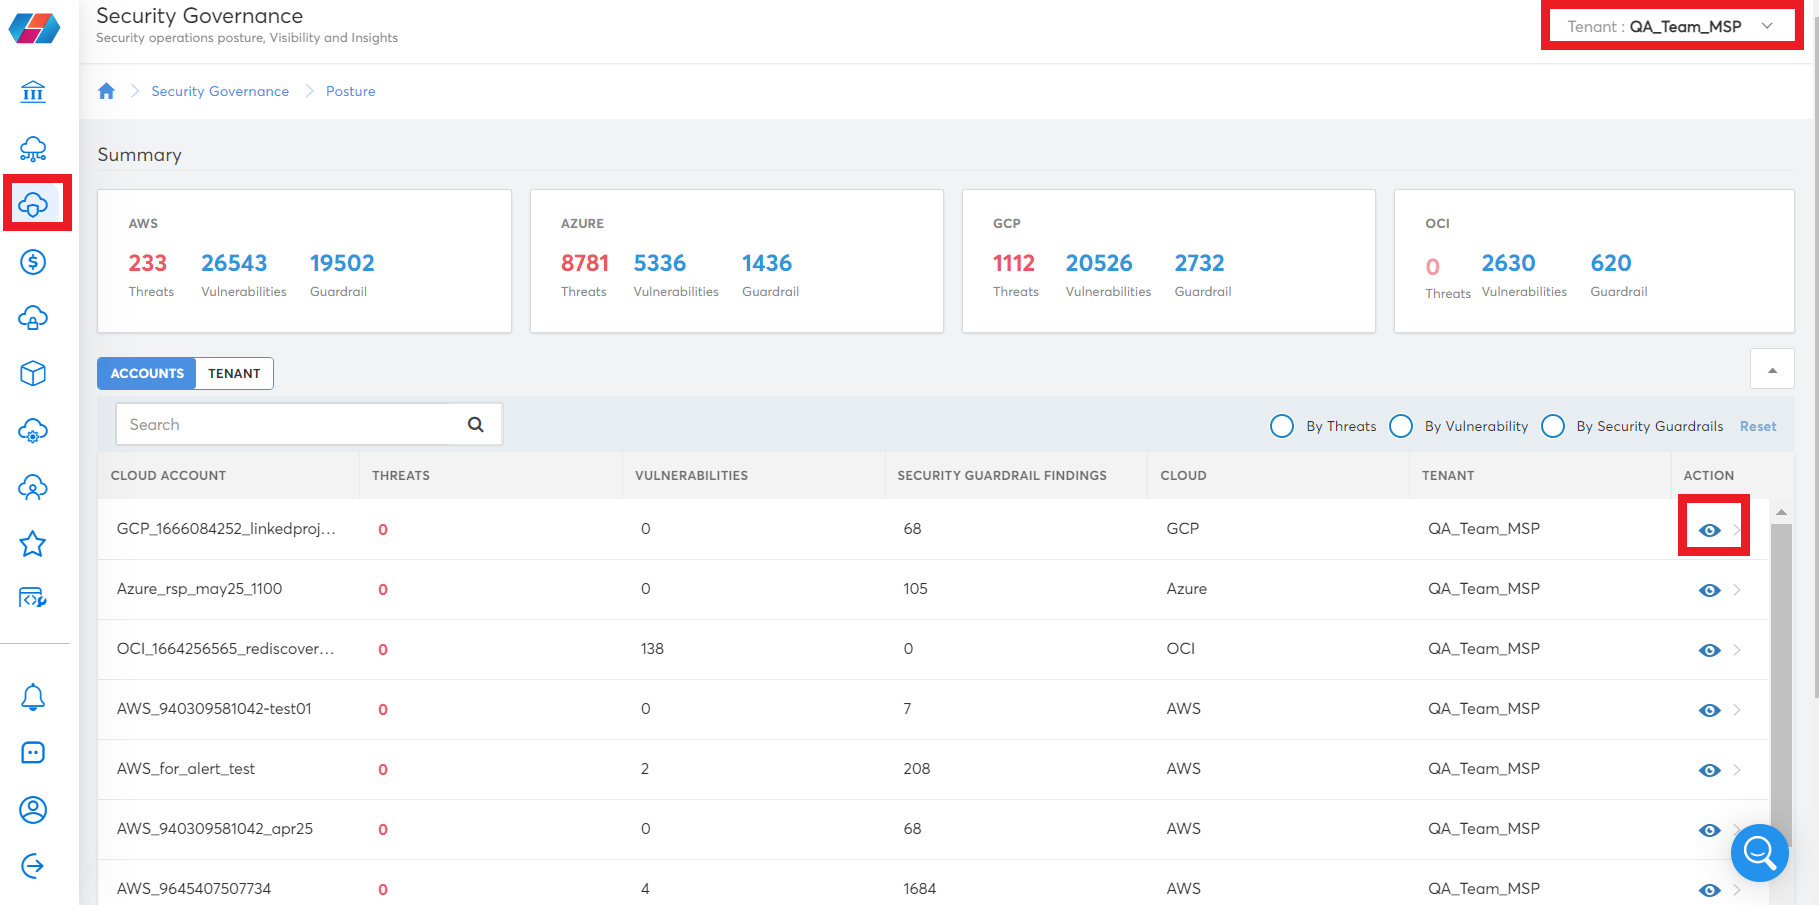
Click Security > Posture.
-
In the top-right corner of the screen, in the Tenant list, click to select a tenant.
-
Click ACCOUNTS to view the list of accounts or click TENANT to view the list of tenants. By default, ACCOUNTS is selected, and all the cloud accounts are displayed.
- Select one option from By Threats, By Vulnerability, and By Security Guardrails to view specific accounts as per the selected option.
- To clear any options selected, click Reset.
- In the Summary section, click any number (in the rectangular boxes) to view the security details for different cloud accounts.
- You can type an account name in the Search box and find that account to view the required details.
-
Click the eye icon corresponding to a specific cloud account to view details about threats, vulnerabilities, and guardrails.
Different graphs are displayed as per severity, resource type, type, geography, etc.
-
Toggle among Threats, Vulnerabilities, and Guardrails tabs. Based on your selection, you can view graphs and tables for the corresponding security issue.
-
To view security issues related to a specific cloud account, in the Cloud list, click to select a cloud service provider and in the Account list, click to select the account. Graphs and tables specific to that account are displayed.
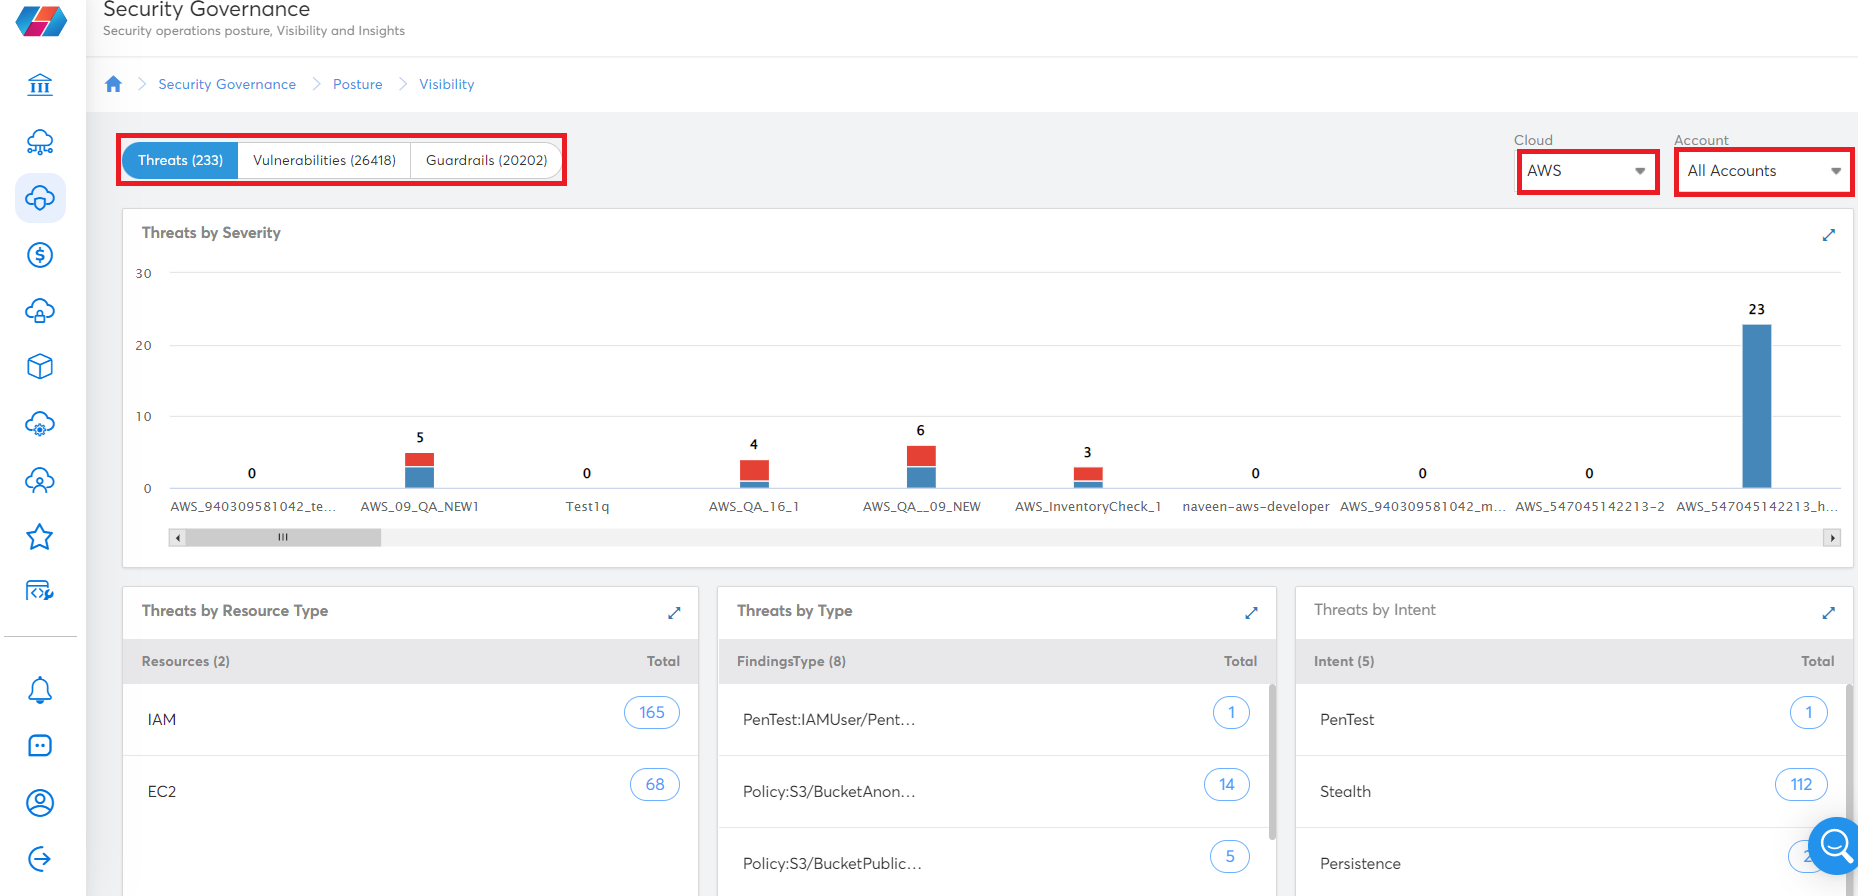
- To view the violation details in tabular format, do one of the following:
- Click any vertical bar on the bar chart. The bar chart displays in maximized view. Click the bar again to view detailed violation information in tabular format.

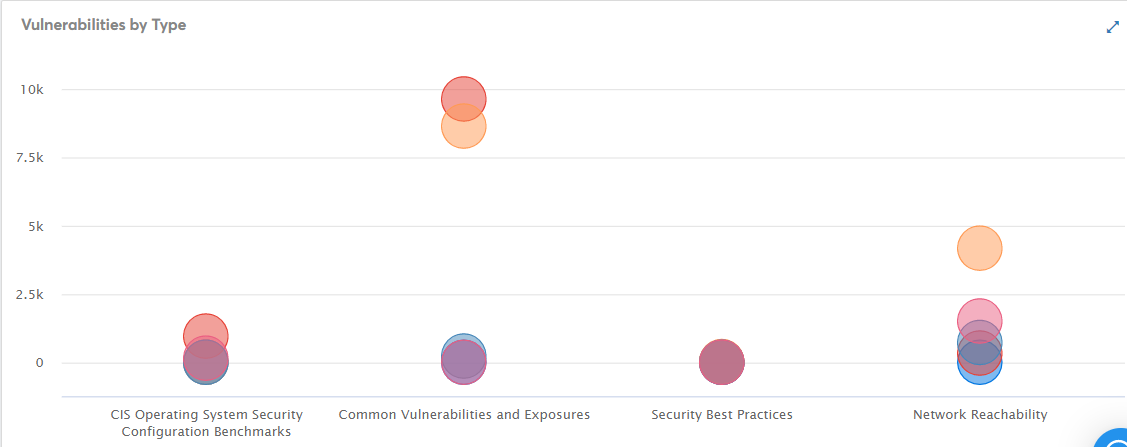
- If a graph has circles, then click on a circle. A maximized view displays. Click the circle again to view the details in tabular format.
- Click VIEW ALL and on the next screen, click the number on the table. The violation details are displayed in tabular format.
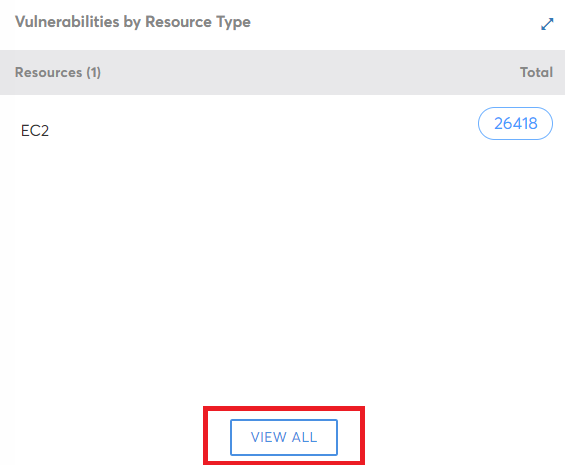
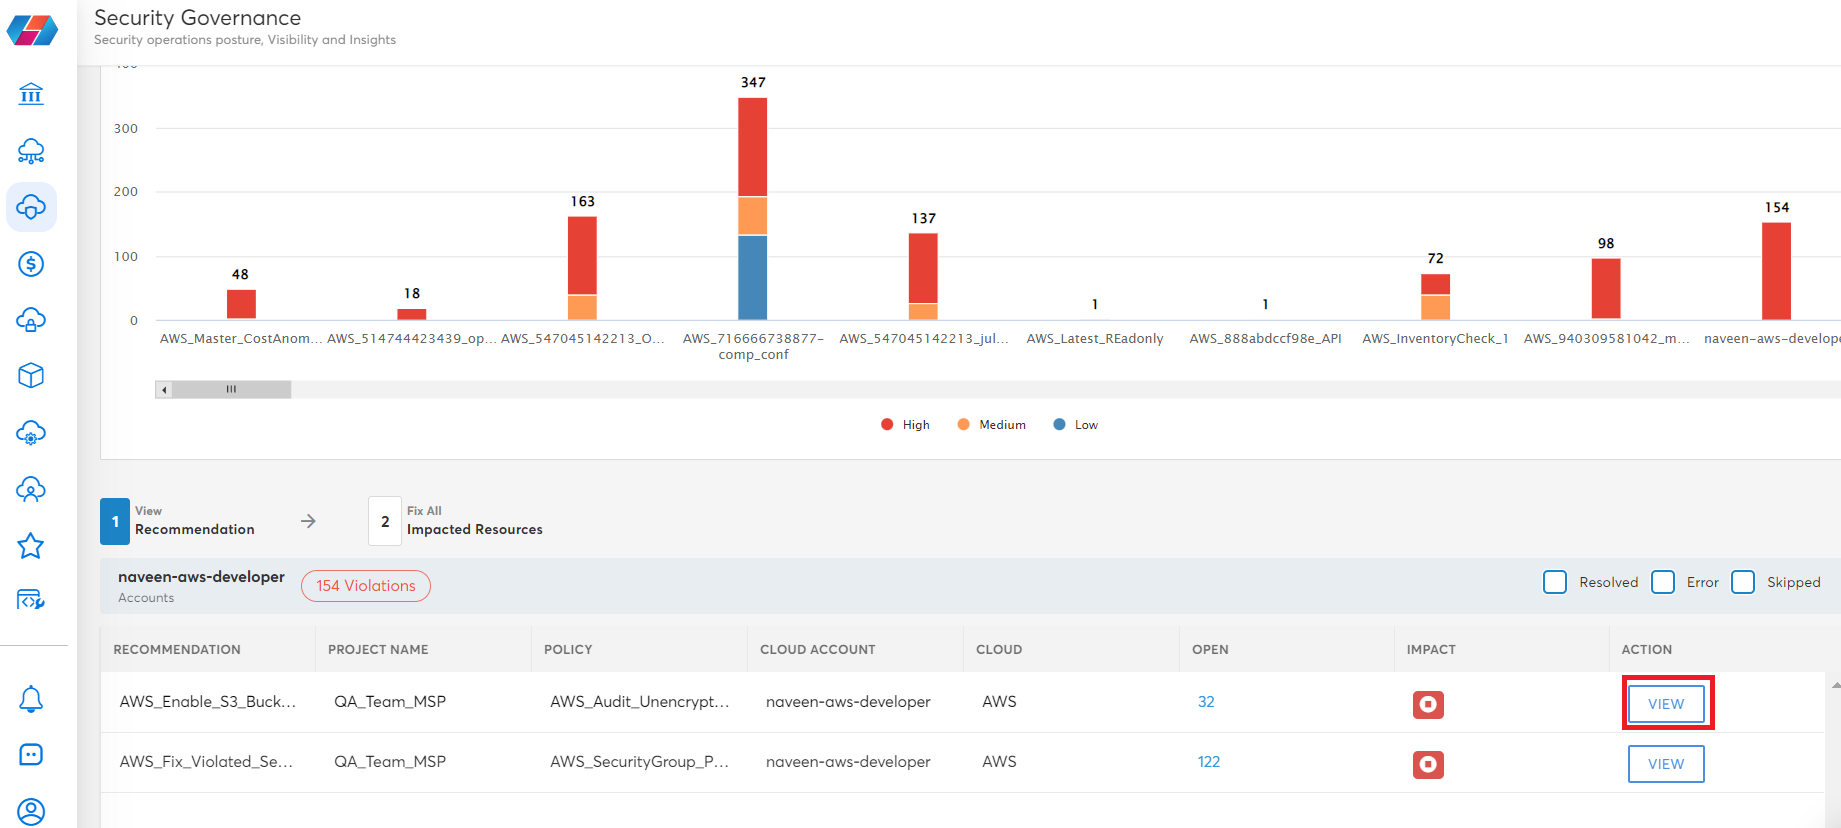
- To take action on a particular recommendation, click VIEW.
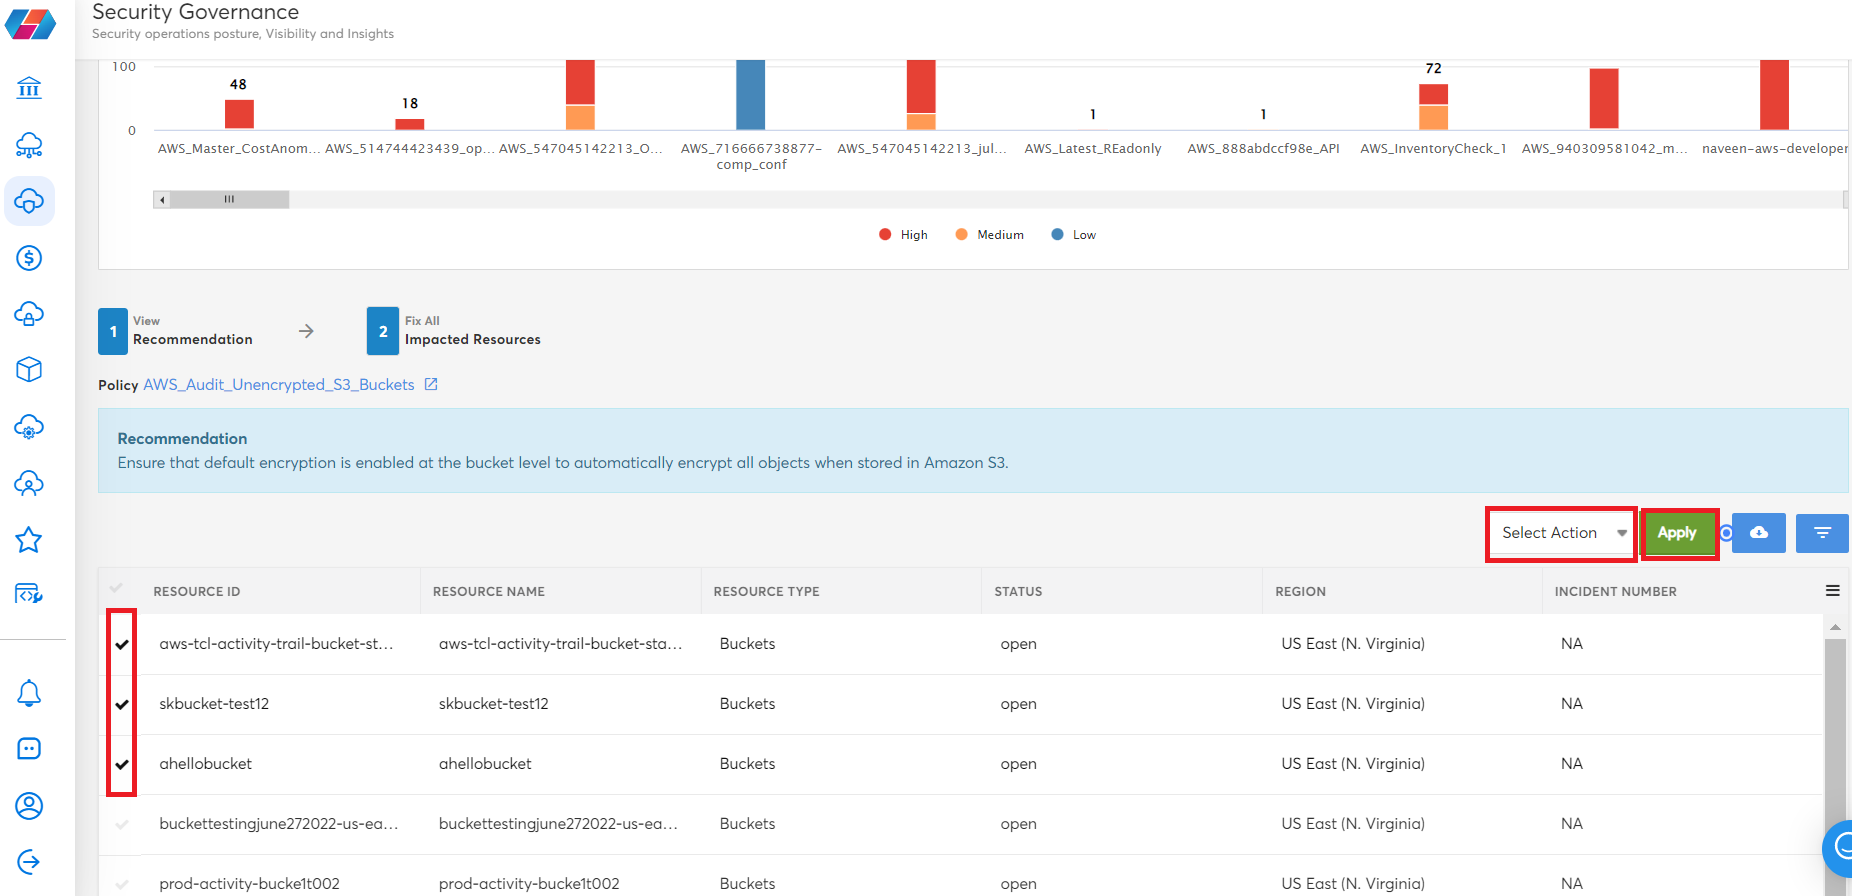
- On the next screen, click to select the resource IDs (multiple resource IDs can be selected), in the Select Action list, select an option, and click Apply.
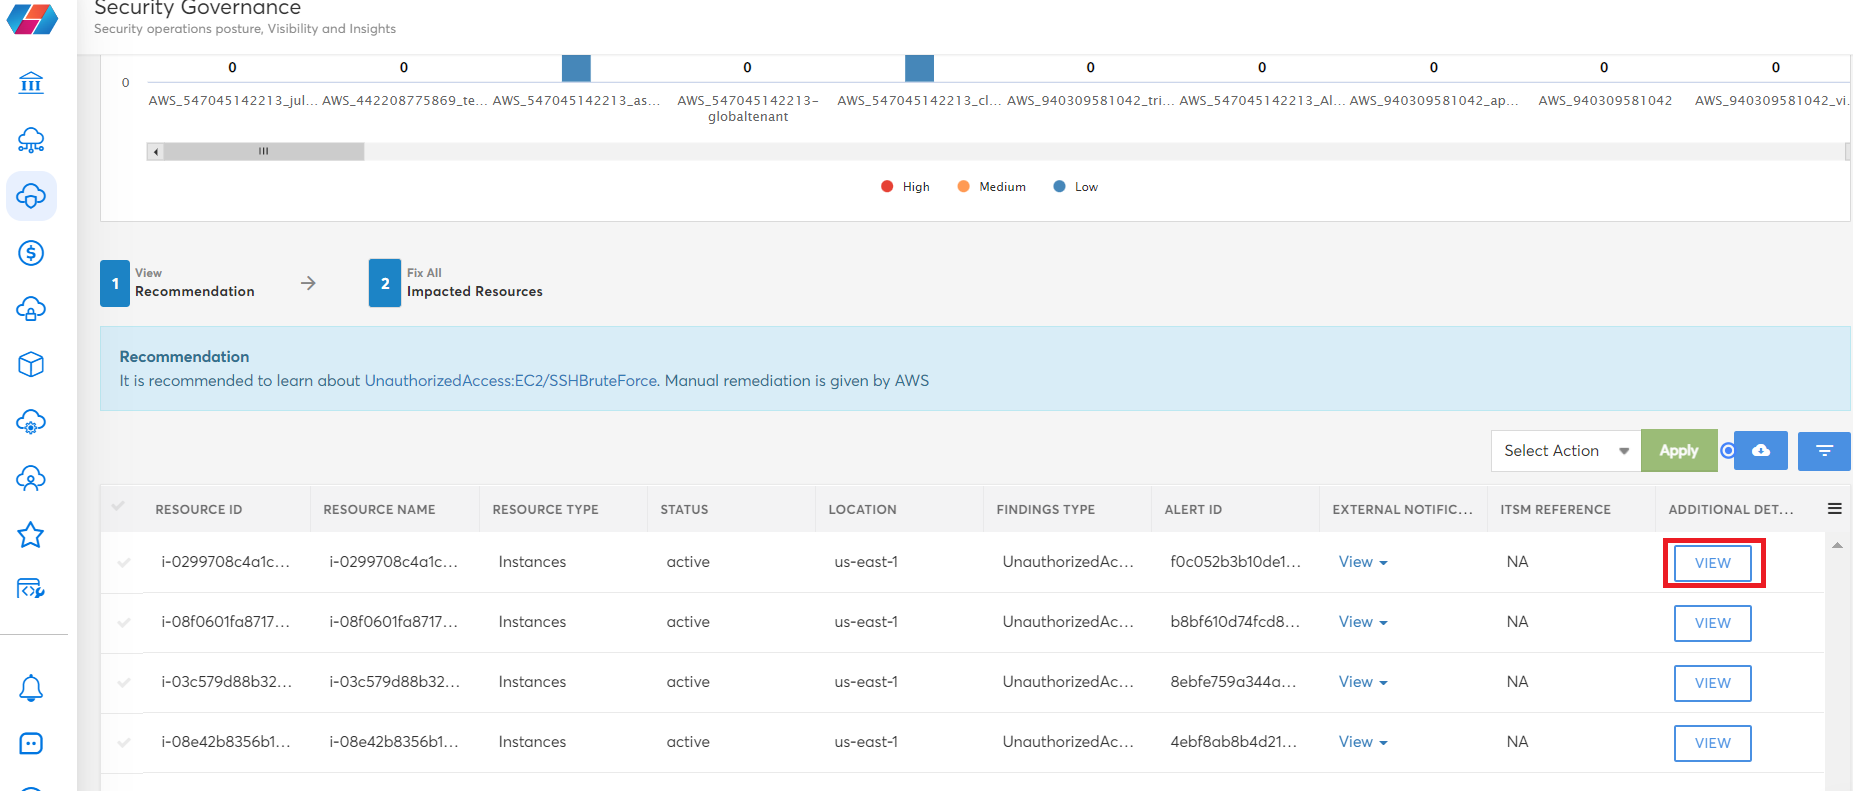
Users can click VIEW and see additional threat issues related to the impacted resources, and can also click the cloud icon to download a copy of the recommendation details in CSV format.
Note:
If you maximize a graph or a table, then click X in the upper left side of the screen to close the maximized view.
Threat Dashboard
The main objective of the Threat Dashboard is to alert you of any potential threats related to your cloud accounts. This dashboard provides detailed threat information for an account so that appropriate actions can be taken to remediate the threats.
To view the threat dashboard for an account, perform the following steps:
-
In the platform, select Security > Posture.
-
Select an account and click the Threats tab.
-
Perform steps 7 and 8 explained in the previous section.
-
In the Additional Detail column, click VIEW corresponding to an account to see its detailed threat information.
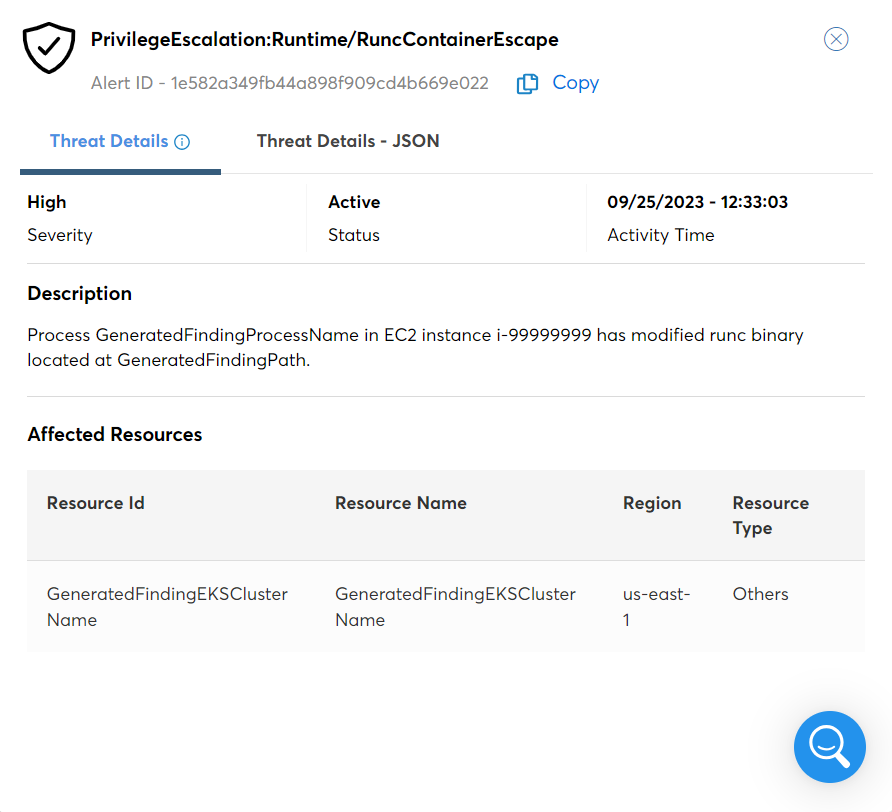
A pop-up screen appears, with two tabs -- Threat Details and Threat Details – JSON.
The following information can be viewed for an account on the Threat Details tab:
- Alert ID and Name: This displays the threat name and the alert ID.
- Severity: This displays the threat severity as Low, Medium, or High.
- Status: This displays the status of the threat as Active or Inactive.
- Activity Time: This displays the time at which the threat activity occurred.
- Description: This displays a description of the threat.
- Affected Resources: This displays the affected resource ID, name, type, and region of the resources.
Refer to the Threat Details – JSON tab to view complete threat information from the native source in JSON format.
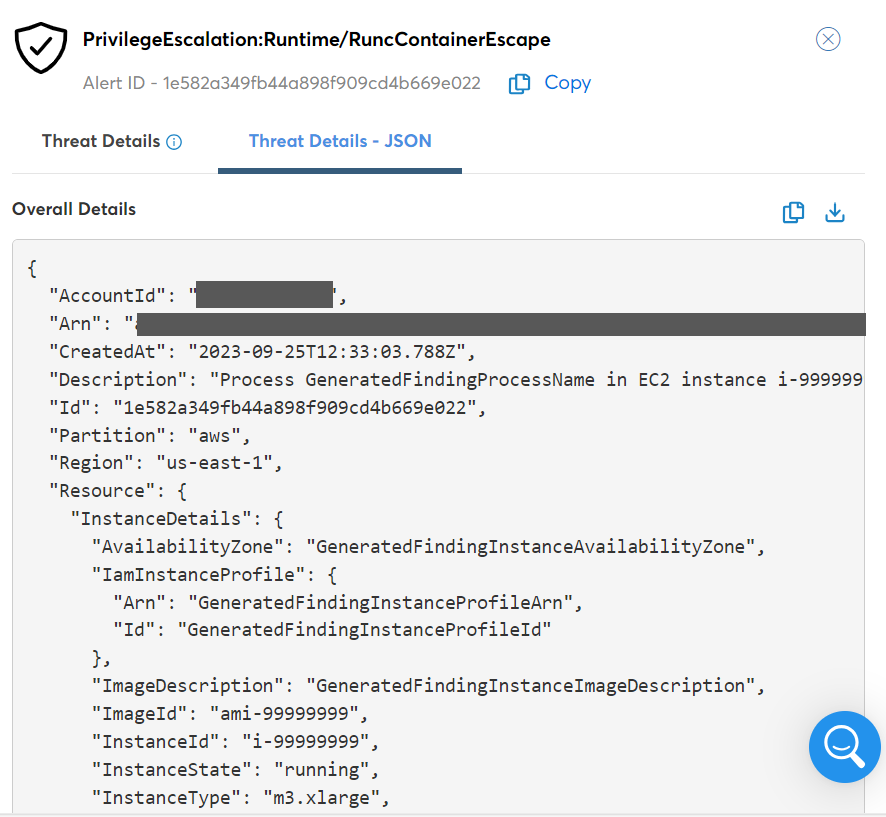
In the Overall Details section, you can click the Copy icon to copy the JSON details and click the Download JSON icon to download the JSON details in a file.
Note:
For GCP, the following fields are not shown in the JSON view:
- Type
- Finding Provider ID
- Display Name
- Project Name
- Project Display Name
- Parent Name
- Parent Display Name
- Security Marks
- Resource Name
For OCI, the following fields are not shown in the JSON view:
- Additional Details in Oracle
- Detector Type
- Problem Name differ in UI and Portal
- Status
- Compartment name
- Target Name
- Recommendation
Updated about 1 year ago