

Query-Based Filters in Dashboard
Introduction
Query-based filters are available in the Filter widget within the FinOps Dashboard.
The configuration for query based filters can be done as part of adding the Filter widget to a dashboard, and can be updated later as well. Charts and tables in the dashboards are displayed as per the applied filters and its values.
Configure Query-Based Filters
1. Update the Values for Granularity Filter
You can change the existing values for the existing query-based filters.
For example, to change an existing value in the Granularity filter, click the drop-down list and then select Day. Earlier, Month was selected as the value for Granularity filter, but now Day will be displayed.
2. Add a new Query-based Filter
Click ADD+ to add a filter.
3. Select "Cloud Account"
Select the option Cloud Account.
4. Select Values for the Filter
Click the drop-down list and then select relevant values for the Cloud Account filter.
5. Expand the Values and Select Them
After you click the drop-down list, you can expand this menu further to see all the available options. You can select the required values, and then click Ok.
6. Cloud Account Hierarchy
You have an option to view the complete cloud account hierarchy for the parent accounts. Expand to select as required.
7. Click the drop-down List for Time Range Filter
Click the drop-down list for the Time Range filter and then you can expand this list to view all the available options. You can select another value and then click Ok.
Note: The Time Period filter now has few additional presets such as -- Last 3 Months (To Now), Last Month (To Now), Last 2 Month (To Now), Last 6 Months (To Now), Last 12 Months (To Now), Previous 12 Months , Previous 3 Quarters, etc.
8. Select the "Custom Range" Option
The Time Range filter has an option called Custom Range. Users can expand the drop-down values of the Time Range filter and then select Custom Range. In the Custom Range option, users need to click the calendar and choose the desired date range. After the date range is finalized, click Ok.
9. Click ADD+
To add another custom filter, click ADD+.
10. Select "Cloud Account Tag Key Value"
Select Cloud Account Tag Key Value filter from the available options. You can then click the drop-down list, select relevant values, and click Ok.
11. Select "Tenant Tag Key Value"
To add another filter, click ADD+ and then select Tenant Tag Key Value filter option. You can then click the drop-down list, select relevant values, and then click Ok.
12. Hide/Show Filters
Users can click the Filter icon on the top-right corner of a widget to show or hide filters. When the filters are displayed, then users can select relevant values for it and also add additional filters.
Note:If a user has saved view and then makes some changes such as applies additional filter or removes some filter, then they must update the view to save it. For this, click the ellipses on the top-right corner of the screen and click Update View.
13. Group By Filter
Users can use the Group By filter and then view the widget graph. To use the Group By filter, click ADD+ and then select one option. The widget details will be grouped as per the selected option and displayed.
14. Click a Data Point
In the widget, click a data point to view drilldown details. Users can view drilldown details in a pop-up screen.
15. View Drilldown Details
On the Drilldown screen, users can click a data point again to view further drilldown details.
16. Additional Actions on Widget
On a widget, users can click the ellipses and take any of the following actions:
- Export config: Select this option to export widget configuration details.
- Swap Axis: Select this option to swap details in vertical and horizontal axis.
- Subscribe: Select this option to subscribe to widget emails.
- Accumulated Spend: Select this option to view widget details as accumulated spend from distributed spend. Vice versa can also be done.
- Limit Data: Select this option to limit the visibility of data in a widget as per these options -- Top 5, Top 5 plus others, Top 10, Top 10 plus others, Bottom 5, and Bottom 5 plus others.
- Download as CSV: Select this option to download the widget as CSV.
- Download as PNG: Select this option to download the widget as PNG.
- View As: Select this option to change the existing widget format into another format. Users are only allowed to select one option from what is being displayed.
17. Table View/Chart View
Users can click the square box icon (Table View) to view the widget details in tabular format and users can click the bar chart icon (Chart View) to view the widget in chart format.
18. Click Ellipses
On the Filter widget, click ellipses.
19. Click "Configure widget"
Click Configure Widget. The Configure: Filter Widget screen displays.
20. Update the Settings
Make all relevant changes to the filter settings.
21. Click "Finish"
After making all the changes, click Finish.
22. Apply Changes to the Dashboard
Click the tick mark next to Apply Changes to accept the changes made in the widget.
22. Apply Metrics Filter
Users can click the Metrics filter, which is a global filter, and select a relevant option related to Cost Metrics or Margin.
The options available for the Margin filter are - Margin Value (Direct Partner), Profit Margin (Direct Partner), Margin Value (Indirect Partner), and Profit Margin (Indirect Partner).
23. Apply Group Filter
The Group filter is used to apply filtering conditions and can include multiple filters within it. To apply the Group filter, click ADD+ and select Group.
24. Add Filter(s)
After that, click +, select a filter, and select values for it. You can click + to add more filters.
25. Change the Condition
To change the filtering condition, click "is" to view other conditions such as -- is, is not, contains, does not contain, and Start With. You can select the desired condition as per need.
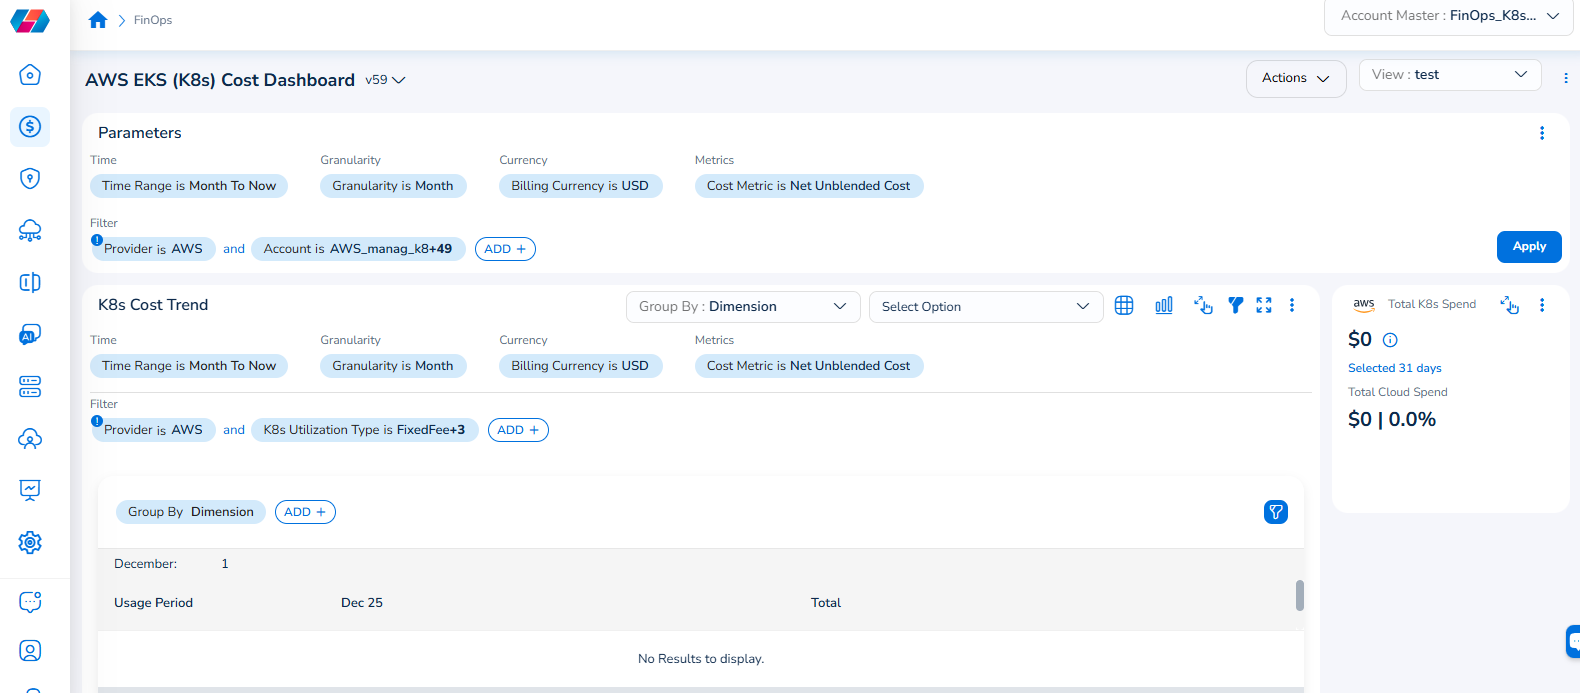
Note that the Cloud Account filter has been renamed to Account, and the Cloud Provider filter has been renamed to Provider.
For example, if you see the dashboard shown in the screenshot below, the Parameters > Filter section shows the Provider filter for which the value selected is AWS.
To add the Account filter, users can click ADD+ and select Account. In the drop-down list that appears, users can select all applicable values, and click Ok. Details will be displayed in widgets as per the selected filter(s).
In every widget that is available within a dashboard, users can click the Filter icon that appears on the top-right side of the widget and view the pre-defined filters. The Provider filter appears as a pre-defined filter. Users can use the ADD+ option to add custom filters and they have the option to add the Account filter from here.
Updated 7 months ago