

Cost Anomaly Details Deep Dive
1. Click "FinOps"
Begin by navigating to FinOps.
2. Click "Cost Anomaly"
Next, click on cost anomaly.
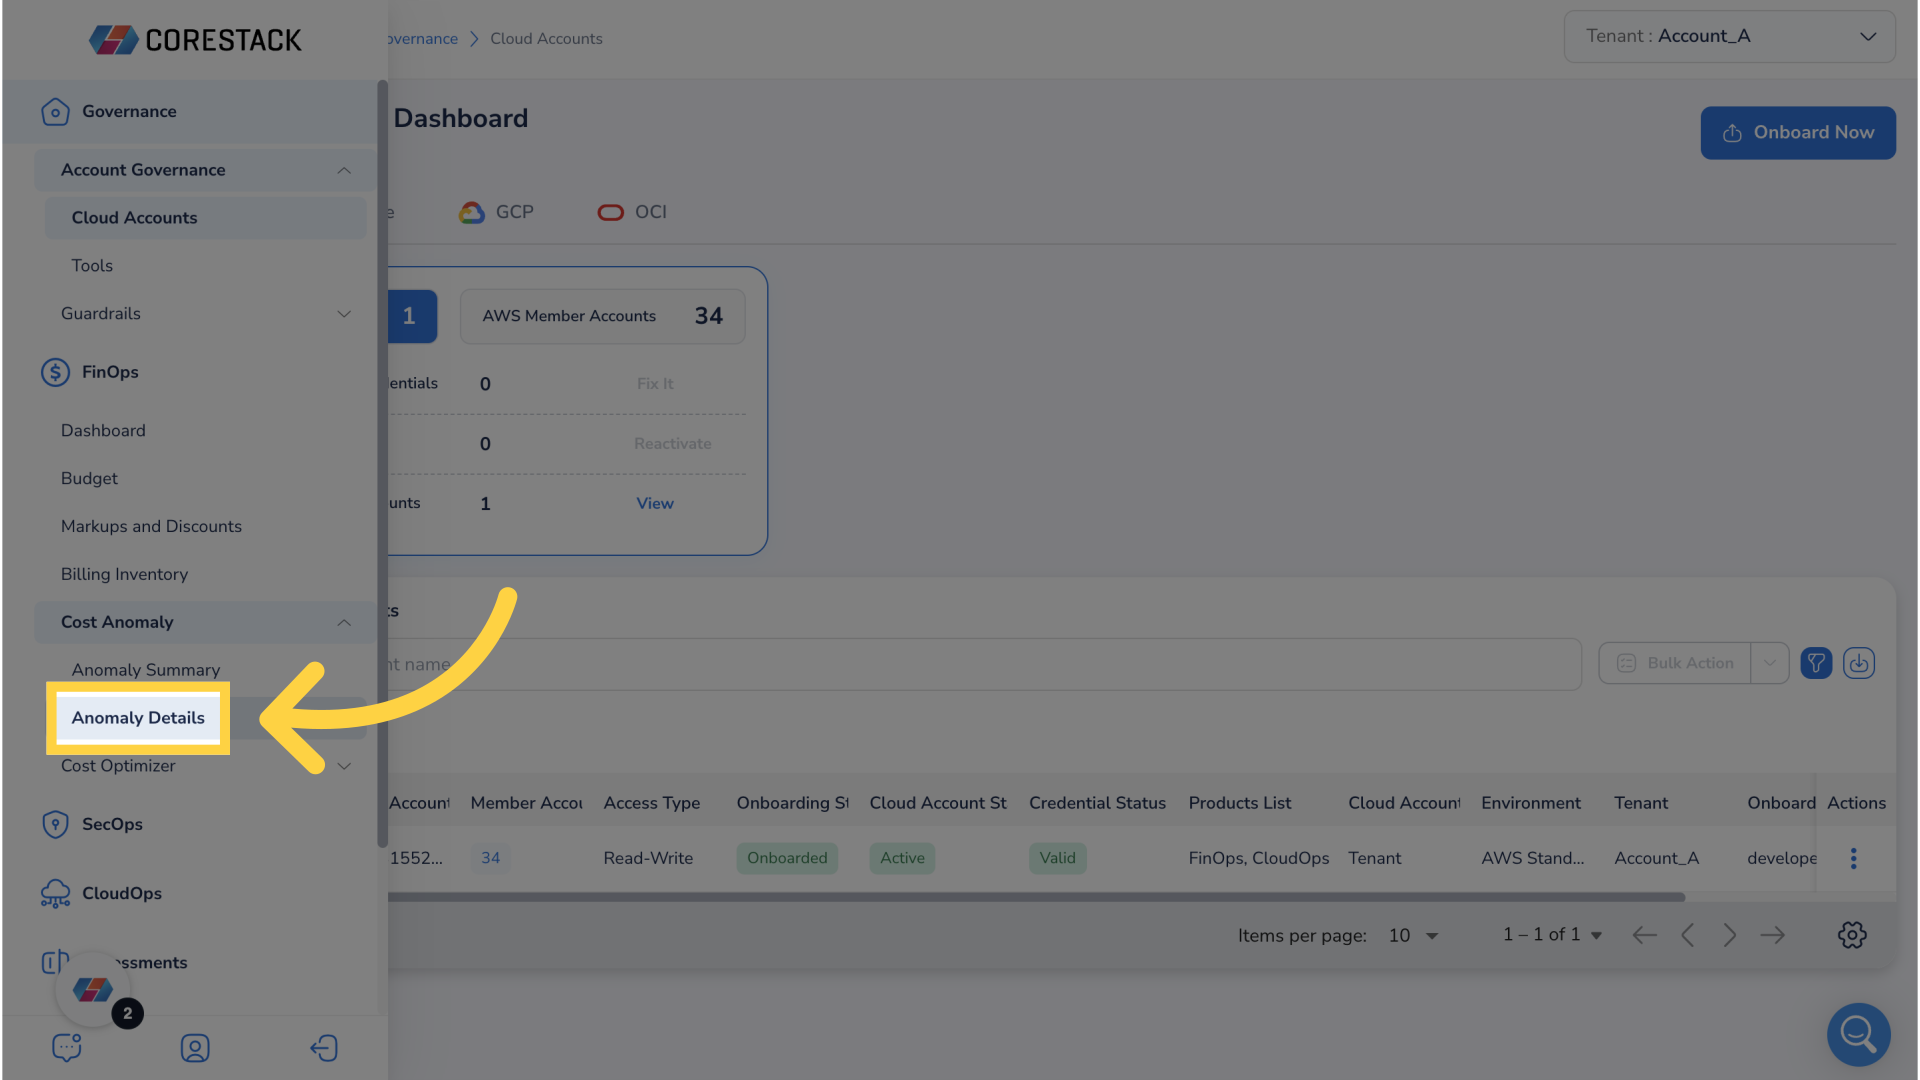
3. Click "Anomaly Details"
Then, click on anomaly details.
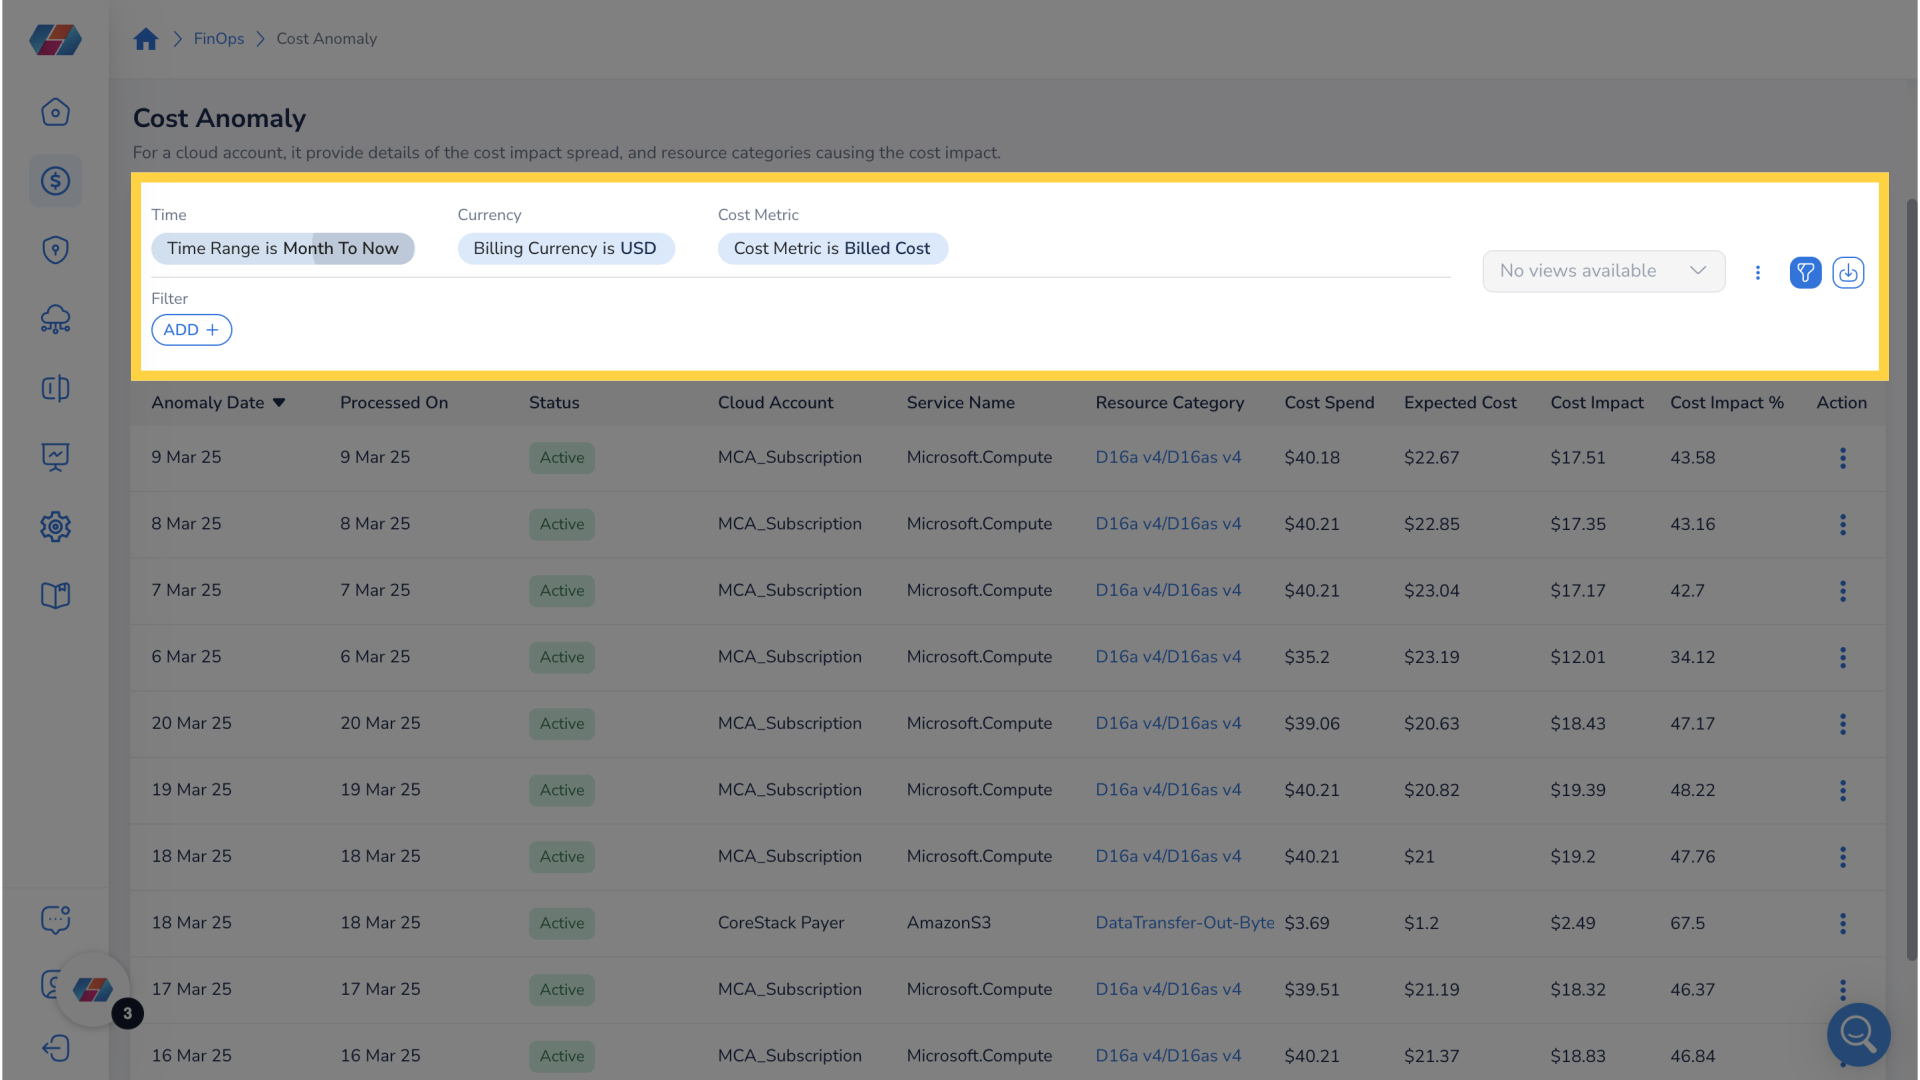
4. Arrive at Cost Anomaly Details Page
Upon arrival to the cost anomaly page this is what you will see.
5. Take Note of Filters
Take note of the filters section. Here you can edit existing filters and add filters to narrow down data.
6. Arrive at Cost Anomaly Details Page
Upon arrival to the cost anomaly page you will see this page.
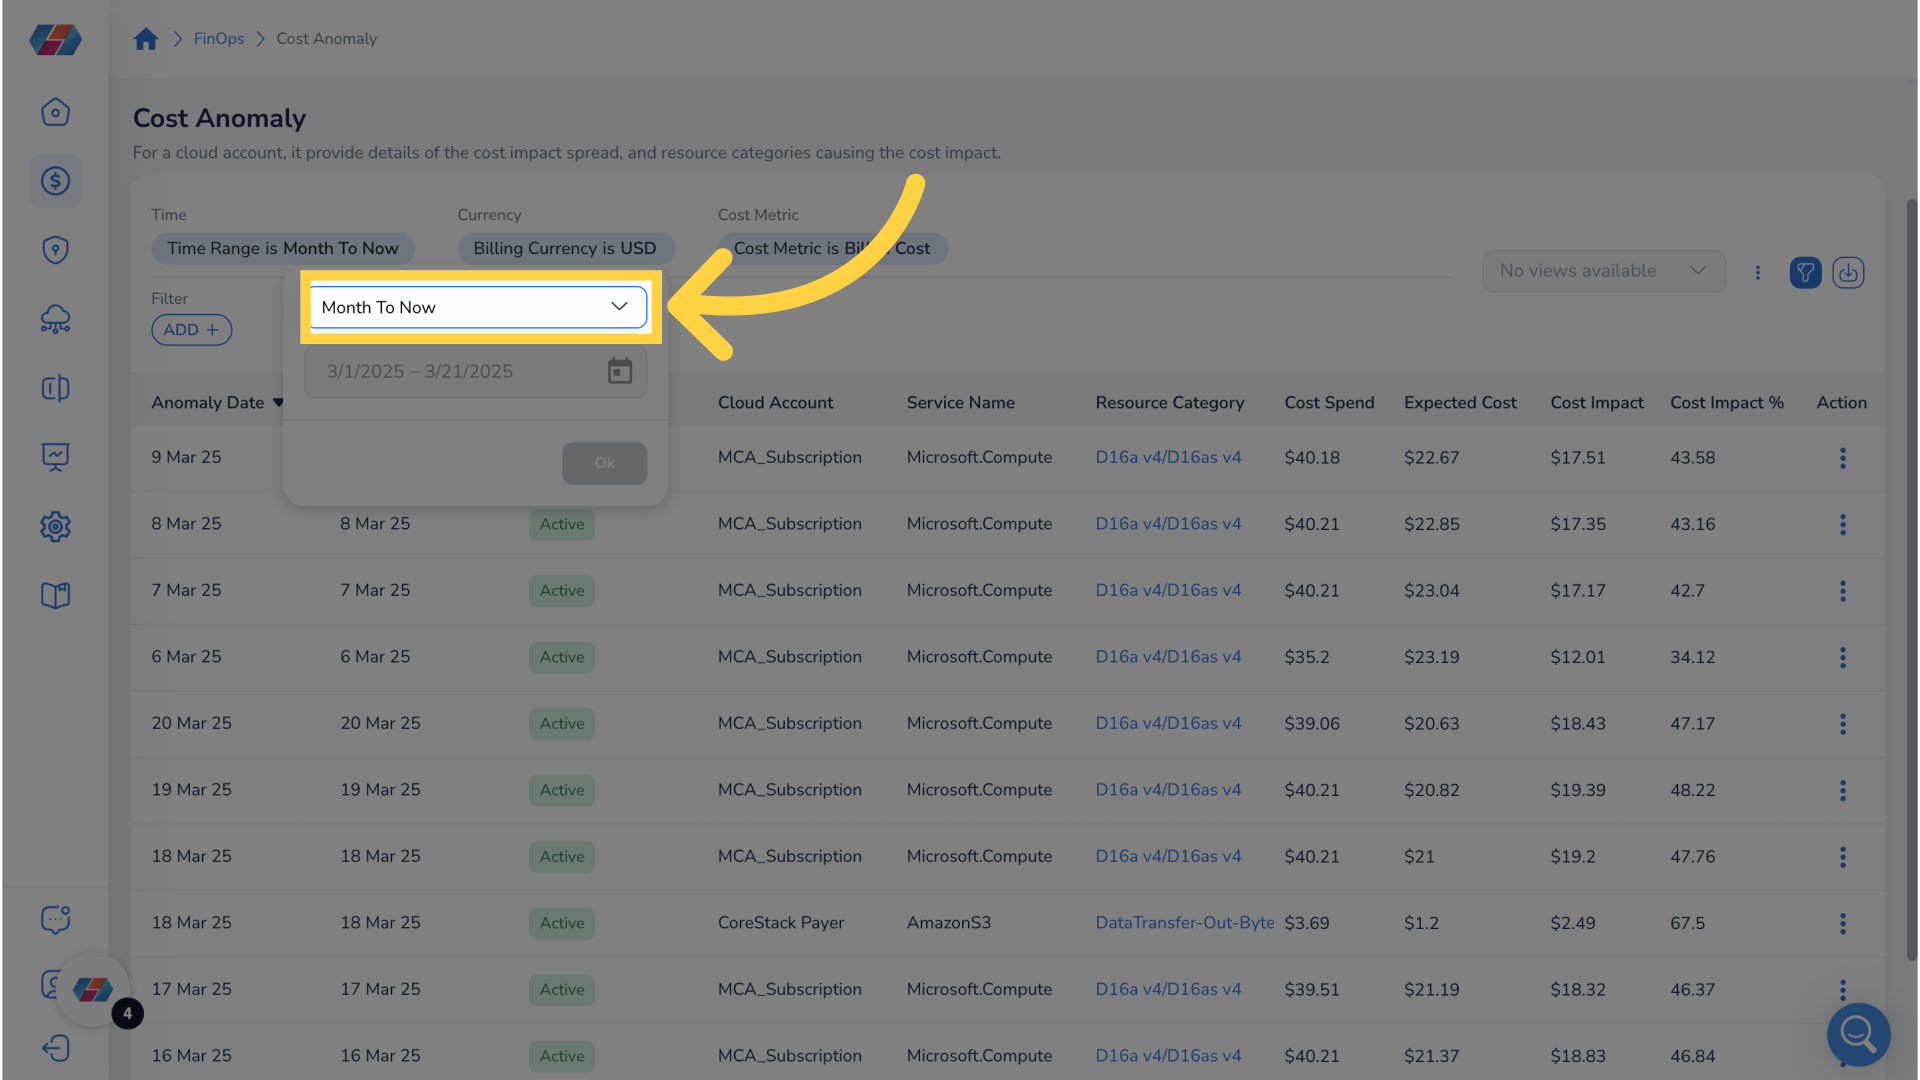
7. Click "Time Filter"
To edit existing filters you just need to click on the filter. Click the time filter.
8. Click "Month To Now"
Click the drop down menu to see options for filter.
9. Click "Previous 3 Months"
Select Previous 3 Months.
10. Click here
To finalize change of filter press ok.
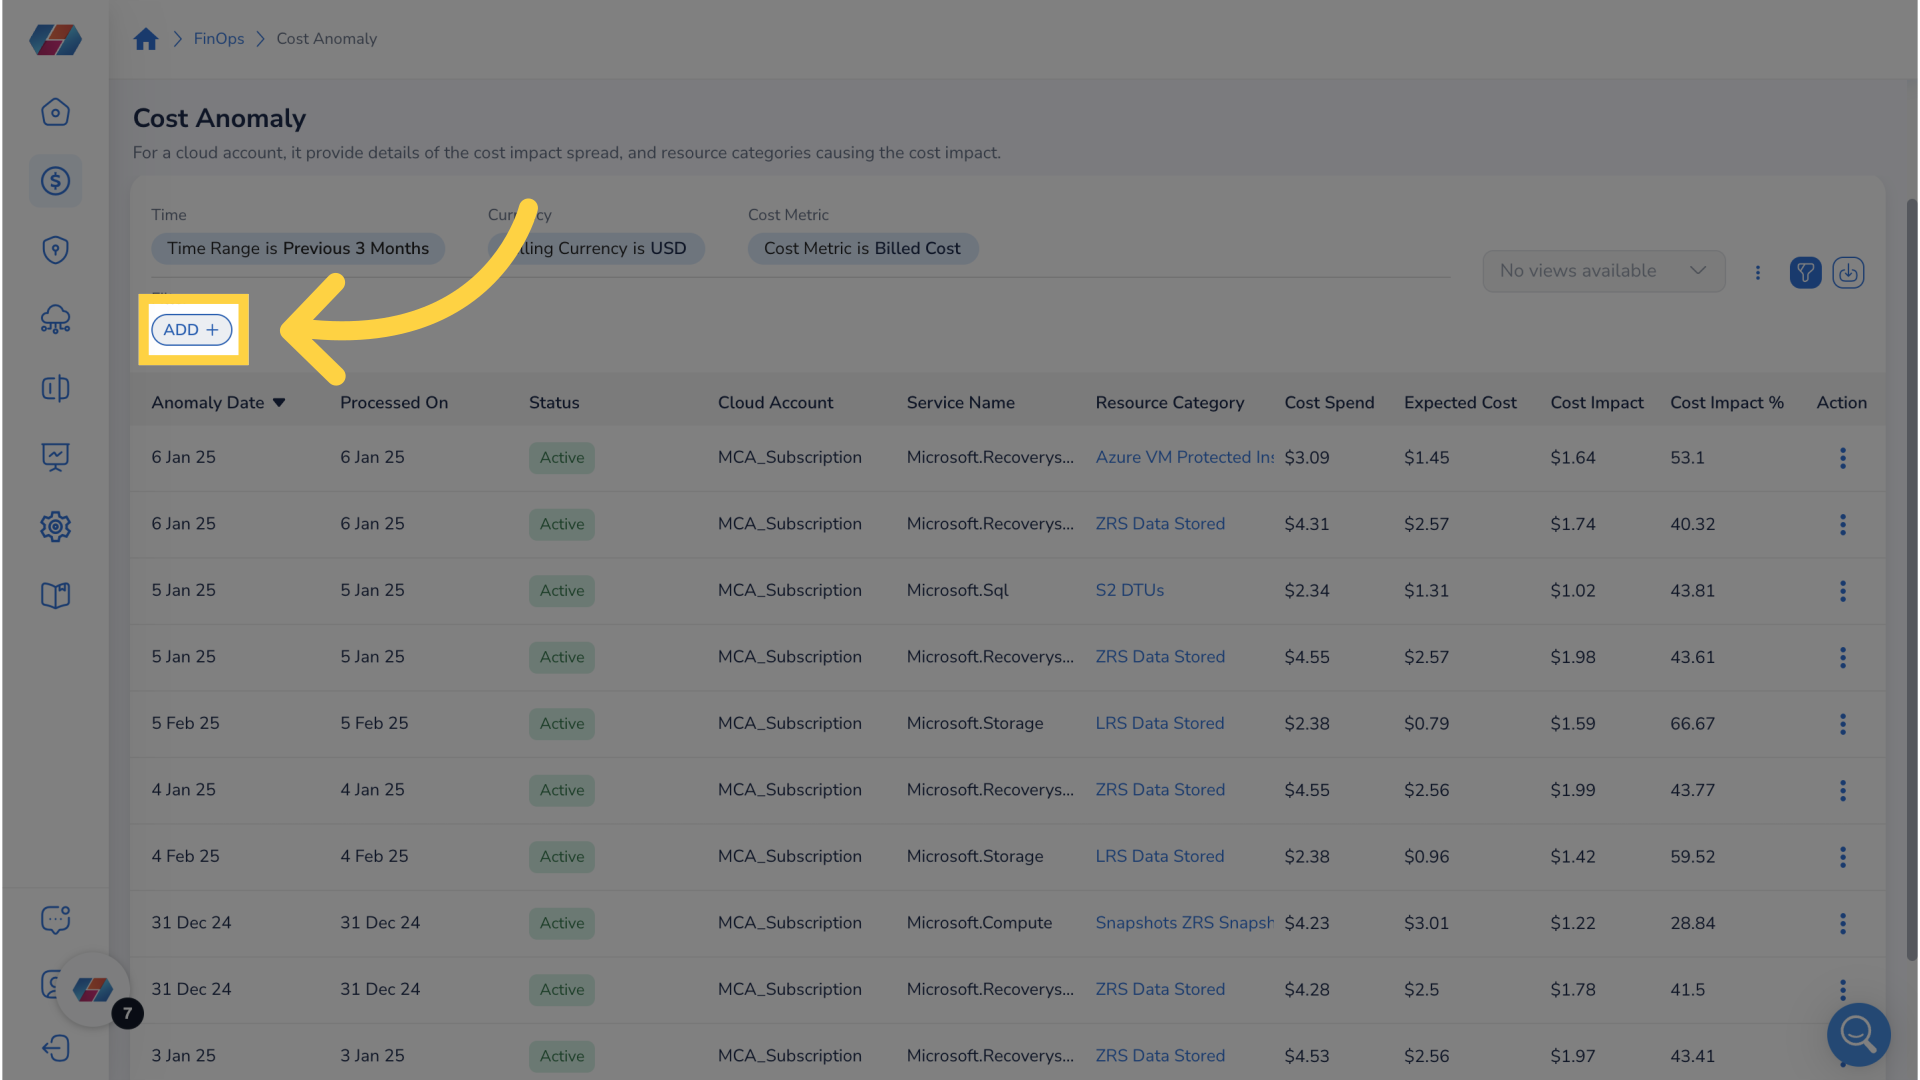
11. Click "ADD+"
To create a filter click the add button.
12. Click "Cloud Provider"
I want to create a filter that will only show anomalies related to Azure. To do this I will create a filter for cloud provider.
13. Click "Down Arrow"
Click the down arrow to open a drop down menu to specify which cloud provider to filter for.
14. Click "square"
To specify that I only want to filter for anomalies in Azure I will click the box for azure.
15. Fill "on"
Fill in "on"
16. Click "Ok"
Confirm your selection by clicking "Ok".
17. Observe that anomalies have been correctly filtered.
If those steps were followed correctly there should only be anomalies found in Azure like on this data table.
18. Click "Azure VM Protected Instances"
For a detailed analysis of resource category to better analyze anomalies click specific resource category for said anomaly. In this case I will click on Azure VM Protected Instances.
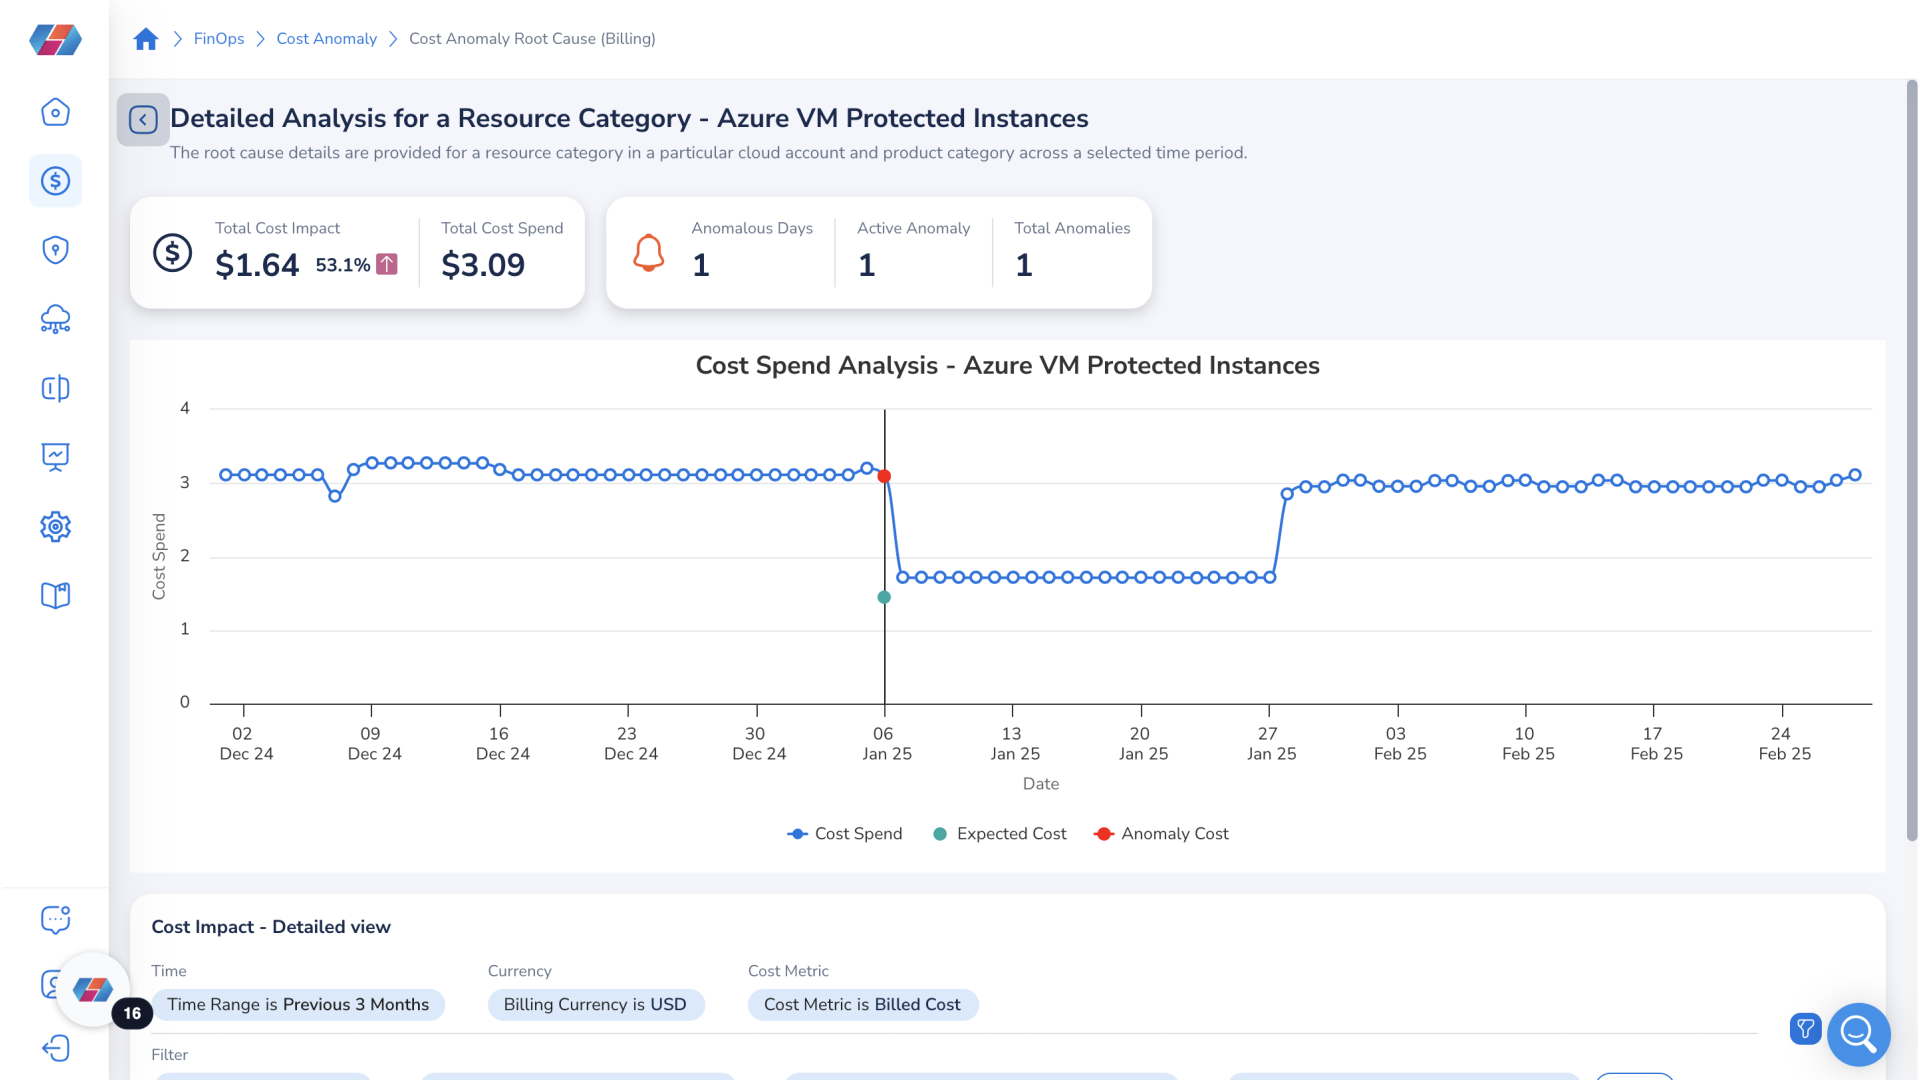
19. Arrive at Detailed Analysis
On arrival to this page you can see the cost spend analysis graph for a resource. In my case, I see the detailed analysis for the resource category: Azure VM Protected Instances.
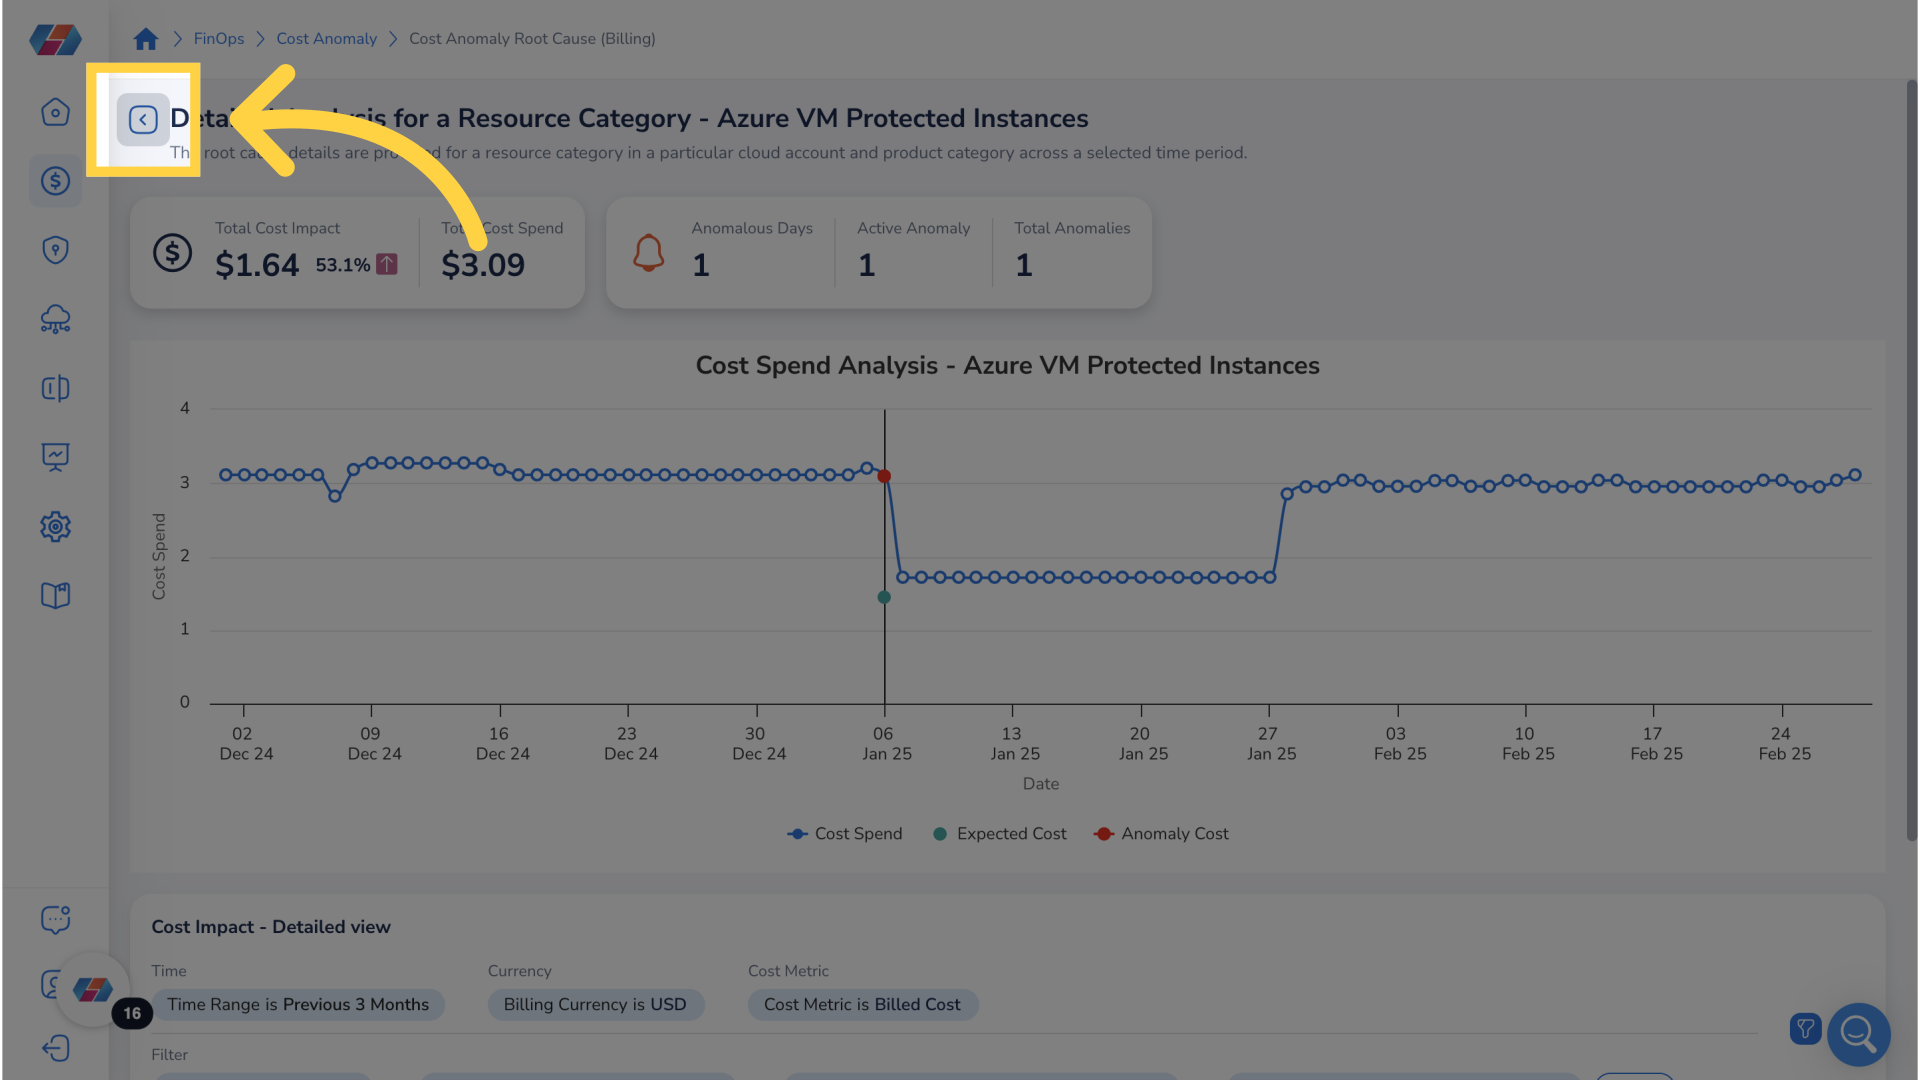
20. Click "back arrow"
To go back to cost anomaly details just press the back arrow.
21. Click "x"
To get rid of filters just hover over the filter with your mouse and click the x button.
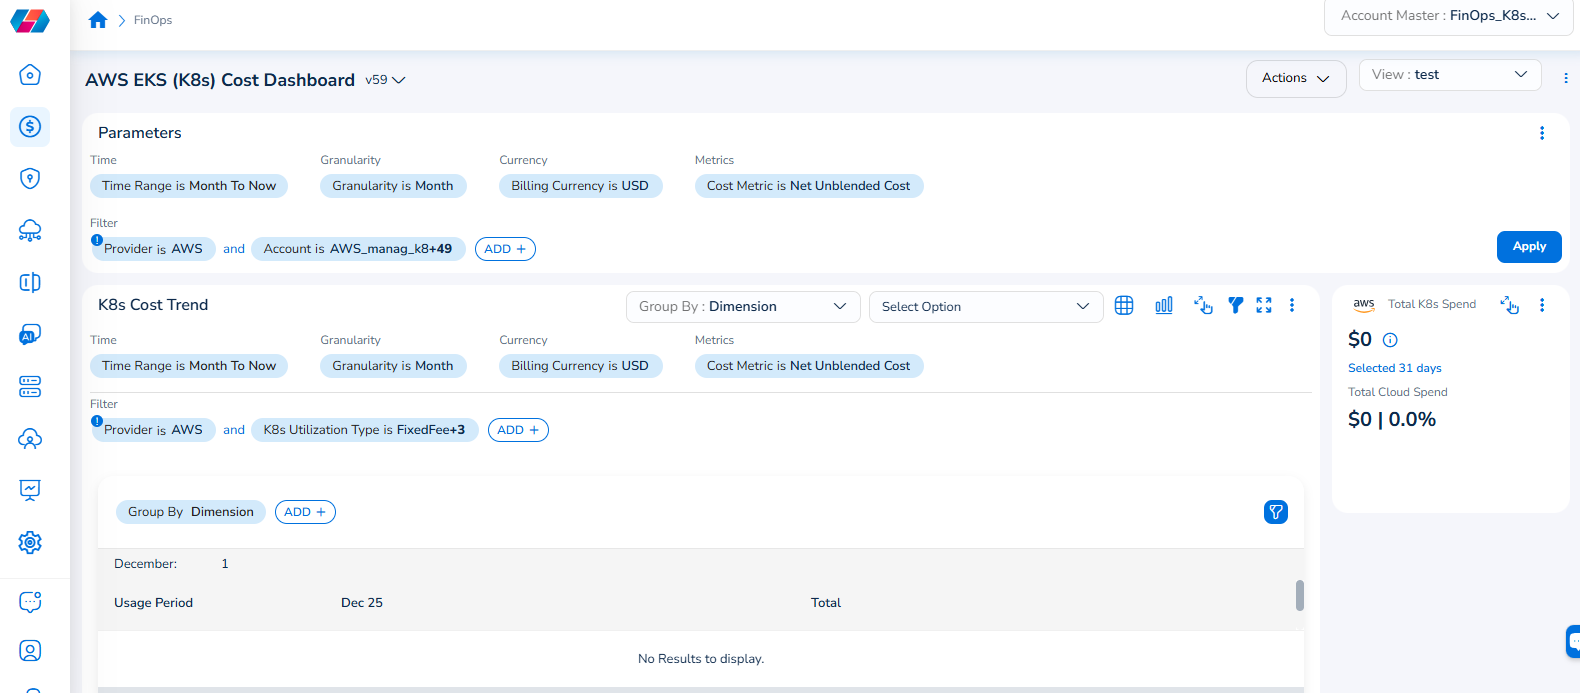
Note that the Cloud Account filter has been renamed to Account, and the Cloud Provider filter has been renamed to Provider.
For example, if you see the dashboard shown in the screenshot below, the Parameters > Filter section shows the Provider filter for which the value selected is AWS.
To add the Account filter, users can click ADD+ and select Account. In the drop-down list that appears, users can select all applicable values, and click Ok. Details will be displayed in widgets as per the selected filter(s).
In every widget that is available within a dashboard, users can click the Filter icon that appears on the top-right side of the widget and view the pre-defined filters. The Provider filter appears as a pre-defined filter. Users can use the ADD+ option to add custom filters and they have the option to add the Account filter from here.
Updated 7 months ago