

Anomaly Dashboard
Cost Anomaly Summary and Cost Anomaly Details Overview
1. Introduction
This powerful tool identifies unexpected expenses, empowering you to make informed decisions and maintain financial control.
2. Click "FinOps"
To access cost anomaly features, select the FinOps module
3. Click "Cost Anomaly"
Then, select Cost Anomaly
4. Click "Anomaly Summary"
Next, select anomaly summary.
5. Reach Anomaly Summary Page
Finally, arrive at the Anomaly summary page.
6. Filters
Here you can utilize filters to narrow down large, complex datasets, allowing you to focus on relevant information. Enables better insights, informed decision-making, and identification of areas for cost optimization
7. Cost Anomaly Based on Resource Category
This section is compromised of a plethora of widgets that utilize the resource category dimension which uses daily cost data for each resource category to identify and analyze cost spikes.
8. Widgets
There are three widgets that display -- Total Cost Impact, Total Cloud Spend, and Total Anomalies, respectively.
9. Cost Trend By Cloud Provider
The Cost Trend By Cloud Provider widget allows analysis of changes in spending over time. Shows how costs for cloud resources increase or decrease based on usage, pricing changes, and optimization efforts. Ultimately, enables organizations to better understand and predict their cloud expenses.
10. Cost Anomaly Impact
The Cost Anomaly Impact widget allows tracking of cost impact over time for various cloud providers. In this example, the chart is showing the cost impact in Azure. The red dots are representative of identified anomalies.
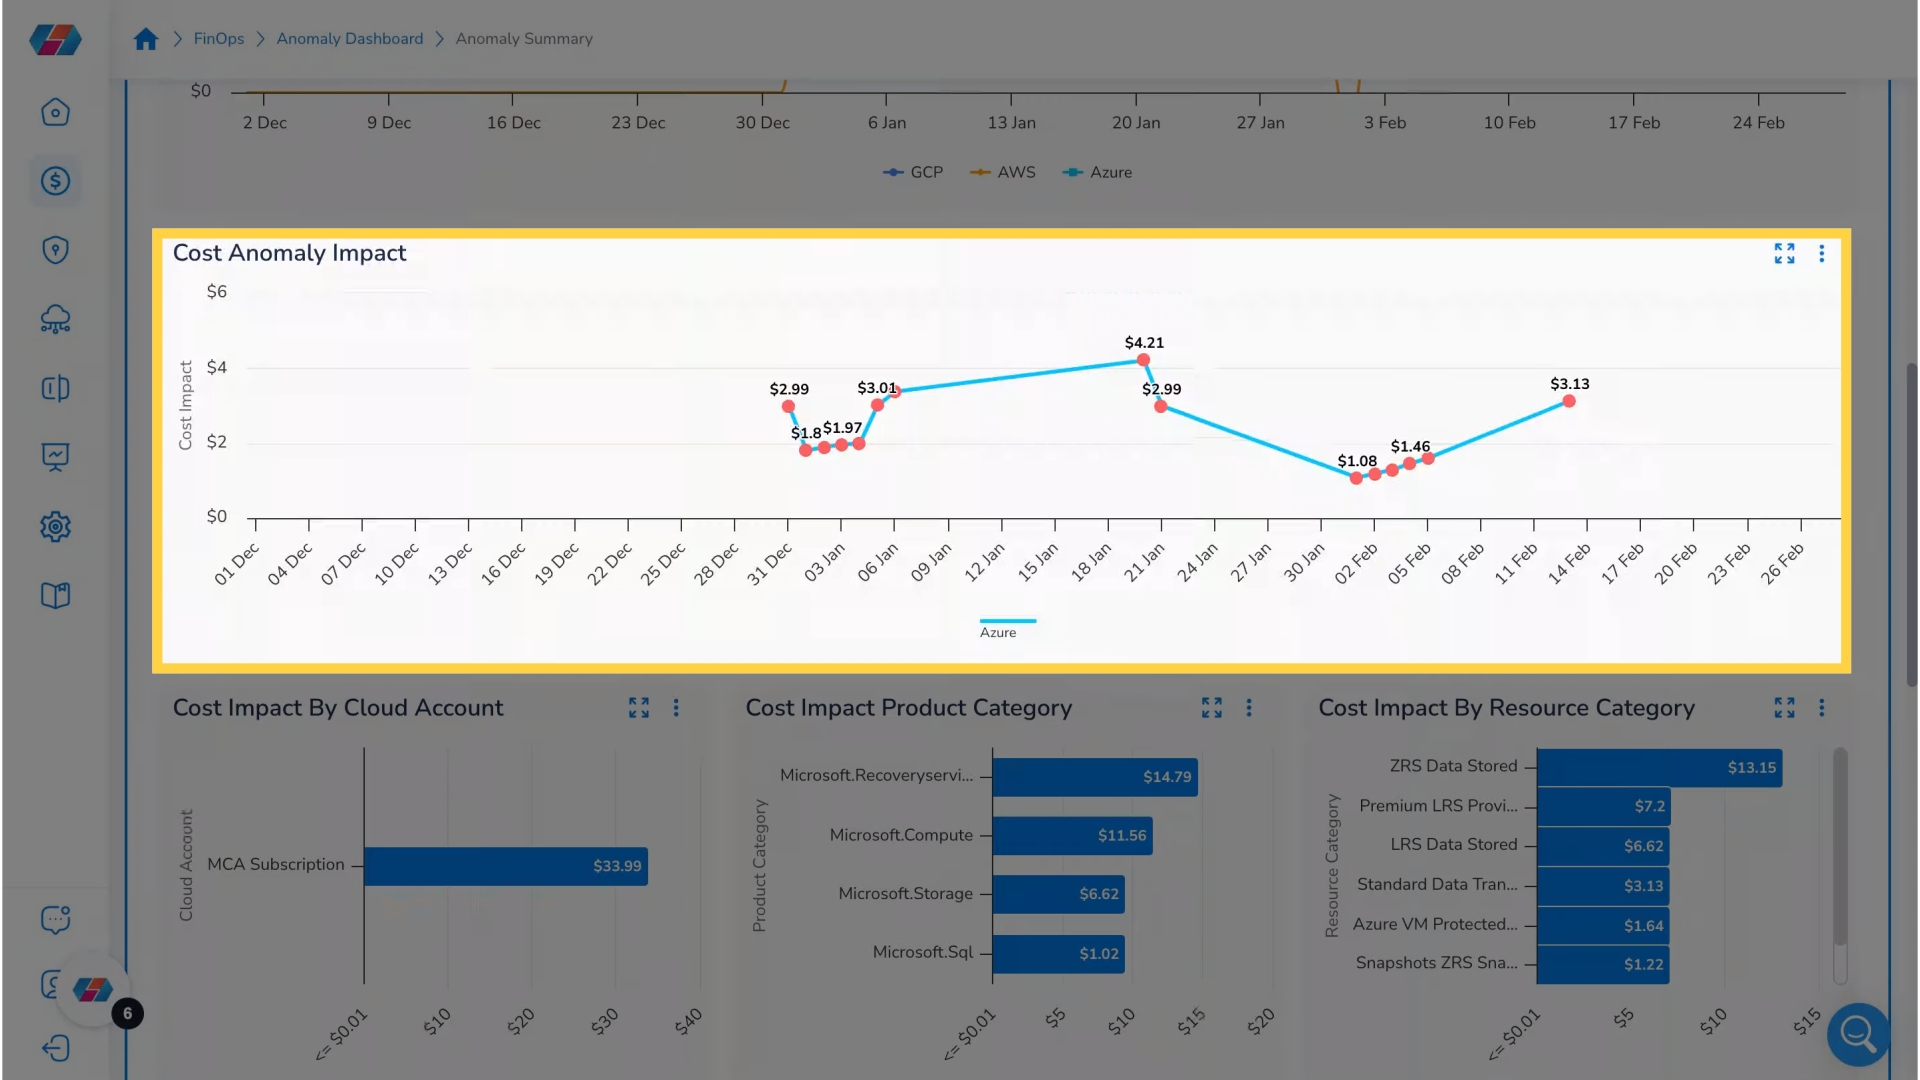
11. Cost Impact Widgets
There are three widgets that shows the cost impact -- Cost Impact by Cloud Account, Cost Impact Product Category, and Cost Impact by Resource Category level respectively.
12. Cloud Account Dimension
This section contains a plethora of widgets that use daily data for each cloud account to identify and analyze cost spikes.
13. Widgets
There are three widgets that display Total Cost Impact, Total Cost Spend, and Total Anomalies detected, respectively.
14. Cost Anomaly Based on Cloud Accounts Widget
This widget allows you to analyze cost impacts of different cloud accounts.
15. Click FinOps
To dive deeper into specific anomalies by accessing detailed insights need to reach anomaly details by first navigating back to FinOps.
16. Click "Cost Anomaly"
Then click cost anomaly.
17. Click "Anomaly Details"
Next, click anomaly details.
18. Cost Anomaly Details
Finally, arrive at cost Anomaly Details page. Here, you can see the cost impact for cloud accounts as per resource categories and dimensions.
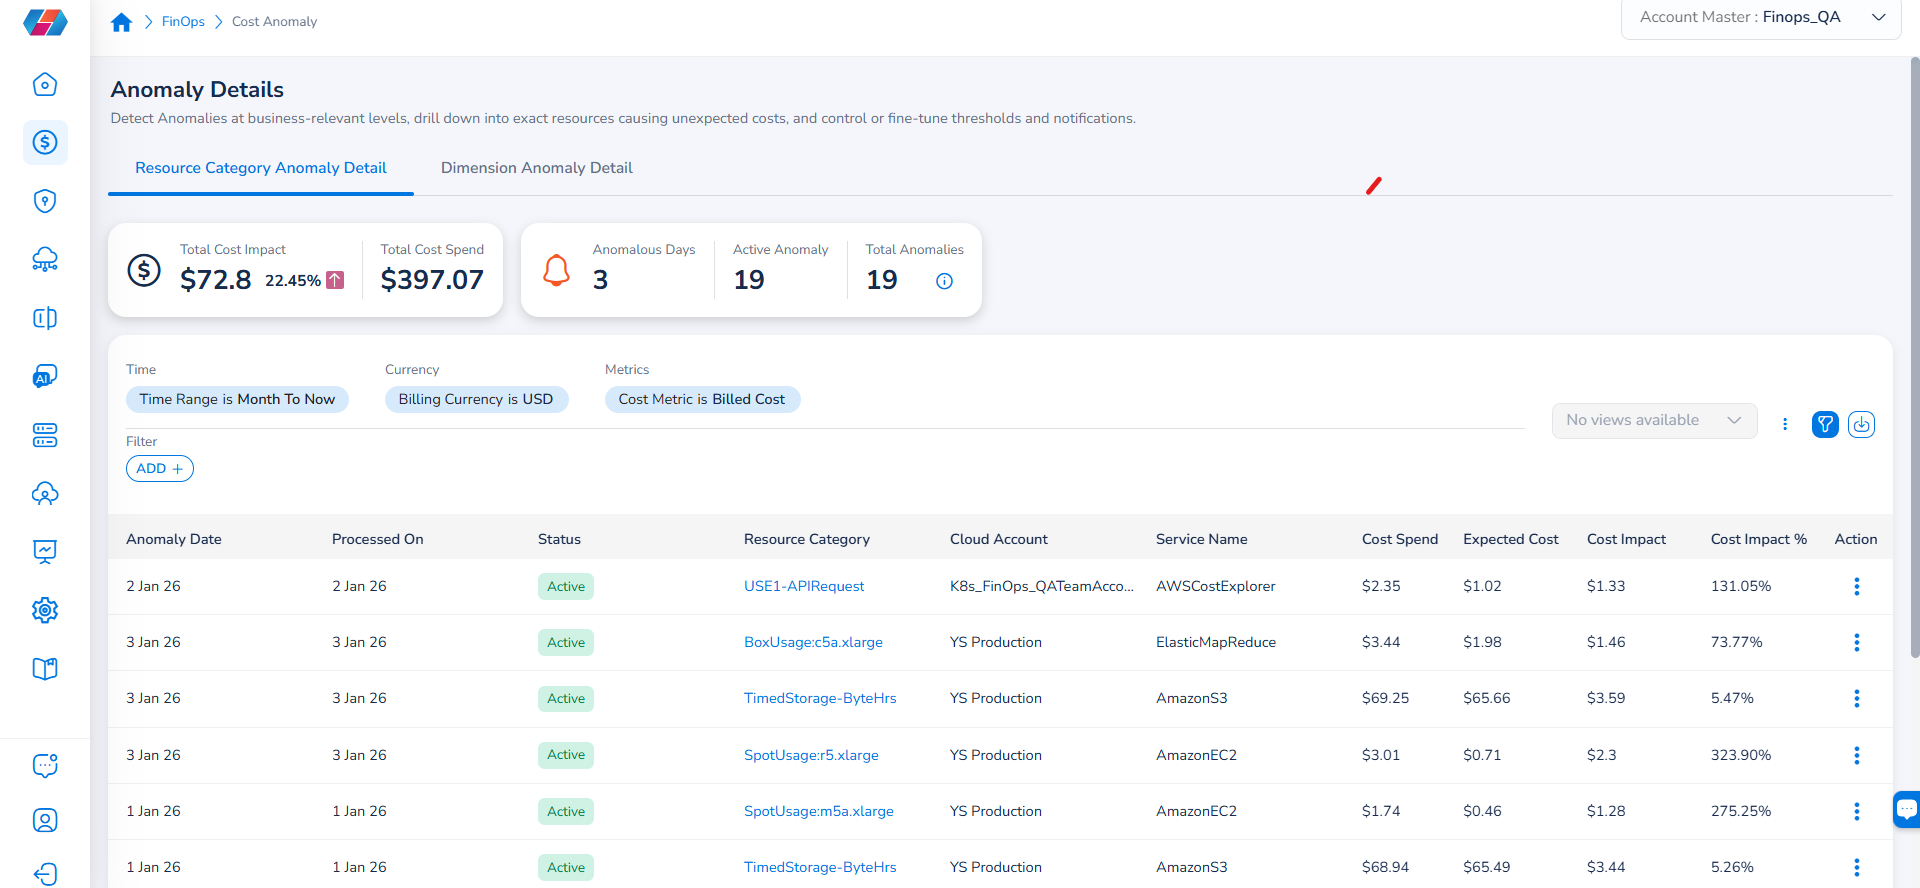
19. Total Cost Overview
The widget will show you statistics regarding Total Cost Impact and Total Cost Spend respectively.
20. Anomaly Overview
The widget will show you statistics regarding anomalies.
21. Filters
Here you can apply filters to narrow down data to focus on more relevant information.
22. Resource Category Anomaly Detail
The data table in the Resource Category Anomaly Detail tab shows details on detected anomalies with respect to resource categories.
23. Dimension Anomaly Detail
The data table in the Dimension Anomaly Detail tab shows details on detected anomalies with respect to dimensions.
By utilizing the Cost Anomaly feature, you will gain unparalleled insights into your spending patterns, enabling proactive management of costs. This streamlined approach enhances financial transparency and drives more informed decisions, ultimately leading to improved budget performance.
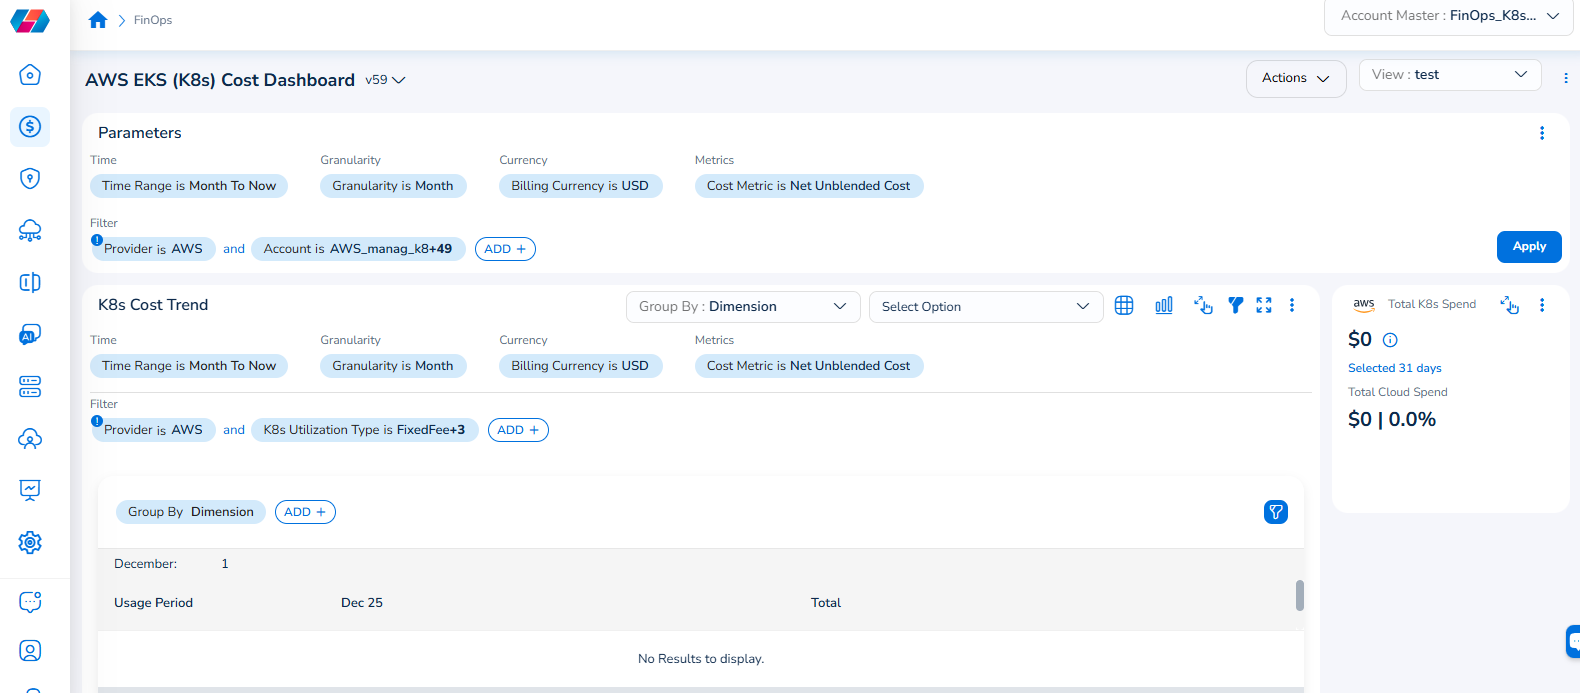
Note that the Cloud Account filter has been renamed to Account, and the Cloud Provider filter has been renamed to Provider.
For example, if you see the dashboard shown in the screenshot below, the Parameters > Filter section shows the Provider filter for which the value selected is AWS.
To add the Account filter, users can click ADD+ and select Account. In the drop-down list that appears, users can select all applicable values, and click Ok. Details will be displayed in widgets as per the selected filter(s).
In every widget that is available within a dashboard, users can click the Filter icon that appears on the top-right side of the widget and view the pre-defined filters. The Provider filter appears as a pre-defined filter. Users can use the ADD+ option to add custom filters and they have the option to add the Account filter from here.
Updated 7 months ago