

Create, Edit, and Delete Dashboards
Create, edit, and delete FinOps and dashboards in CoreStack. Add widgets to track cloud, Kubernetes, AI, and SaaS costs across AWS, Azure, GCP.
Create, Edit, and Delete Dashboards
Feature Overview
Dashboards are customizable, widget-based visual summary pages within CoreStack’s FinOps module that let you monitor cost, usage, and security trends at a glance. They are most relevant when you need a view scoped to a specific set of resources — a single cloud provider, all onboarded clouds, Kubernetes clusters and AI service accounts, or SaaS tools — rather than one fixed, organization-wide view. Dashboards support widget drill-downs, group-by analysis, multiple saved views per dashboard, configurable filters, and PDF subscriptions, and any user with dashboard access can create their own and share it with others based on their role. This guide covers creating, editing, and deleting dashboards and their widgets.
Note: Which cloud providers, clusters, or SaaS tools you can target depends on what’s already onboarded in your tenant. A Targeting for option with nothing onboarded behind it (for example, Platform Providers with no Kubernetes clusters or AI service accounts onboarded) will not have data to display.
How It Works
When you create a dashboard, you choose a Dashboard Type and a Targeting for scope — Multi Cloud, Single Cloud, Platform Providers, or Multi Cloud SaaS — and that scope determines which providers, clusters, or tools the dashboard covers by default. From there, you add widgets that bind to specific data sources and filters; each widget renders as a chart, trend, or summary based on the chart type, refresh rate, grouping, and dimension settings you choose during setup. Once saved, a dashboard updates as new cost and usage data is ingested, and you can resize, edit, or remove widgets at any time by re-entering the dashboard’s edit mode. Because dashboards are query-driven rather than static, changes to a widget’s filter or data binding take effect the next time that widget refreshes, not instantly.
Prerequisites
Before you begin, ensure the following:
- Role: You have a role with FinOps Dashboard access — for example, FinOps Practitioner, FinOps Admin, or FinOps Account Admin — or the equivalent SecOps role for SecOps Dashboards.
- Prior setup: At least one resource matching your intended Targeting for scope is already onboarded — a cloud account for Multi Cloud or Single Cloud dashboards, a Kubernetes cluster or AI service account for Platform Providers dashboards, or a SaaS tool account for Multi Cloud SaaS dashboards.
- Access: You can access
FinOps > Dashboardin the CoreStack navigation.
Creating a Dashboard
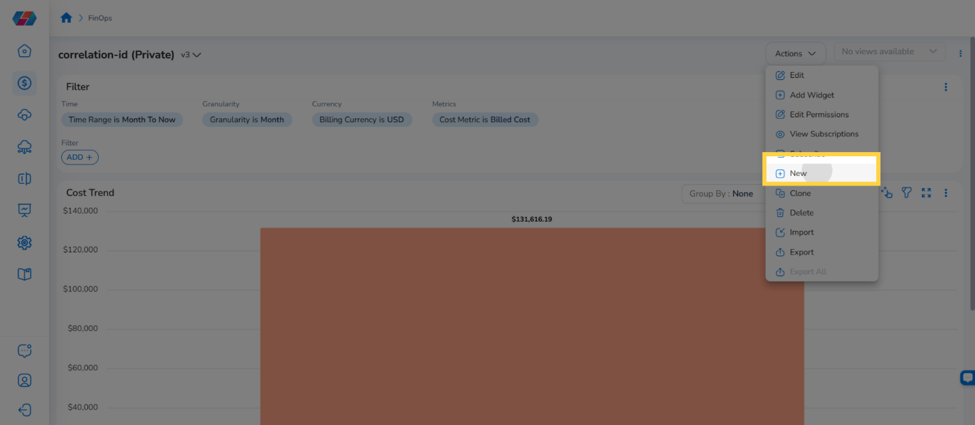
Navigate to FinOps > Dashboard > Actions, then click New. The Create New Dashboard dialog box appears.
Step 1: Select the Dashboard Type
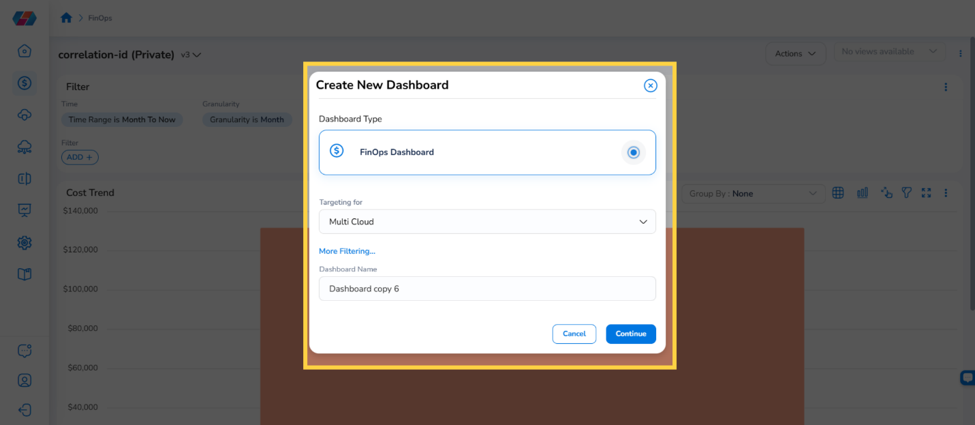
In the Dashboard Type field, select FinOps Dashboard
.
Step 2: Select a Targeting for option
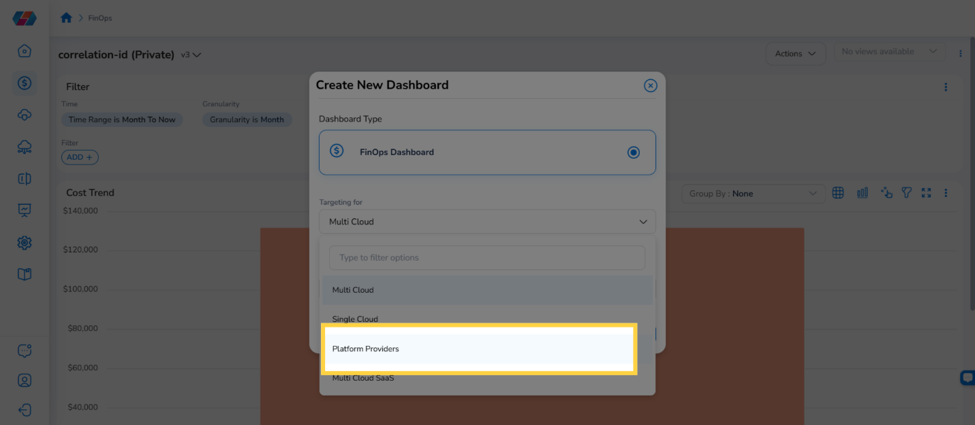
In the Targeting for field, select one of the following. Each option scopes the dashboard to a different set of resources:
-
Multi Cloud — all onboarded cloud providers are included in the dashboard by default. No further Targeting for fields appear.
-
Single Cloud — in the Cloud Type field, select the specific cloud provider — for example, AWS or Azure — for which the dashboard needs to be created. The dialog title updates to reflect the selected provider.
-
Platform Providers — in the Platform Type field, select Kubernetes, AI Services, or both. See Step 3 and Step 4 for the fields this reveals.
Note: Platform Providers was previously labeled Container Provider.
-
Multi Cloud SaaS — select the clouds and SaaS tools to include or click Select All.
Step 3: Select AI Services (Platform Providers only)
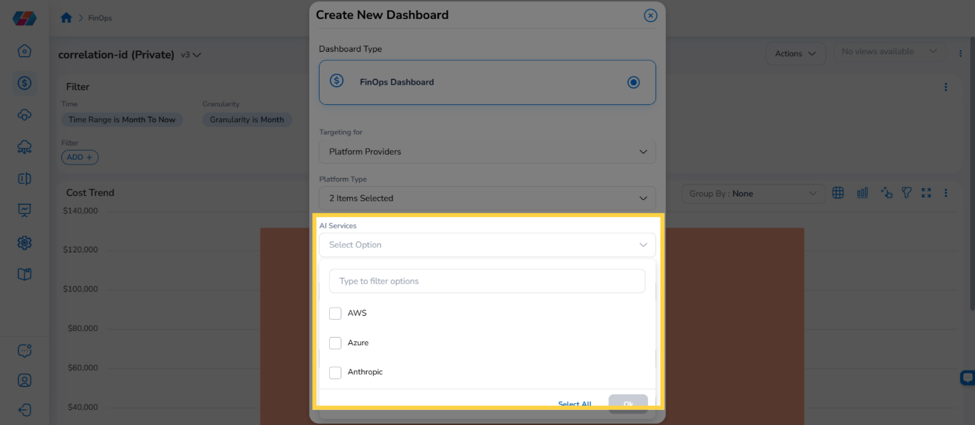
If you selected AI Services under Platform Type in Step 2, then in the AI Services field, select one or more providers — AWS, Azure, or Anthropic — or click Select All.
Step 4: Select Cluster Type (Platform Providers only)
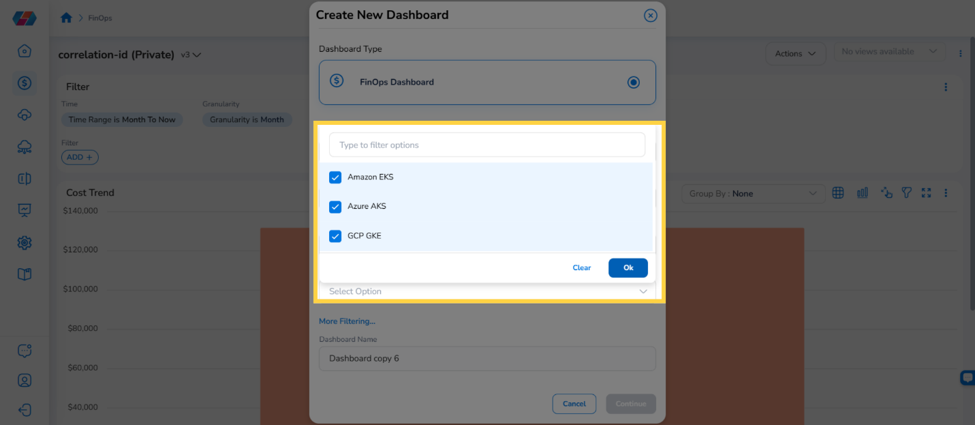
If you selected Kubernetes under Platform Type in Step 2, then in the Cluster Type field, select one or more cluster types — Amazon EKS, Azure AKS, or GCP GKE.
Step 5: (Optional) Add scoping filters
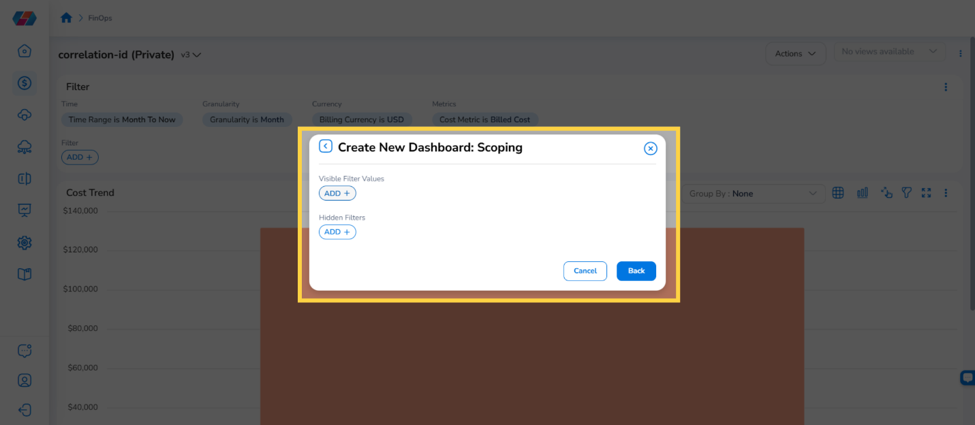
Click More Filtering to open the scoping panel. Click ADD+ under Visible Filter Values or Hidden Filters to add a filter, then click Back to return to the Create New Dashboard dialog.
Step 6: Type the name of the dashboard
In the Dashboard Name box, type a name for the dashboard.
Step 7: Click Continue
Click Continue. The new dashboard is created, and the dashboard name appears on the top-left side of the screen.
Note: To open a different dashboard, click the drop-down list on the top-left side of the screen and select another dashboard.
Additional Tasks
Adding a Dashboard Widget
A widget is a chart or trend that you add to a dashboard to visualize specific cost or security data. You can add multiple widgets to a single dashboard.
Navigate to FinOps > Dashboard > Actions, then click Add Widget. The Create New Widget screen displays.
Step 1: Select a widget type
From the drop-down list, select a category — General, FinOps, or SecOps — then select the specific widget type. For example, select General > Filter Widget. Click Next.
Note: Most widgets are data-driven, so you may need to filter the data shown in a visualization to view specific details — this is done with a Filter widget. After you create a Filter widget, other widgets can bind to it; when the filter selection changes, every widget bound to it updates automatically. When binding a widget to a filter, you can override specific settings for that widget only — for example, pinning a widget to a fixed time range so it doesn’t change when the dashboard’s filter does.
Step 2: Configure data binding
On the Data Binding tab, in the Target Filter list, select the filter to bind the widget to. To override a specific setting for this widget only, toggle Override Time Range, Override Currency, Override Tenants, Override Cloud Providers, or Override Cloud Accounts. Click Next.
Step 3: Set the refresh rate
On the Refresh Rate tab, turn on Refresh Automatically, then select how often the widget refreshes from the drop-down list. Click Next.
Step 4: Select the chart type
On the Chart Type tab, select a chart type — for example, Bar — to display the widget’s data. Click Next.
Step 5: Configure the legend
On the Legend tab, configure the legend settings as needed. Click Next.
Step 6: Name the widget
On the Name & Description tab, enter a Title and Description for the widget, and select a Toolbar Behavior option.
Step 7: Save the widget
Click Finish.
Editing a Dashboard or Widget
Navigate to FinOps > Dashboard, select the dashboard you want to edit from the drop-down list, then click Actions > Edit to enter editing mode.
Note: You can rename the dashboard while in editing mode. Update the Dashboard Name field, then click the Apply Changes (tick) icon.
Step 1: Add a widget in edit mode
Click the + icon in the Add Widget toolbar at the bottom of the screen, or select Add Widget from the Actions menu, then follow the steps in Adding a Dashboard Widget above.
Depending on the widget type, additional configuration tabs may appear that aren’t part of every widget’s wizard
- Chart Limit — select a limit for the number of items shown. When Data Table is selected as the chart type, a Variance checkbox is also available here: enable it to show the Change column with both absolute cost and variance percentage, or disable it to show only absolute cost values. This applies to Cost, Cost and Forecast, Cost Variance, Kubernetes Cost Trend, and Kubernetes Forecast Trend widgets; existing widgets keep showing variance by default until you change it.
- Dimension — select a dimension, then select the attribute value to scope the widget’s data to.
- Group By — select a grouping, then select the attribute value to group the widget’s data by.
- Cost Summary Type (Cost Summary widget only) — select Top Group By, then Dimensions, then the specific attribute. For example, selecting Department and then Engineering limits the widget to the top teams under that department.
Step 2: Resize a widget
Click and hold the resize handle (dot) on a widget’s edge, then drag to adjust its width or height.
Step 3: Remove a widget
Click the ellipses on the widget, then click Cut to remove it from the dashboard.
Step 4: Save your changes
Click the Apply Changes (tick) icon to save the changes to the dashboard.
Tip: The same toolbar also gives you Undo/Redo, dashboard Versions, and the Dashboard Name field, so you don’t need to leave edit mode to make those changes.
Deleting a Dashboard
Navigate to FinOps > Dashboard, select the dashboard you want to delete, then click Actions > Delete.
Step 1: Confirm the deletion
In the confirmation dialog, click Yes.
Warning: Deleting a dashboard removes it immediately.
Frequently Asked Questions
Q: I don’t see a “Cloud Account” or “Cloud Provider” filter on my widgets anymore — where did it go?
These filters were renamed: Cloud Account is now Account, and Cloud Provider is now Provider. On any widget, click the Filter icon in the top-right corner to view its predefined filters — Provider appears there by default. To add the Account filter, click ADD+, select Account, choose the values you need, and click OK.
Q: Can I select both Kubernetes and AI Services under Platform Type in the same dashboard?
Yes. If you select both, the AI Services and Cluster Type fields both appear, and you choose providers and cluster types independently for each — for example, AWS and Anthropic under AI Services, and Amazon EKS under Cluster Type, in the same dashboard.
Q: What’s the difference between Visible Filter Values and Hidden Filters in the More Filtering panel?
Based on the field names, Visible Filter Values are exposed as filters that end users can adjust on the dashboard, while Hidden Filters apply a fixed scope to the dashboard without giving users a control to change it.
Q: Why don’t I see the Chart Limit, Dimension, or Group By tabs when I edit a widget?
These tabs are available only for certain widget types — they don’t appear in every widget’s configuration wizard. [VERIFY: confirm the exact list of widget types that support Chart Limit, Dimension, and Group By] If a tab you expect is missing, confirm the widget type first; it may not support that configuration.
Troubleshooting
The AI Services or Cluster Type field doesn’t appear after selecting Platform Providers
Cause: The AI Services field and the Cluster Type field are conditional — each only appears once you select the matching option (AI Services or Kubernetes) under Platform Type.
Solution:
- Confirm Platform Providers is selected under Targeting for.
- Under Platform Type, select AI Services to reveal the AI Services field, or select Kubernetes to reveal the Cluster Type field.
- Select the providers or cluster types you need in the field that appears.
If the field still doesn’t appear after selecting the correct Platform Type option, contact CoreStack support with a screenshot of the Create New Dashboard dialog and your tenant ID.
A widget shows no data after being added to the dashboard
Cause: This usually happens when the widget’s Target Filter or data-binding scope doesn’t match any onboarded resources — for example, a widget bound to a Single Cloud filter for a provider with no onboarded accounts.
Solution:
- Open the widget’s configuration and check the Target Filter selection on the Data Binding tab.
- Confirm the filter’s scope (cloud provider, cluster, or SaaS tool) matches at least one onboarded account.
- If needed, override the scope for this widget only using the Override options on the Data Binding tab.
If the widget still shows no data after confirming the scope, contact CoreStack support with the dashboard name, the widget’s configuration, and your tenant ID.
Chart Limit, Dimension, or Group By tabs are missing when editing a widget
Cause: These tabs are available only for specific widget types; not every widget supports chart limiting, dimension scoping, or grouping.
Solution:
- Confirm the widget type shown in the Create/Edit Widget wizard.
- If the configuration you need isn’t available for that widget type, check whether a different widget type supports it.
If you’re unsure whether a widget type should support a given tab, contact CoreStack support with the widget type and dashboard name.
Updated about 5 hours ago