

Compliance Posture
Review cloud compliance by standard and policy in CoreStack Graphion, drill into control families and violated resources, and track posture over time.
Feature Overview
Compliance Posture is a dashboard in CoreStack's Graphion module. It shows how your cloud accounts perform against compliance standards and industry frameworks, such as CIS, NIST, HIPAA, and FedRAMP. Use it when you need to check the latest assessment results, find the controls and policies causing violations, or show compliance status for an audit.
This feature is most valuable to Compliance Admins, Compliance Members, and security teams who monitor and improve compliance across AWS, Azure, GCP, and OCI accounts. It reports on assessments and helps you act on them. It is not where you create or edit policies, standards, or remediation workflows.
Note: In earlier releases, Compliance Posture was under SecOps. It is now under Graphion.
How It Works
CoreStack assesses each onboarded cloud account against the compliance standards assigned to it. It records every control as a Success, Violation, Error, or Open item. The Compliance Posture page summarizes those results, either by standard (By Cloud Provider) or by policy (By Policies). From there, you drill into a standard's Compliance Visibility page to see results by control family and control. You can also open a policy's Violated Resources list to see exactly which resources failed. Results reflect the most recent assessment run, shown in the Last Run Date column, so run a new assessment when you need current data.
Prerequisites
Before you begin, make sure that:
-
Role: You have the Compliance Admin or Compliance Member role, or a role that includes Graphion compliance access.
-
Prior setup: At least one cloud account is onboarded and has one or more compliance standards assigned.
-
Assessment data: At least one assessment has run for the standard you want to review.
-
Access: You can open
Graphion > Compliance Posturein the CoreStack navigation.
Reviewing Compliance by Cloud Provider
Navigate to Graphion > Compliance Posture. The page opens on the By Cloud Provider tab. This tab lists every standard assessed for each cloud account.
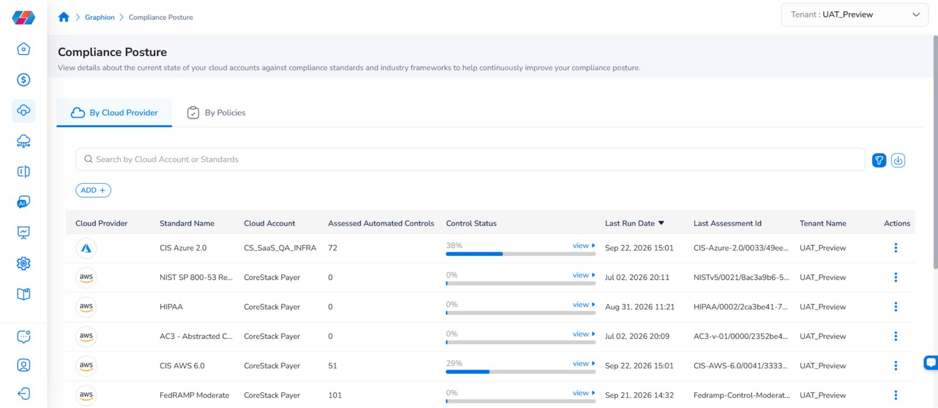
Compliance Posture page with the By Cloud Provider tab selected and the standards table visible
Step 1: Review the Standards List
Review the table. Each row is one standard assessed on one cloud account, with these columns:
-
Cloud Provider: The provider icon (AWS, Azure, GCP, or OCI).
-
Standard Name: The compliance standard, such as CIS Azure 2.0 or HIPAA.
-
Cloud Account: The assessed account.
-
Assessed Automated Controls: The number of controls CoreStack evaluated automatically.
-
Control Status: The percentage of controls that passed.
-
Last Run Date: When the latest assessment ran.
-
Last Assessment Id: The ID of the latest assessment.
-
Tenant Name: The tenant that owns the account.
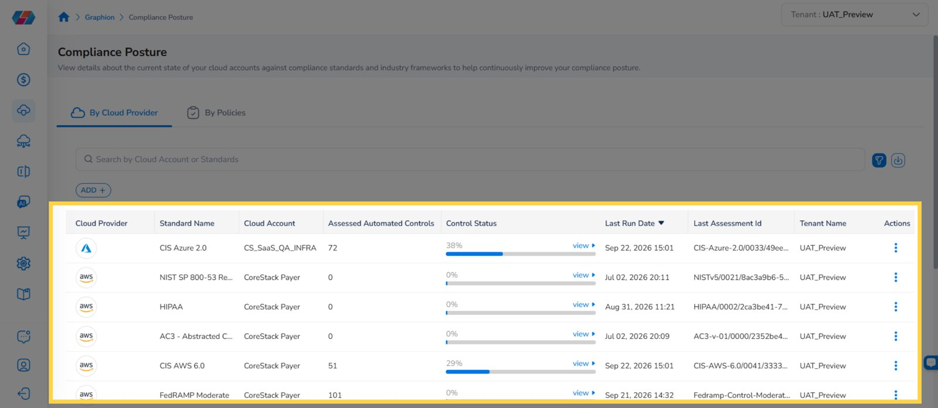
Standards table on the By Cloud Provider tab
Step 2: View the Control Status Breakdown
In the Control Status column, click View for a standard. A pop-up shows the count and percentage of Successes, Violations, and Errors, plus the assessment time.
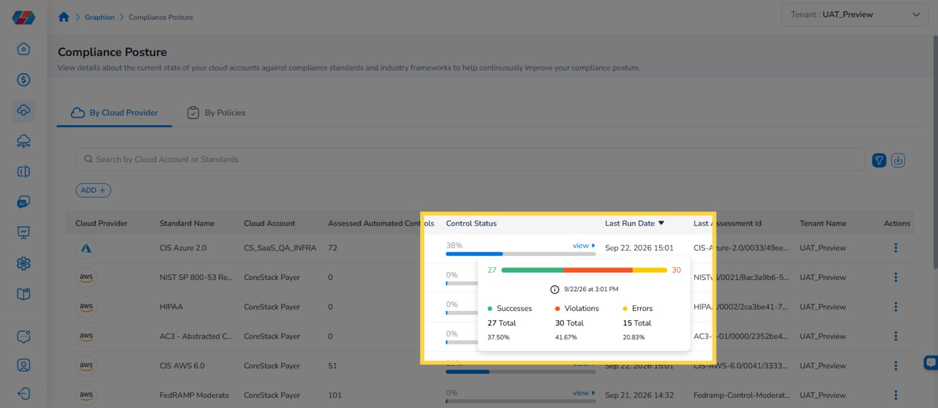
Control Status pop-up showing Successes, Violations, and Errors counts
Step 3: Search for an Account or Standard
Type in the Search by Cloud Account or Standards box. The table updates to show matching rows.
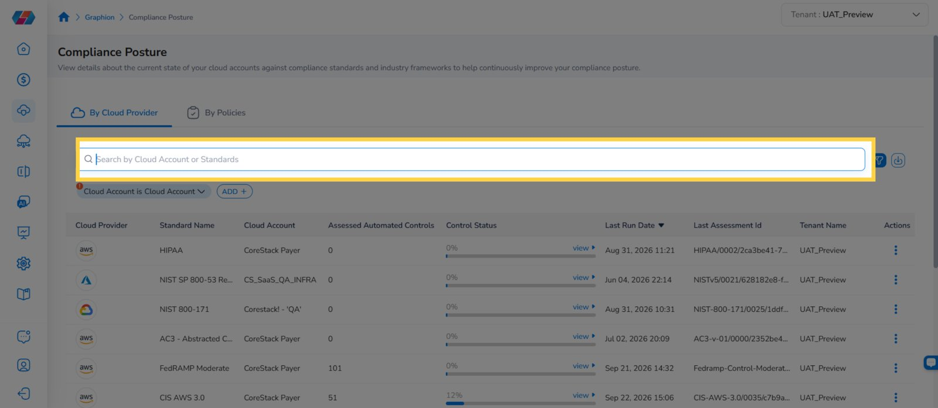
Search by Cloud Account or Standards box highlighted
Step 4: Add a Filter
Click ADD below the search box and select Cloud Account, Cloud Provider, or Standards. Choose the values you want. The filter appears as a chip, and the table shows only matching rows.
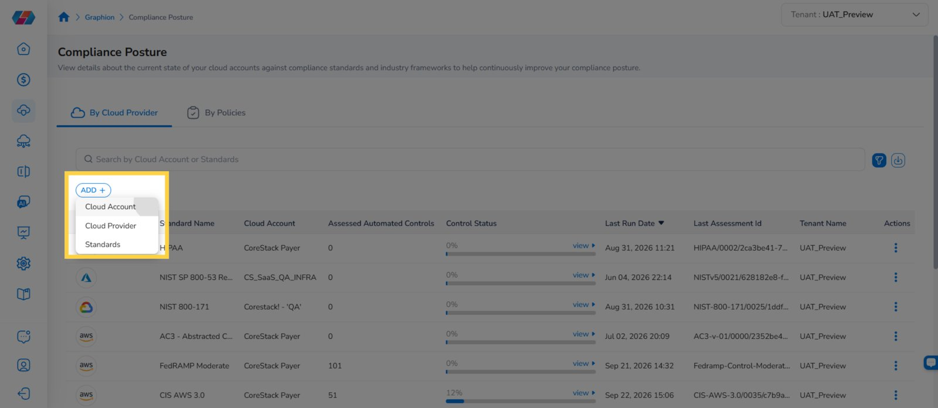
ADD menu showing Cloud Account, Cloud Provider, and Standards options
Tip: To change or remove a filter, click its chip. You can add more than one filter.
Step 5: Download Compliance Data
Click the Download icon at the top right of the table to export the compliance data.
Download icon at the top right of the Compliance Posture table
Taking Action on a Standard
Each standard has an Actions (⋮) menu at the end of its row. Click it to see these options:
| Option | What it does |
|---|---|
| View | Opens the Compliance Visibility page for the standard. See the next section. |
| Improve | Opens the By Policies tab filtered to this standard, so you can work on failing policies. |
| Start Assessment | Runs a new assessment for the standard and cloud account. A confirmation message appears when it starts. |
| Complete Assessment | Marks the in-progress assessment as complete and finalizes its results, including any manual control statuses you recorded. The Last Run Date and Last Assessment Id update to this assessment. |
| Standard | Shows the list of controls in the standard for the cloud account. |
| Download Policy Violation Summary | Downloads a summary of policy violations for the standard in Excel format. |
| Download Policy Violation Grouped by Resource Type | Downloads policy violations grouped by resource type in Excel format. |
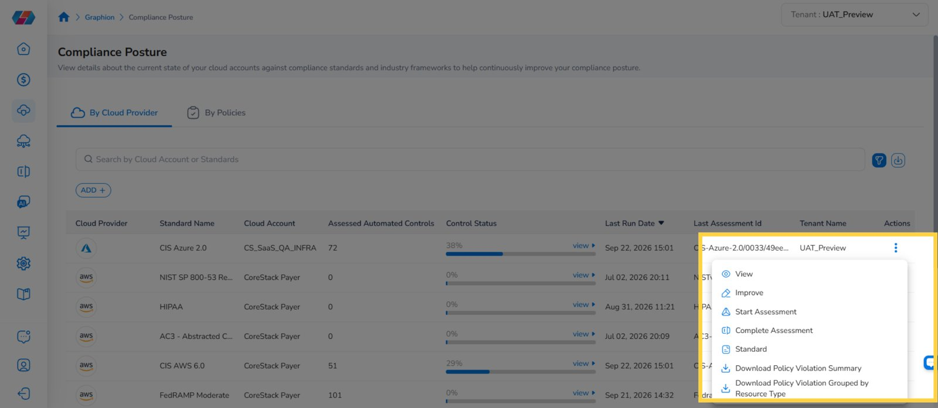
Reviewing Compliance Visibility for a Standard
Click Actions (⋮) > View for a standard. The Compliance Visibility page opens. At the top, it shows the Cloud Provider, Cloud Account, and Compliance Standard being reviewed. The page has two tabs: Summary and Control Family.
Step 6: Review Summary Metrics
On the Summary tab, review the metric cards:
-
% Controls Compliant: The share of controls that passed.
-
% Resources Compliant: The share of evaluated resources that passed.
-
Tenant: The tenant the account belongs to.
-
Control Count By Status: How many controls are in Success, Violations, Errors, and Open.
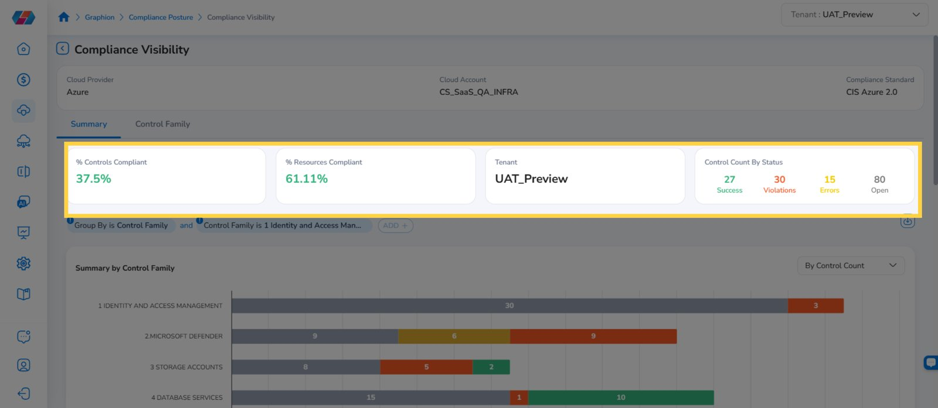
Summary metric cards highlighted
Step 7: Adjust the Chart Filters
Review the filter chips above the charts, for example Group By is Control Family. Click a chip to change it, or click ADD to add another filter. The charts update to match.
Step 8: Change the Chart Metric
In the Summary by Control Family chart, open the drop-down and select By Control Count, By Policy Count, or By Resource Count. The chart then measures the selected item.
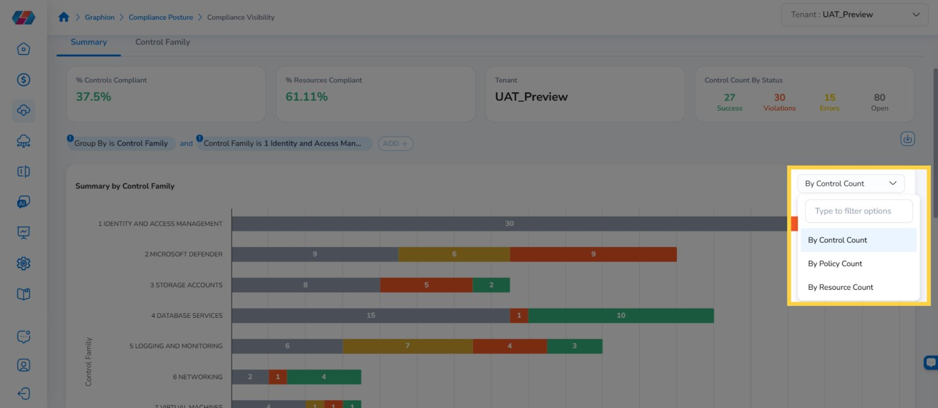
Summary by Control Family drop-down with the three count options
Step 9: Review Summary by Control Family
Review the Summary by Control Family chart. Each bar shows the status breakdown for one control family. Hover over a bar to see its exact Successes, Violations, Errors, and Open counts.
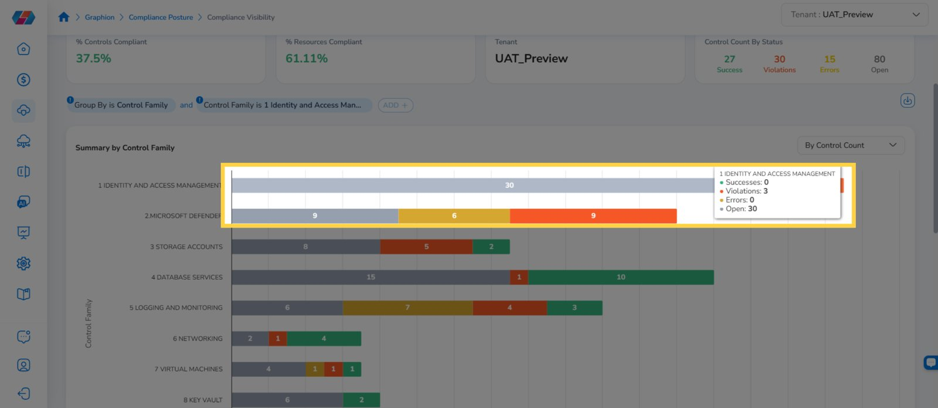
Stacked bar chart with a hover tooltip on one family
Step 10: Review the Compliance Control Trend
Scroll down to the Compliance Control Trend chart. It plots Successes, Violations, and Errors for each assessment date. Hover over a data point to see the counts for that date.
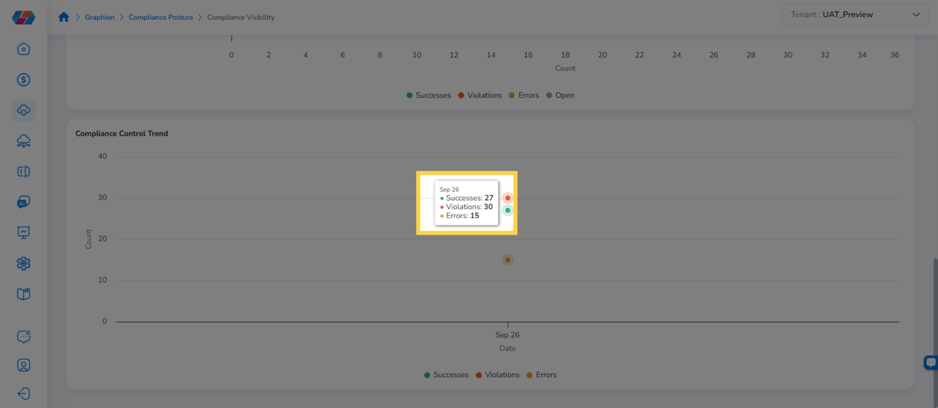
Compliance Control Trend chart with a data point tooltip
Step 11: Download Visibility Data
Click the Download icon on the right side of the page to export the compliance details.
Step 12: Open the Control Family Tab
Click the Control Family tab. A status bar at the top shows the scan state and the policy status counts.
Step 13: Select a Control Family
In the Control Family / Sub-Family panel, select a family. Each family shows its control count and compliance percentage. Use the search box to find a family, sub-family, or control by name.
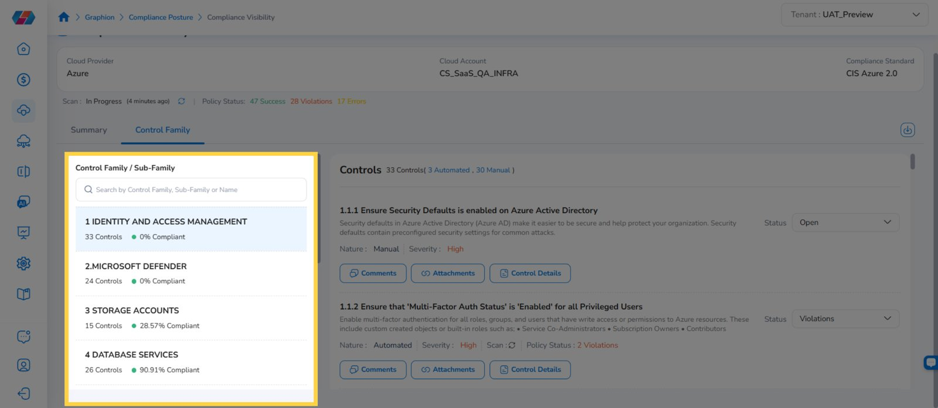
Control Family / Sub-Family panel listing families with control counts and compliance
Step 14: Review the Controls
Review the Controls panel. The header shows the total number of controls and how many are automated and manual. Each control shows its name, description, Nature, Severity, and Policy Status. Automated controls also show a scan option.
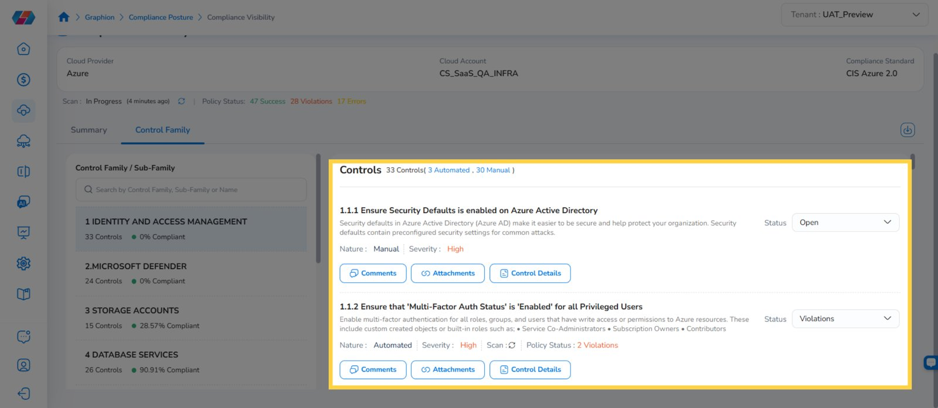
Controls panel showing one manual and one automated control
Step 15: Add Comments or Attachments
Click Comments to add notes to a control, or Attachments to upload supporting evidence. This is useful for documenting manual controls during an audit.
Step 16: View Control Details
Click Control Details to open the control's full definition and attributes.
Step 17: Update a Control's Status
Open the Status drop-down for a control and select Open, Success, or Violations. Use this to record the outcome of manual controls that CoreStack cannot evaluate automatically.
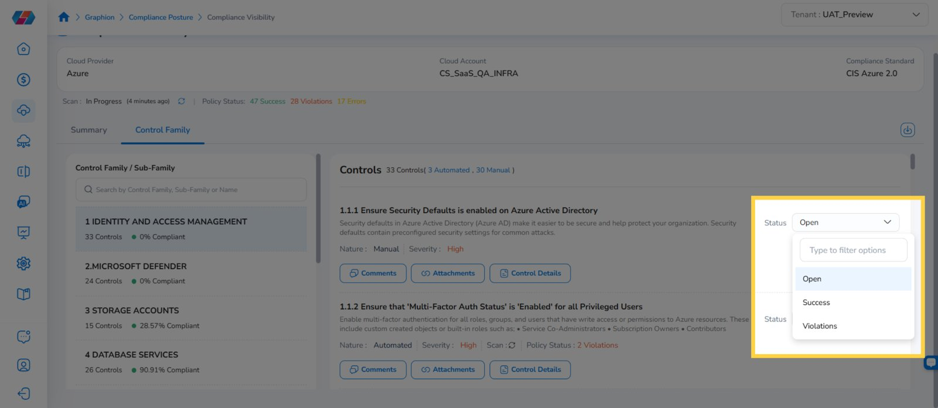
Status drop-down with Open, Success, and Violations options
Reviewing Compliance by Policies
Navigate to Graphion > Compliance Posture and click the By Policies tab. This tab lists policies instead of standards, so you can see which policies cause the most violations.
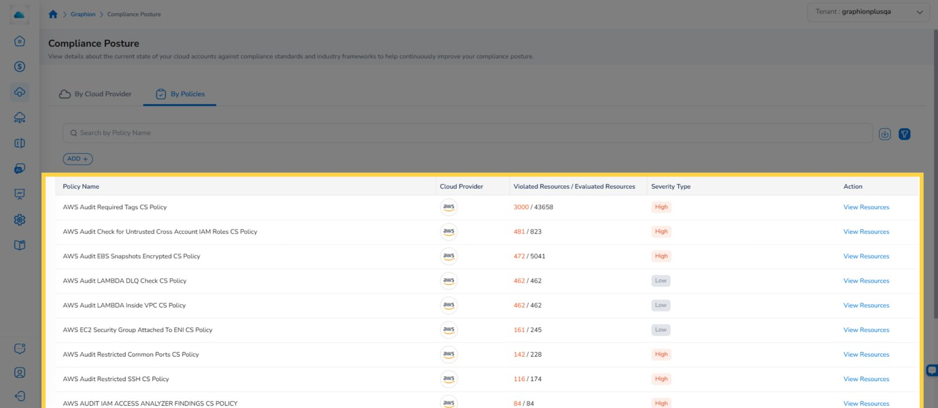
By Policies tab with the policy table
Step 1: Review the Policy List
Review the table. Each policy shows:
-
Policy Name
-
Cloud Provider
-
Violated Resources / Evaluated Resources: How many resources failed out of those checked.
-
Severity Type: For example, High or Low.
-
Action: A View Resources link.
Step 2: Search for a Policy
Type in the Search by Policy Name box to find a specific policy.
Step 3: Filter Policies
Click ADD and select a filter field. The available fields are Cloud Account, Cloud Provider, Policy, Remediation Available, Resource, Resource Category, Resource Type, Severity, and Standards. Choose the values you want to narrow the list.
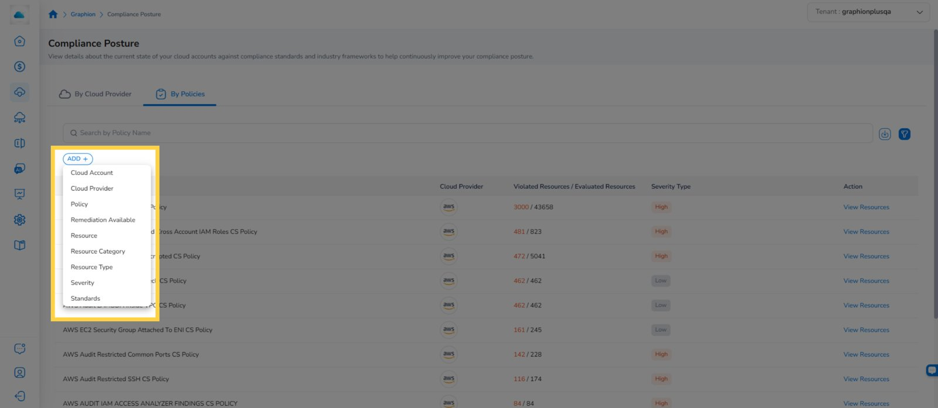
ADD menu on the By Policies tab showing all filter fields
Step 4: Open Violated Resources
Click View Resources for a policy. The Violated Resources page for that policy opens.
Step 5: Review Violated Resources
Review the resources that failed the policy. Each row shows the Resource ID, Resource Name, Resource Type, Region, Cloud Account, Remediation Status, and Tenant.
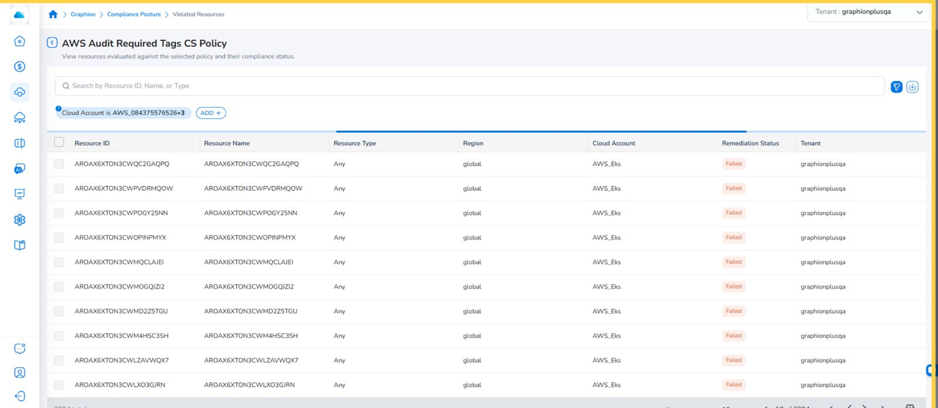
Violated Resources page for a selected policy
Step 6: Search and Filter Resources
Type in the Search by Resource ID, Name, or Type box, or click ADD to filter the list. For example, filter by Cloud Account to focus on one account.
Tip: : Click the back arrow next to the policy name to return to the By Policies tab.
Frequently Asked Questions
Q: Where did Compliance Posture go? I can't find it under SecOps.
Compliance Posture has moved to Graphion. Navigate to Graphion > Compliance Posture.
Q: What happened to the Filter icon and the Advanced Filter panel?
They have been replaced by filter chips. Click ADD below the search box, select a field, and choose values. Each filter appears as a chip that you can change or remove.
Q: Why does a standard show 0% or 0 assessed automated controls?
Either no assessment has run yet, or the standard has no automated controls for that account. Check the Last Run Date. If needed, run a new assessment with Actions (⋮) > Start Assessment.
Q: What is the difference between Violations, Errors, and Open?
Violations are controls where resources failed the check. Errors are controls CoreStack could not evaluate, often because of permission or data issues. Open controls have not been evaluated. These are typically manual controls waiting for a status update.
Q: Why is % Controls Compliant different from % Resources Compliant?
They measure different things. One control can cover many resources. A control fails if any resource violates it, while resource compliance counts each resource individually.
Q: Can I change a control's status manually?
Yes, for manual controls. On the Control Family tab, open the control's Status drop-down and select Open, Success, or Violations. Add a comment or attachment to record why.
Troubleshooting
Compliance data looks out of date
Cause: The page shows results from the last assessment run. It does not show live resource state.
Solution:
-
Check the Last Run Date for the standard.
-
Click Actions (⋮) > Start Assessment to run a new assessment.
-
Refresh the page after the assessment completes. The Last Run Date and Control Status values update.
A standard or account is missing from the list
Cause: A filter chip is hiding it, the standard is not assigned to the account, or you are viewing a different tenant.
Solution:
-
Remove any active filter chips and clear the search box.
-
Check the Tenant selector at the top right of the page.
-
Confirm that the standard is assigned to the cloud account.
Many controls show Errors
Cause: CoreStack could not evaluate those controls. This usually happens because the cloud account's credentials lack the required read permissions.
Solution:
-
Check the cloud account's onboarding permissions and credential status.
-
Update the permissions, then run a new assessment.
-
Check whether the Errors count in Control Count By Status goes down.
If the issue persists, contact CoreStack support with the tenant name, cloud account, standard name, Last Assessment Id, and a screenshot of the Control Status pop-up.
Updated about 6 hours ago