

Waste Optimisation Dashboard
Learn how to read the Waste Optimisation Dashboard in CoreStack's FinOps Rate Optimization Agent, covering waste KPI summary, commitment waste analysis, root cause breakdown, and recovery planning.
Feature Overview
The Waste Optimisation Dashboard is a dashboard within CoreStack's FinOps Rate Optimization Agent that gives FinOps leads and cloud cost analysts a single-screen view of commitment portfolio waste.
It answers the central question: how much is my portfolio wasting, and what do I do about it? The dashboard breaks waste down by type (sunk vs ongoing), identifies which commitments are driving it, explains why through root cause analysis, and pairs every finding with a prioritized recovery plan. It is a companion to the Portfolio Health Assessment — where the Portfolio Health Assessment asks "is my portfolio healthy?", this dashboard asks "where is the waste and what is the recovery path?"
This dashboard is not a procurement or purchasing tool — it surfaces waste analysis and recovery recommendations for review. Executing recovery actions is completed in separate workflows.
Note: The Rate Optimization Agent is currently in Beta. Contact your CoreStack administrator if AI Agents is not visible in your left navigation panel.
How It Works
When you open the Waste Optimization Dashboard, the agent fetches commitment portfolio data and renders the dashboard in a single screen. The KPI row gives you a headline waste read in under ten seconds. The Waste by Commitment chart and Sunk vs Ongoing Waste donut identify where waste is concentrated and how much of it is still recoverable. The Root Cause Breakdown and Recovery Actions charts explain why waste exists and what specific actions address it. The Waste Detail and Recovery Plan tables provide the per-commitment data needed to plan and prioritize remediation. Data reflects the portfolio state at the time of report generation.
Note: If a data value is genuinely unavailable, the dashboard displays an em-dash (—) rather than $0 or 0%. An em-dash means the data is absent, not that the value is zero.
Prerequisites
Before you begin, ensure the following:
-
Role: You have the appropriate role and permissions assigned in CoreStack.
-
Access: AI Agents is visible in your CoreStack left navigation panel.
-
Data: At least one active commitment (Reserved Instance or Savings Plan) is onboarded to CoreStack.
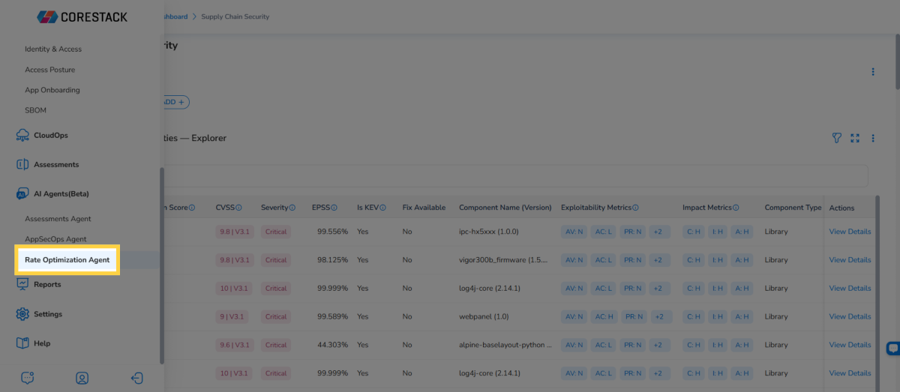
Navigate to AI Agents > Rate Optimization Agent, open the Overview panel, and select Waste Optimisation Dashboard from the dashboard selector.
Reading the Waste Optimisation Dashboard
The dashboard is organized into six reading zones. Read from top to bottom for a complete picture of portfolio waste, or jump to the zone that matches your current question.
Zone 1 — Waste KPI Summary
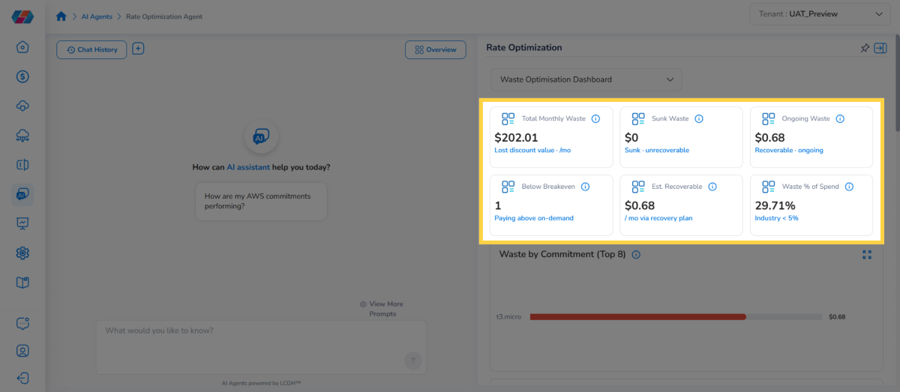
The top of the dashboard displays a row of six KPI cards that give a 10-second read of portfolio waste across key metrics.
-
Total Monthly Waste: Total cost of wasted commitment capacity across the portfolio in a month.
-
Sunk Waste: Portion of waste already incurred and unrecoverable — commitment cost paid for capacity that was never used.
-
Ongoing Waste: Portion of waste still occurring that is recoverable through action.
-
Below Breakeven: Count of commitments currently paying more than equivalent on-demand pricing, actively losing money.
-
Est. Recoverable: Estimated amount recoverable from the portfolio through the current recovery plan.
-
Waste % of Spend: Total waste as a percentage of total commitment spend, benchmarked against the industry target of less than 5%.
If any KPI source value is unavailable, the card displays — rather than $0 or 0%.
Zone 2 — Waste by Commitment
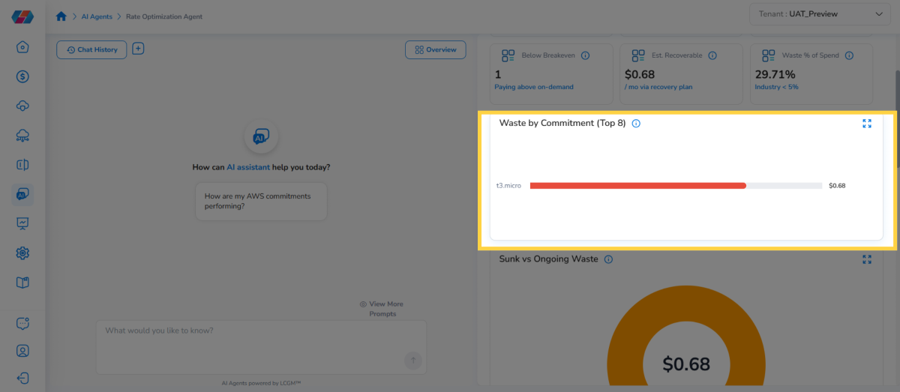
The middle section of the dashboard identifies which specific commitments are driving portfolio waste.
- Waste by Commitment (Top 8): Horizontal bar chart ranking the top eight commitments by monthly waste amount, sorted highest to lowest. Use this chart to identify the specific commitments contributing most to portfolio waste before drilling into the detail tables below.
Zone 3 — Sunk vs Ongoing Waste
Below the commitment chart, a donut visualization shows the recoverability split of total portfolio waste.
- Sunk vs Ongoing Waste: Donut chart showing how total portfolio waste divides between sunk waste (unrecoverable) and ongoing waste (recoverable). The total waste amount is displayed in the center. Use this chart to understand how much of the portfolio's waste is still actionable before reviewing root causes.
Zone 4 — Root Cause Breakdown and Recovery Actions
Two charts appear side by side to answer the "why" and "what to do" questions about portfolio waste.
- Root Cause Breakdown: Horizontal bar chart showing the root causes of portfolio waste, ranked by waste amount. Each bar represents a distinct cause category. Use this chart to understand why waste is occurring.
- Recovery Actions: Horizontal bar chart showing the recommended recovery actions for the portfolio's waste, ranked by estimated recovery amount. Review this chart alongside Root Cause Breakdown to see the cause-and-remedy pairing for each waste driver.
Zone 5 — Waste Detail
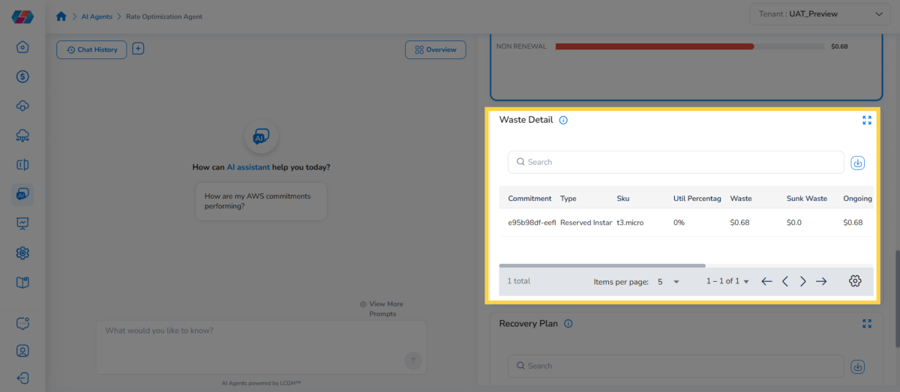
The Waste Detail table provides per-commitment waste data for triage.
- Waste Detail: Table listing each underperforming commitment with columns for Commitment (identifier), Type, SKU, Utilization %, Waste, Sunk Waste, and Ongoing. Use this table to identify specific commitments and understand how their waste breaks down between sunk and recoverable amounts.
Zone 6 — Recovery Plan
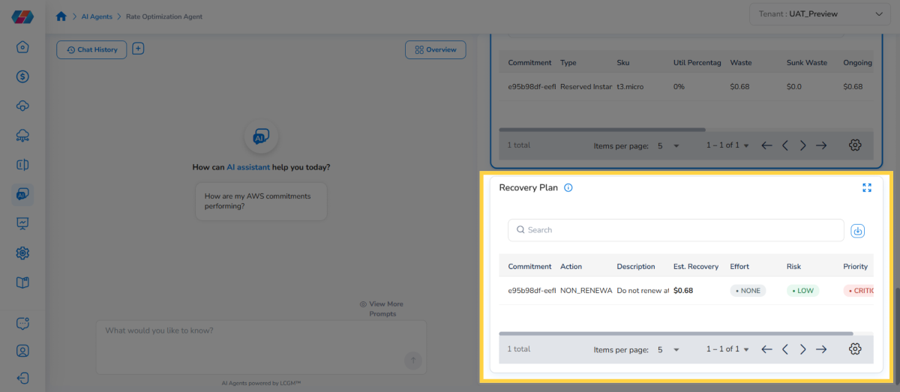
The Recovery Plan table provides the actionable output of the waste analysis — a prioritized list of remediation steps per commitment.
- Recovery Plan: Table listing recommended actions for each wasting commitment with columns for Commitment (identifier), Action (action type), Description, Est. Recovery, Effort, Risk, and Priority. Actions are sorted from CRITICAL to LOW priority so the most impactful remediation steps surface first.
Frequently Asked Questions
Q: What is the difference between Sunk Waste and Ongoing Waste?
Sunk Waste is commitment cost already paid for capacity that was never used — it cannot be recovered. Ongoing Waste is waste still accumulating that can be reduced through action such as non-renewal, exchange, or rightsizing. The Sunk vs Ongoing Waste donut (Zone 3) shows the split; the Est. Recoverable KPI card shows how much of the ongoing waste is addressable.
Q: What does an em-dash (—) mean in a KPI card or table cell?
The underlying data was genuinely unavailable at report generation time — not zero. Refresh the dashboard or check whether the affected cloud account has an active sync error in CoreStack.
Q: Why is the Below Breakeven count important?
A commitment flagged as Below Breakeven is actively losing money compared to on-demand pricing. Even a single below-breakeven commitment can represent significant negative ROI over the remaining term. This is the most urgent signal on the dashboard and should be reviewed before the other waste metrics.
Q: How is Root Cause Breakdown different from Recovery Actions?
Root Cause Breakdown explains why waste is occurring (for example, resource term mismatch, declining demand). Recovery Actions shows what to do about it (for example, non-renewal at expiry, exchange). Review both charts together to understand the full cause-and-remedy pairing before consulting the Recovery Plan table.
Q: Can I act on Recovery Plan recommendations directly from this dashboard?
No. This dashboard surfaces recovery recommendations for review. To execute a recommended action — for example, setting a non-renewal instruction for a commitment — use the relevant workflow outside this dashboard. The Recovery Plan table provides the action type, description, and estimated recovery amount to support that decision.
Troubleshooting
All KPI cards show em-dashes on load
Cause: The Rate Optimization Agent could not retrieve portfolio data at generation time. This is typically caused by a temporary connection issue or a cloud account sync error.
Solution:
- Refresh the dashboard and check whether the KPI cards populate.
- Navigate to AI Agents > Rate Optimization and confirm your cloud accounts are connected and reporting data.
- Check whether the affected cloud account has an active sync error in the CoreStack account list.
If the issue persists after these steps, contact CoreStack support with your tenant ID, the generation timestamp, and a description of which cards are showing em-dashes.
Recovery Plan table is empty despite non-zero waste KPI values
Cause: The Recovery Plan is generated by a separate planning process. If that process did not complete successfully, the waste analysis renders but the Recovery Plan table remains empty.
Solution:
-
Reload the dashboard to trigger a fresh generation.
-
Check the Waste Detail table — if commitment-level waste data is present, the underlying analysis completed and the Recovery Plan may populate on the next render.
If the Recovery Plan table remains empty after reload while the Waste Detail table shows waste data, contact CoreStack support with your tenant ID and the generation timestamp.
Updated about 2 months ago