

Portfolio Health Assessment
Learn how to read the Portfolio Health Assessment in CoreStack's FinOps Rate Optimization Agent, covering KPI summary, Agentic Insights, utilization analysis, and commitment health.
Feature Overview
The Portfolio Health Assessment is a dashboard within CoreStack's FinOps Rate Optimization Agent. It gives FinOps leads and cloud cost analysts a single-view read of commitment portfolio health — covering KPI summary, AI-generated insights, utilization analysis, optimization recommendations, and commitment-level detail. This dashboard surfaces findings for review; purchasing or modifying commitments is done in separate workflows.
Note: The Rate Optimization Agent is currently in Beta. Contact your CoreStack administrator if AI Agents is not visible in your left navigation panel.
How It Works
When you open the Portfolio Health Assessment, the agent fetches your commitment portfolio data and renders the dashboard. The Agentic Insights feed is the primary reading surface — it translates portfolio data into ranked, sentence-form findings. The charts and tables below confirm those findings at a deeper level. Data reflects the portfolio state at the time of report generation.
Note: If a data value is genuinely unavailable, the dashboard displays an em-dash (—) rather than $0 or 0%. An em-dash means the data is absent, not that the value is zero.
Prerequisites
Before you begin, ensure the following:
- Role: You have the appropriate role and permissions assigned in CoreStack.
- Access: AI Agents is visible in your CoreStack left navigation panel.
- Data: At least one active commitment (Reserved Instance or Savings Plan) is onboarded to CoreStack.
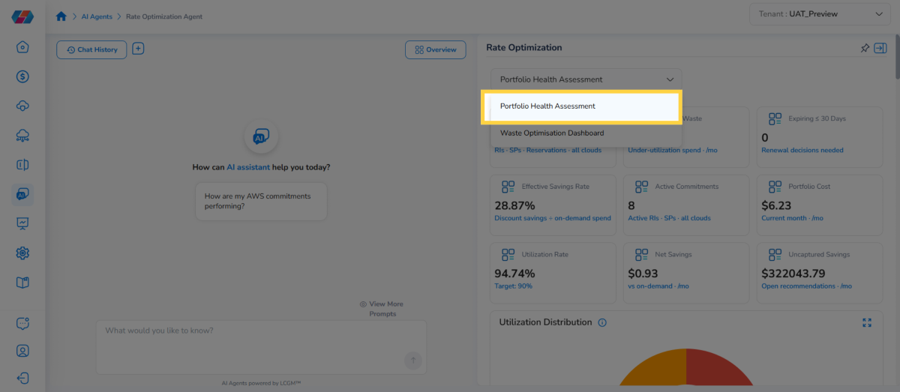
Navigate to AI Agents > Rate Optimization, open the Overview panel, and select Portfolio Health Assessment.
Reading the Portfolio Health Assessment
The dashboard is organized into six reading zones. Each zone answers a specific question about your portfolio.
Zone 1 — Portfolio Summary
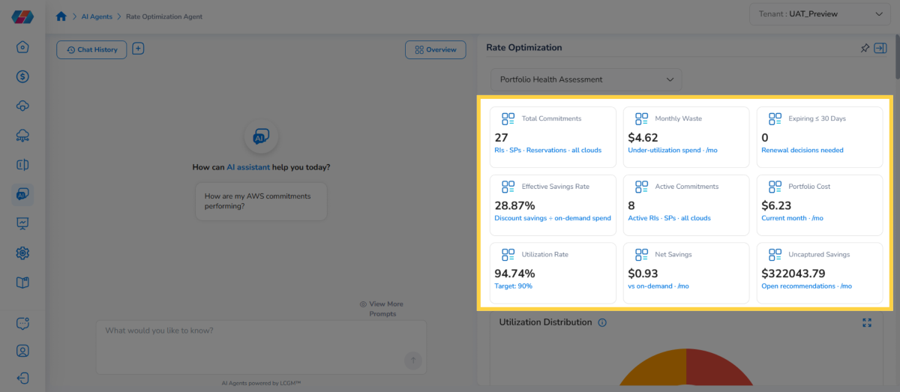
The top of the dashboard provides an at-a-glance read of your commitment portfolio's overall health through a row of headline KPI cards and a conditional expiry alert.
-
KPI Summary row: displays headline metrics across your commitment portfolio, including Total Commitments, Monthly Waste, Expiring commitments, Utilization Rate, and Uncaptured Savings.
-
Expiry Alert Bar (conditional): Appears only when one or more active commitments expire within 30 days. Lists up to three affected commitments; collapses any beyond three. Hidden when no commitment is within the 30-day window.
Zone 2 — Agentic Insights
The primary reading surface of the dashboard, translating portfolio data into ranked, sentence-form findings generated by the Rate Optimization Agent.
- Agentic Insights feed: Up to ten ranked, sentence-form findings. Each insight is labeled Actionable or Info. Shows top five by default; select Load More for the full list.
Zone 3 — Utilization and Savings Analysis
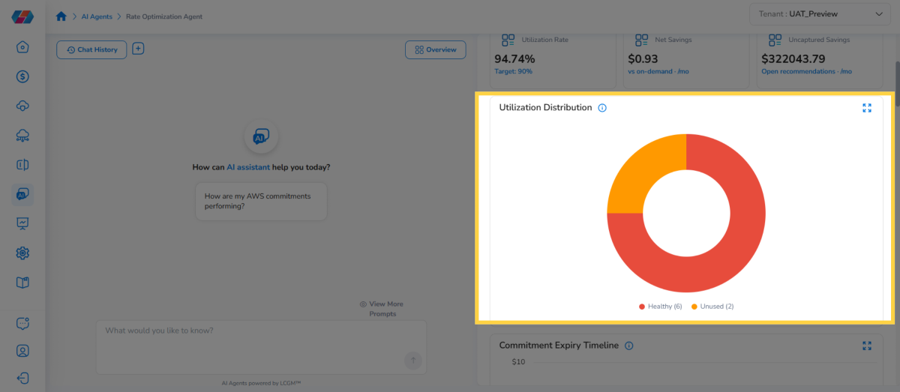
Visual analysis of how commitments are distributed across utilization health buckets and how commitment spend compares to on-demand equivalent cost.
- Utilization Distribution: Donut chart grouping active commitments into five heath buckets - Healthy (≥90%), Warning (70-80%), Action (50-69%), Critical (< 50%) and Unused (0%). Portfolio-weighted utilization percentage shown in the center.
- Savings Breakdown: Horizontal bar chart comparing on-demand equivalent cost, commitment cost, and net savings.
- Utilization Trend: Line chart tracking portfolio utilization over the trailing period against healthy and warning threshold lines.
Zone 4 — Optimization Opportunities
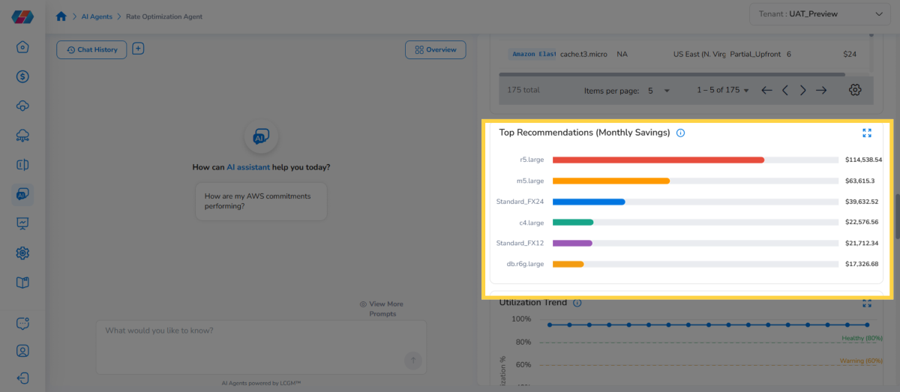
Surfaces rate-optimization recommendations ranked by estimated monthly savings, with per-SKU detail available in the accompanying table.
-
Top Recommendations (Monthly Savings): Horizontal bar chart ranking up to six optimization opportunities by estimated monthly savings.
-
Rate Recommendations table: Per-recommendation detail: service, SKU, region, quantity, and estimated monthly savings. Hover a row for annual savings, payment option, term, and lookback period.
Zone 5 — Commitment Health and Anomaly Monitoring
Per-commitment detail tables and anomaly detection to identify which specific commitments are underperforming and whether current spend data is affected by anomalies.
-
Active Commitments table: Lists every active RI and Savings Plan sorted by utilization ascending, so the lowest-performing commitments surface first.
-
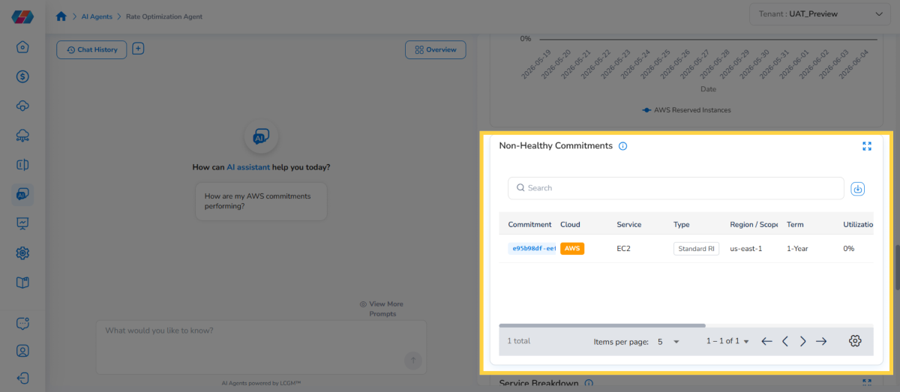
Non-Healthy Commitments table: Lists commitments currently below the 90% healthy utilization threshold with their utilization percentage.
-
Anomaly Summary (30 Days): Shows the financial impact of spend anomalies over the past 30 days, highlighting one to three peak-anomaly days.
-
Service Breakdown table: Groups the portfolio by cloud service and provider, showing commitment cost and utilization efficiency per service.
Zone 6 — Renewal Planning and Budget Health
Commitment expiry planning and budget consumption tracking to support renewal decisions and monitor spend against configured budget caps.
-
Commitment Expiry Timeline: Bucketed bar chart showing commitment expiry counts across 30-, 60-, 90-, and 180-day windows, color-coded by urgency. Hover a bucket to see individual commitment details.
-
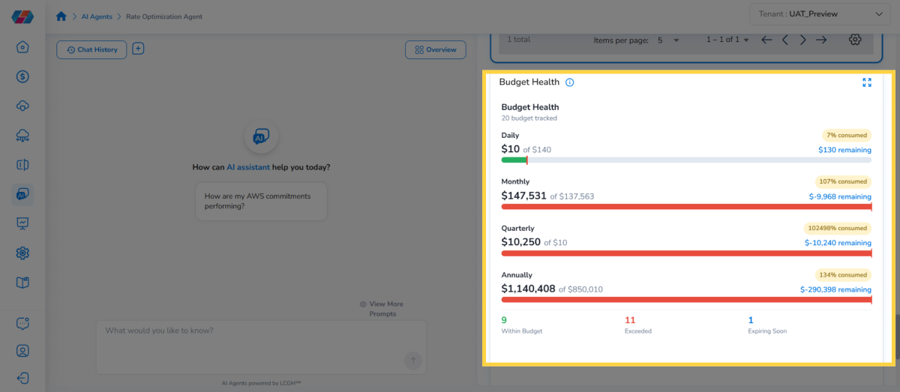
Budget Health: Progress bar showing spend consumption against your configured budget cap. Turns yellow at 80% and red at 95%. Displays a configuration prompt if no budget is set.
-
Suggested Next Steps: Footer section with direct links to recommended follow-on actions based on current portfolio state.
Frequently Asked Questions
Q: What does an em-dash (—) mean in a KPI card or table cell?
The underlying data was genuinely unavailable at generation time — not zero. Refresh the dashboard or check the Agentic Insights feed for context.
Q: Why is the Expiry Alert Bar not showing even though I have commitments expiring soon?
The bar only appears for commitments expiring within the next 30 days. Check the Commitment Expiry Timeline (Zone 6) for longer-horizon expiries.
Q: Agentic Insights flags a critical issue but the Utilization Distribution looks mostly healthy. Which is right?
Both. The donut sizes segments by count of commitments; Agentic Insights weights findings by dollar impact. A few large, expensive commitments can have major cost impact without dominating the donut. Treat Agentic Insights as the primary signal.
Q: How current is the data in this dashboard?
Data reflects the portfolio state at report generation time. The timestamp is in the report header. Reload the dashboard for a fresher snapshot.
Q: Can I act on recommendations directly from this dashboard?
No. This dashboard is for review only. Use the relevant procurement workflow outside this dashboard. The Suggested Next Steps section links to appropriate follow-on actions.
Troubleshooting
All KPI cards show em-dashes on load Cause: The Rate Optimization Agent could not retrieve portfolio data at generation time. This is typically caused by a temporary MCP connection issue or a cloud account sync error.
Solution:
- Refresh the dashboard and check whether the KPI cards populate.
- Navigate to AI Agents > Rate Optimization and confirm your cloud accounts are connected and reporting data.
- Check whether the affected cloud account has an active sync error in the CoreStack account list.
If the issue persists after these steps, contact CoreStack support with your tenant ID, the generation timestamp from the report header, and a description of which cards are showing em-dashes.
Agentic Insights feed is empty despite KPI warnings
Cause: Insights are derived from portfolio summary fields in the data payload. If those fields are present but the insights array is empty, the agent may not have generated findings from the current payload on the initial load.
Solution:
-
Reload the dashboard to trigger a fresh generation.
-
Check the Agentic Insights feed again after reload — findings sometimes require a full data refresh to populate.
If the feed remains empty while KPI cards continue to show warning or danger states, contact CoreStack support with your tenant ID and the generation timestamp.
Updated about 2 months ago