

Optimization Dashboard
Introduction
The Cost Optimizer dashboard gives you an all-up view of usage based cost optimization insights across your cloud accounts within a certain tenant or across all tenants.
The graphs and charts shown here will update in real-time whenever you adjust the filters to customize your view.
Users can hover over and click on the dynamic charts shown in this dashboard view to drill down deeper into the data and/or display more information, such as the region name, cloud provider, cost savings amount, and optimization type required.
How It Works
All four cloud providers — AWS, Azure, GCP, and OCI — have access to most FinOps features shown in this dashboard. The difference between providers is in optimization depth and number of available filters, not core cost management capability. Core FinOps functionality (ingestion, dashboards, reports, budgets, anomalies, Dimensions, chargeback) plus inventory, monitoring, and activity data are uniform across all four cloud providers.
AI and data-cloud providers (OpenAI, Anthropic, Databricks, Snowflake, and other supported third-party services) currently support cost-and-usage ingestion only. Utilization, log, and activity ingestion for these providers is on the roadmap.
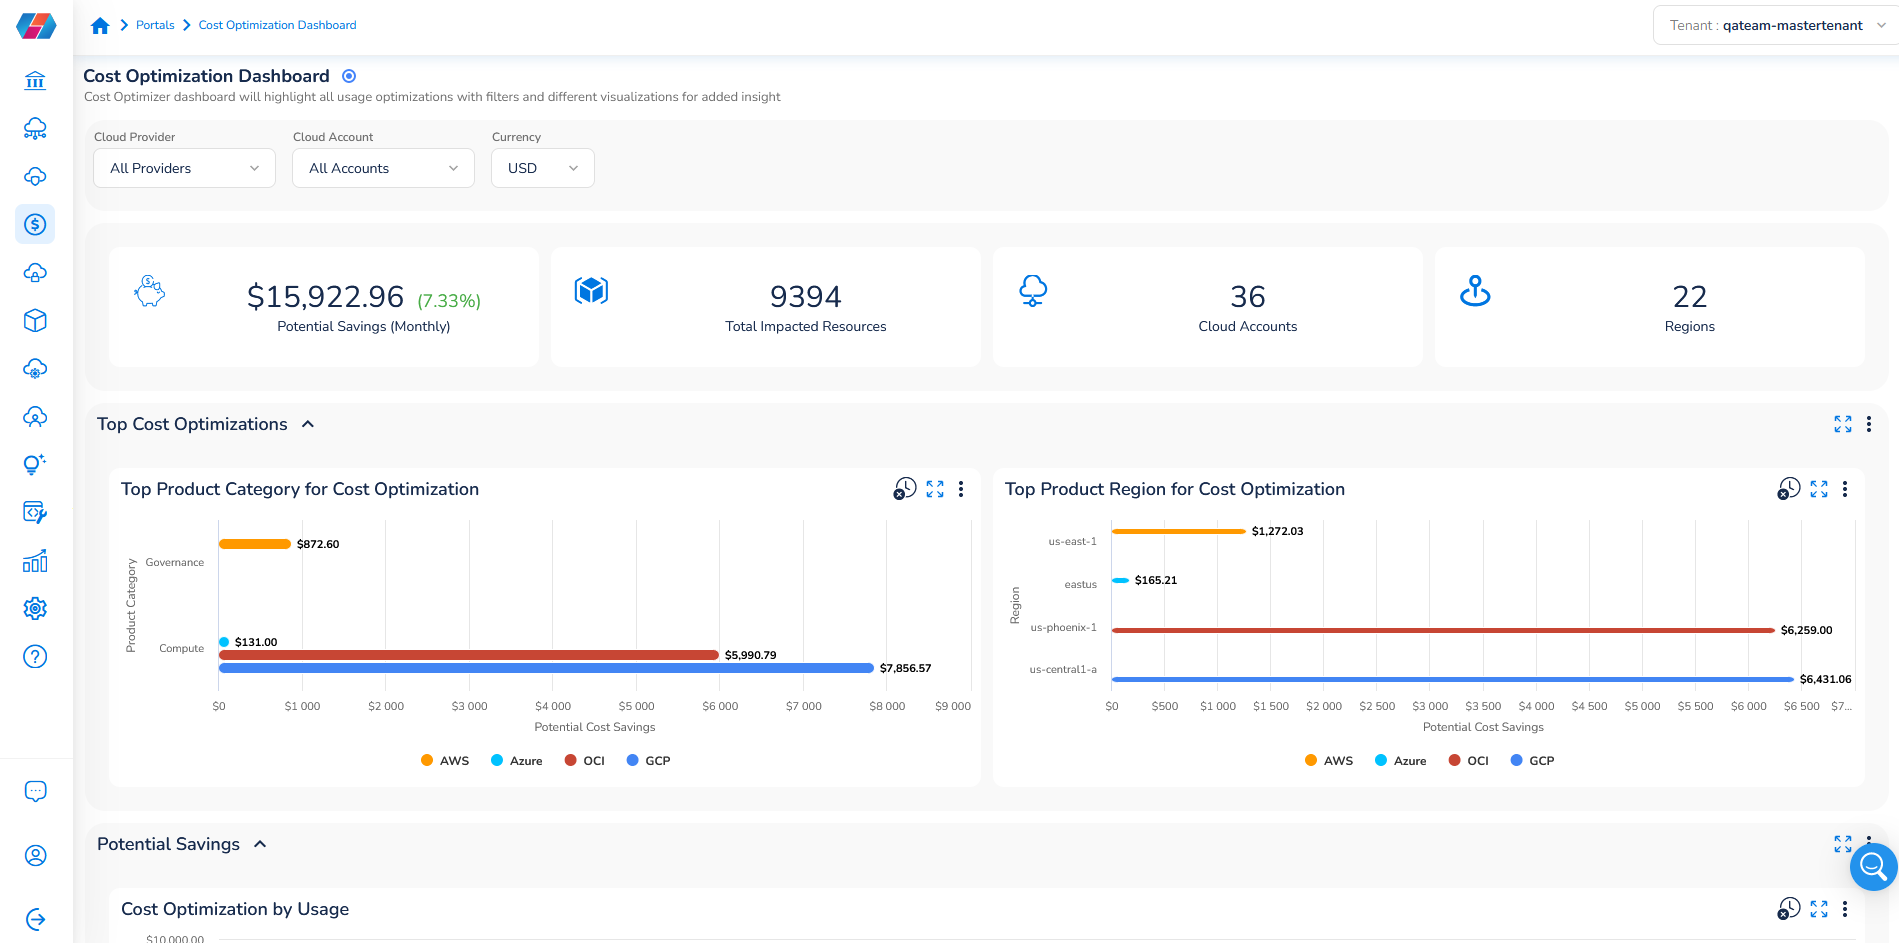
Navigating the Cost Optimization Dashboard
Filtering
The Filter tab at the top of the page can be used to filter your dashboard view by adjusting which cloud providers, cloud accounts, and currencies you want to show.
Grouping
The Grouping tab that appears just below the Filter tab shows you some high-level information about your potential cost savings based on your filters, as well as how many cloud accounts, resources, and regions are impacted by these savings.
Charts and analytics
Here are some of the charts you can find in the Cost Optimization dashboard tabs:
- Top Cost Optimizations
- Cost Optimization by Usage
- Potential Savings by Region
- Cost Optimization Trends
- Potential Savings by Resource Type
Additional actions
For each tab that shows graphical information, you can click to expand it and increase the size of the chart view on your screen.
You can also export the configuration details for a graphic or download that graphic as a .CSV file or .PNG image.
Updated 2 months ago