

OCI Cost Explorer Dashboard
Learn how to navigate and analyze OCI cloud costs in CoreStack FinOps using the OCI Cost Explorer Dashboard, including cost summary widgets, trend analysis, GroupBy filtering, and drilldown.
Feature Overview
The OCI Cost Explorer Dashboard is a centralized cost visibility tool within CoreStack's FinOps module that surfaces OCI cloud spend across three configurable widgets: OCI Cost Summary, OCI Cost Trend, and OCI Cost Variation Trend. It is most relevant when FinOps teams need to monitor, compare, and drill into OCI cloud spend at the tenancy, compartment, service, or region level.
This feature is most valuable to FinOps Admins and FinOps Practitioners who need to understand OCI cost drivers, track spending trends, and make informed cost management decisions. It does not replace native OCI billing tools --- it provides consolidated, cross-provider cost visibility within CoreStack FinOps.
Note: The OCI Cost Explorer Dashboard is visible only when at least one OCI cloud account is onboarded and active in CoreStack. Widget data reflects costs ingested from OCI billing pipelines and may lag by up to 24 hours.
How It Works
When an OCI cloud account is onboarded into CoreStack, billing data is ingested and surfaced in the OCI Cost Explorer Dashboard under FinOps. Users begin by setting global parameters --- time range, granularity, and currency --- that apply to all three widgets simultaneously. Each widget can then be configured with a GroupBy dimension (such as service, region, or compartment) and individual widget-level filters for focused analysis. Clicking any bar or data point in a widget opens a drilldown view showing cost breakdown by the selected dimension. Widget-level actions --- subscribe, export, expand, and more --- are accessible via the ⋯ ellipsis in each widget's header. Data is updated on the OCI billing pipeline ingestion schedule, typically with a short lag.
Prerequisites
Before you begin, ensure the following:
- Role: FinOps Admin, FinOps Practitioner, or FinOps Reader (read-only) assigned in CoreStack
- OCI Account: At least one OCI cloud account onboarded and active in CoreStack
- Access: Navigate to FinOps > Dashboard in the CoreStack navigation bar
- Global parameters: Decide on the time range and granularity before starting --- these apply to all widgets
Setting Up the OCI Cost Explorer Dashboard
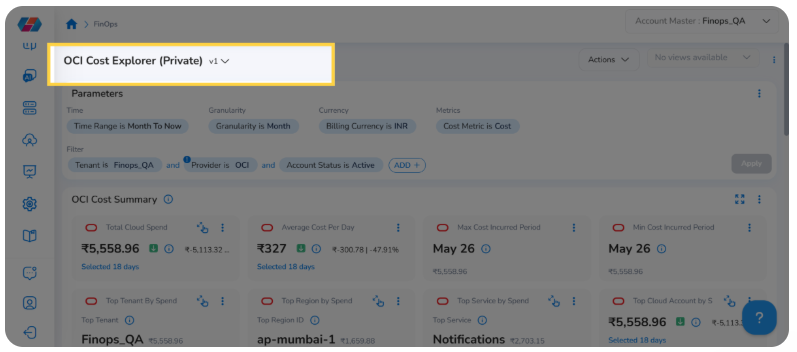
Navigate to FinOps > Dashboard in the CoreStack navigation bar, then click OCI Cost Explorer to open the dashboard. The three cost widgets load in the main canvas.
Step 1: Set Global Parameters
Click Selected [date range] at the top of the dashboard to open the global parameters panel. Set the following --- they apply to all widgets on the dashboard:
- Time Range: Select the period to analyse (e.g., Last 18 Days, Month to Now)
- Granularity: Choose Daily or Monthly. This affects the OCI Cost Trend and OCI Cost Variation Trend widgets
- Currency: Select the billing currency for cost display across all widgets
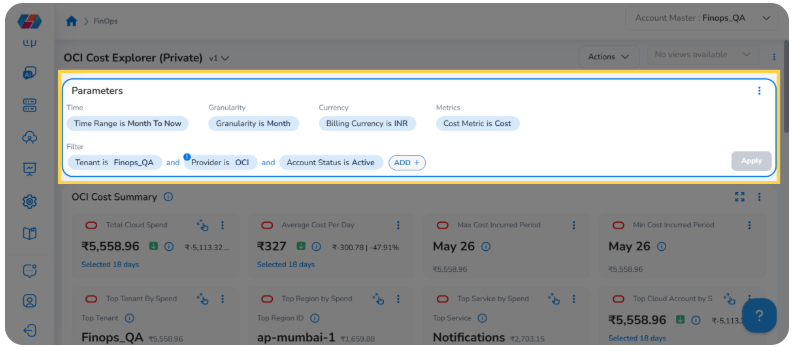
Step 2: Apply Dashboard-Level Filters
Click Add in the filter panel to apply a filter that scopes all widgets on the dashboard. Select the filter type (for example, Provider, Tenant, or Account Status), enter the value, and click Add to apply.
Dashboard-level filters apply to every widget simultaneously. To remove a filter, click the × next to it in the filter panel.
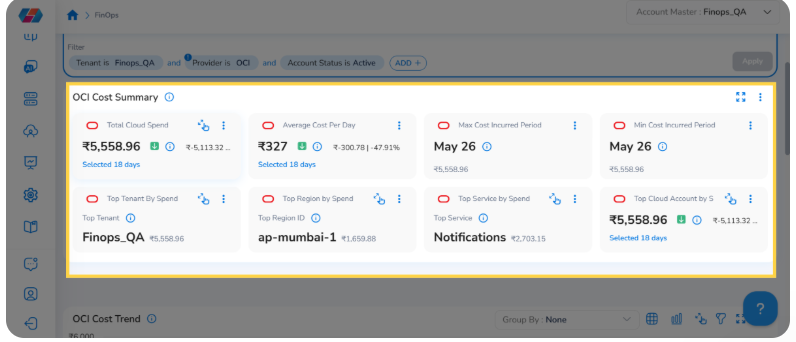
OCI Cost Summary Widget
The OCI Cost Summary widget provides a summary of OCI cloud account costs across various dimensions. It displays a set of summary cards, each representing a key cost metric. Use Group By on this widget to segment and compare cost data by dimensions such as service, region, or tenant.
Step 1: Expand and Access Widget Actions
The widget header contains two controls available on every widget on the dashboard:
- Expand: Click Expand to open the widget in full-screen view for a larger analysis canvas
- ⋯ Ellipsis: Click ⋯ to open the widget actions menu --- options include Configure Widget, Subscribe, Download CSV, Download PNG, Swap Axis, Accumulated Spend, and other actions
Step 2: Hover on the Widget Tooltip
Hover over the ⓘ info icon on the OCI Cost Summary widget to display its tooltip. The tooltip confirms that the widget provides a summary of costs for OCI cloud accounts across various dimensions.
Step 3: View Summary Card Details
Click any summary card to open its detailed cost breakdown. Available summary cards include:
- Total Cloud Spend
- Average Cost per Day
- Max Cost Incurred Period
- Min Cost Incurred Period
- Top Tenant by Spend
- Top Region by Spend
- Top Service by Spend
- Top Cloud Account by Spend
The detailed view displays the full cost breakdown and related sections for the selected card. Review this data to understand spend distribution before taking further action.
Step 4: Access Summary Card Actions
Click the ⋯ ellipsis on any summary card to open its additional actions menu. Available options include Configure Widget, Export Config, Copy, and more. Select the relevant action to proceed.
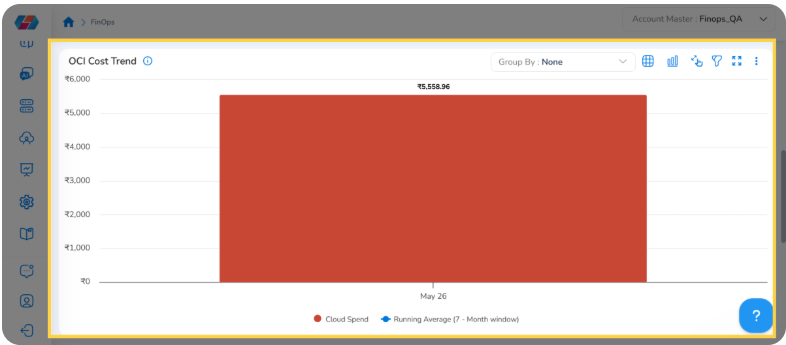
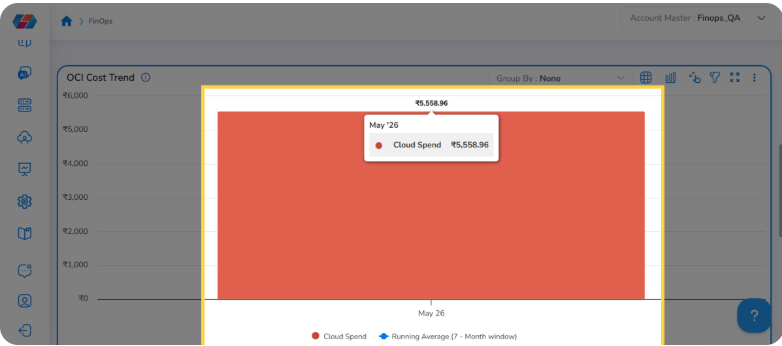
OCI Cost Trend Widget
The OCI Cost Trend widget shows cost trends by the granularity set in the global parameters. It supports GroupBy dimensions for comparative analysis, drilldown for deeper investigation, and cost forecasting for up to 12 months or 14 days depending on granularity.
Tip: To enable forecasting, select a To Now preset in the global time range (e.g., Month to Now). Forecasting is disabled for fixed date ranges.
Step 1: Apply GroupBy to the Widget
Click Group By: None on the OCI Cost Trend widget to open the GroupBy dimension selector. Select a dimension --- such as Service, Region, or Compartment --- to group the widget's cost data. The GroupBy is set per widget and does not affect other widgets on the dashboard.
The chart updates to display cost per dimension value. Each bar represents a distinct value within the selected dimension.
Step 2: Click a Bar to View Cost Details
Click on any bar in the OCI Cost Trend chart to display the cost details for that data point. The view isolates the selected value and shows a detailed cost breakdown for the corresponding period or dimension.
Step 3: View Cost Trend Drilldown Data
The drilldown view displays cost data for the selected bar. Review the breakdown to understand what is driving spend for the selected period or dimension.
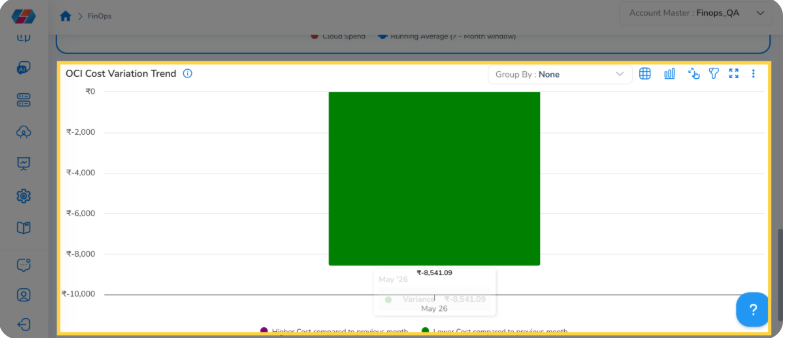
OCI Cost Variation Trend Widget
The OCI Cost Variation Trend widget shows the cost difference compared to the previous period. When granularity is set to Monthly, each record reflects the cost change from the prior month --- making it easy to spot spend increases and decreases rapidly. Use Group By to segment variation data by service, region, or compartment.
Step 1: Apply GroupBy to the Widget
Click Group By: None on the OCI Cost Variation Trend widget to open the GroupBy selector. Select a dimension to group cost variation data. As with the OCI Cost Trend widget, the GroupBy is set per widget only.
Step 2: Click a Bar to View Variation Details
Click on any bar in the OCI Cost Variation Trend chart to display cost variation details for that data point. The view shows the spend increase or decrease for the selected period or dimension.
Step 3: Access the Drilldown View
Click OCI Cost Variation Trend Drilldown to open the full variation view. Select Cost Variation by Tenant or another available dimension to break down the spend change by your preferred grouping. You can switch between dimensions without returning to the parent view.
Widget-Level Actions
The following actions are available on all widgets on the OCI Cost Explorer Dashboard. Access each action using the controls in the widget body or widget header.
Table View
Click the Table View icon on the widget to display cost data in a tabular format. The table lists each dimension value as a row with its cost and period, making it easier to compare exact figures across the selected period.
Chart View
Click the Chart View icon to return to the graphical representation of the cost data. Use chart view to visualize trends and compare costs across dimensions at a glance.
Select a Data Point
Click on a specific bar or data point in the chart to isolate cost data for that value. This narrows the widget view to the selected item and opens the detailed breakdown for closer analysis.
Add a Widget Filter
Click the Filter icon on the widget to open the widget-level filter panel. Widget-level filters apply only to that widget and do not affect other widgets on the dashboard. Select a filter type, enter the value, and click Add to apply.
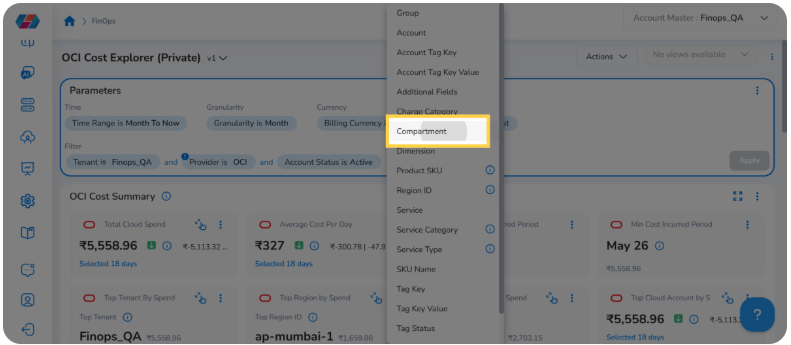
Note: A Compartment filter is available in the filter panel when an OCI account is active. OCI organizes resources in a hierarchy (Root > Parent > Child) — selecting a parent compartment automatically includes all child compartments in the filter scope. To apply it, click Add in the filter panel, select Compartment, choose from the hierarchy picker, and click Ok. All widgets reload to display data scoped to the selected compartment(s). When GroupBy: Compartment is also applied on a widget, hovering on any bar shows the full compartment path and cost value in the tooltip, and clicking a bar opens a drilldown with dimensions including Top Resources, Service Name, Resource Category, Charge Category, Product Family, and Pricing Category. No additional roles or permissions are required.
Expand Widget
Click Expand in the widget header to open the widget in full-screen view. This provides a larger canvas for analysing cost data without the constraints of the dashboard grid. Click Collapse or press Esc to return to the dashboard.
Further Actions (⋯ Ellipsis Menu)
Click the ⋯ ellipsis in the widget header to open the widget actions menu. The following options are available:
- Configure Widget: Edit the widget's settings and display options
- Subscribe: Set up a scheduled email subscription for this widget's cost data (see Subscribe to a Widget)
- Download CSV: Export the widget's cost data as a CSV file
- Download PNG: Export the current widget chart as a PNG image
- Swap Axis: Switch the X and Y axes in the chart
- Accumulated Spend: Toggle accumulated spend view to show running totals
- Other actions: Export Config, Copy, Cut, Limit Data, and View As are also available from this menu
Subscribe to a Widget
Click Subscribe from the ⋯ ellipsis menu on any widget to set up a scheduled subscription for that widget's cost data.
- In the subscription form, enter the Subscription Name, Email Address, and Recurrence frequency.
- Click Create to save the subscription. You will receive scheduled updates for the widget's cost data at the configured frequency.
Frequently Asked Questions
Can I apply GroupBy to all widgets at once?
No. GroupBy must be set on each widget individually. Changing the GroupBy on one widget does not affect others on the dashboard. This allows different widgets to display different dimensions simultaneously --- for example, GroupBy: Service on the Cost Trend widget and GroupBy: Region on the Cost Variation Trend widget.
What is the difference between a dashboard-level filter and a widget-level filter?
A dashboard-level filter (added via the top filter panel) applies to all widgets simultaneously. A widget-level filter (added via the Filter icon on a widget) applies only to that widget. Widget filters take precedence over the dashboard filter for that widget.
The Compartment filter is not visible in the filter panel --- what should I do?
The Compartment filter is only visible when an OCI cloud account is selected. If a Provider filter is active in the dashboard, ensure OCI is selected. The Compartment filter is hidden for AWS, Azure, and GCP accounts.
How do I enable forecasting on the OCI Cost Trend widget?
Select a To Now preset in the global time range (for example, Month to Now or Quarter to Now). Forecasting is disabled for fixed date ranges. Once enabled, forecasting appears on the OCI Cost Trend widget for up to 12 months or 14 days depending on the selected granularity.
Does selecting a parent compartment include child compartments?
Yes. The Compartment hierarchy picker reflects your full OCI tenancy tree. Selecting a parent compartment automatically includes all child compartments beneath it. You do not need to select each child compartment individually.
Can I export compartment-level cost data?
Yes. Click ⋯ on any widget with GroupBy: Compartment applied and select Download CSV to export the data. For scheduled exports, use the Subscribe option to receive regular email updates.
Troubleshooting
The OCI Cost Trend widget shows no data after applying GroupBy: Compartment
Cause: Compartment metadata may not have been ingested with the billing data, or the selected compartment has no spend in the chosen time range.
Solution:
- Verify the time range covers a period with known OCI spend.
- Confirm the compartment filter is set to a compartment that contains resources --- use the hierarchy picker to verify the path.
- Expand the time range (e.g., Month to Now) to check whether data exists outside the current range.
- If data is still missing, contact CoreStack Support with your tenant ID, OCI account name, compartment path, and the selected time range.
The Compartment filter is not visible in the filter panel
Cause: The Compartment filter only appears when an OCI account is active. It is hidden for AWS, Azure, and GCP accounts.
Solution:
- Confirm the active cloud account is OCI.
- If a Provider dashboard filter is active, verify that OCI is selected.
- If the issue persists, contact CoreStack Support with your tenant ID, OCI account name, and a screenshot of the filter panel.
Widget shows stale data after changing GroupBy or applying a filter
Cause: The widget may not have refreshed after the change, or the browser has cached the previous state.
Solution:
- Reload the OCI Cost Explorer Dashboard page.
- Confirm the GroupBy selector displays the correct dimension and the filter panel shows the expected active filters.
- Clear the browser cache if the issue persists across reloads.
Updated 2 months ago