

Multi-Cloud Kubernetes Cost Dashboard
This guide will take you through the various widgets for Kubernetes (K8s) Cost Dashboard in CoreStack.
Feature Overview
The Multi-Cloud Kubernetes Cost Dashboard is a set of cost visibility dashboards within CoreStack’s FinOps module that consolidate AWS EKS and Azure AKS cost data into a single view. It is applicable when your organization runs Kubernetes workloads on AWS, Azure, or both and needs namespace, pod, or deployment-level cost visibility for financial reporting and optimization.
This feature is most valuable to FinOps practitioners, cloud engineers, Finance teams, and Leadership who need to monitor K8s spend, perform chargeback/showback reporting, or identify costly workloads for rightsizing.
Two persona-driven dashboards are available: the Full Dashboard for practitioners and engineers who need deep drill-down, and the Simplified Dashboard for Finance, Product, and Leadership who need KPIs without Kubernetes complexity.
Note: Kubernetes cost data is generated from the CoreStack agent deployed in your clusters. If no agent is installed, the dashboards display an empty state with onboarding guidance.
How It Works
When the CoreStack agent collects cost and resource metadata from your EKS and AKS clusters, the data flows into the FinOps data layer and populates the K8s cost widgets. Users select one of two dashboards — Full or Simplified — and apply global filters to scope the data by cloud provider, cluster, namespace, pod, or other Kubernetes constructs. All widgets on the dashboard respond to filter changes simultaneously, and users can drill down from summary-level charts into resource-level cost breakdowns. Cost data refreshes daily, with up to a 24-hour lag for Azure AKS data sourced from the Azure Cost Management API.
Prerequisites
Before you begin, ensure the following:
-
Role: You have the FinOps Practitioner, FinOps Admin, or FinOps Reader role assigned in CoreStack
-
Agent deployment: The CoreStack K8s agent is installed and reporting data from your EKS and/or AKS clusters
-
Cloud accounts onboarded: The AWS and/or Azure accounts hosting your K8s clusters are onboarded in CoreStack
-
Access: You can access FinOps > Dashboard in the CoreStack navigation
Navigate to K8s Dashboard
Perform the following steps to navigate to Kubernetes dashboard:
Step 1 - Navigate to FinOps
On the left navigation pane, click FinOps.
Step 2 - Select Dashboard in the Menu
Click Dashboard.
Step 3 - Select a Kubernetes Dashboard
In the drop-down list that appears on the top-left corner of the screen, select the dashboard you want to view.
Global Filters
The global filters appear on top of the K8s dashboard and it includes the following filtersTime, Granularity, Currency, Metrics, Provider, Account/Subscription, Cluster, Namespace, Node Pool, Node, Pod, Deployment, Service, and Label.
Change Value Options for Global Filter
Users cannot remove global filters, but they can change the existing value and select specific values as per need. For example, in the Metrics filter, click the drop-down list and select another option. The widgets will show updated details as per the selected values.
Add Custom Filter
Click ADD+ to add filters by cluster, namespace, node pool, pod, deployment, service, or label. Select values from the dropdown and click Ok. Active filter chips appear in the bar. Multiple filters combine with AND logic.
Remove or modify filters
Click the X on any active filter chip to remove it and widen the scope. To restore all widgets to their full unfiltered scope, clear all active filter chips. Global filters (Time, Granularity, Currency, Metrics) cannot be removed but their values can be changed.
Note: The Cloud Account filter has been renamed to Account, and the Cloud Provider filter has been renamed to Provider.
View K8s Widgets
The (K8s) Cost Dashboard shows the following Kubernetes widgets.
K8s Cost Trend Widget
View the K8s Cost Trend widget that shows the cost spend for a defined time period.

In the K8s Cost Trend widget, click the Group By drop-down list and select an option. The widget shows details as per the selected options. The Total K8s Spend widget on the right side of the K8s Cost Trend widget shows the total cloud spend for the selected days.
Hover the mouse pointer over the “I” symbol to view a summary of cloud spend.

View Drilldown Details
Click the “I” symbol to view drilldown details. The drilldown details appear on a new pop-up screen and you can click on a data point to drill down further. The details are displayed just right below the chart on which you had clicked a data-point.

K8s Cost Spend by Cluster Widget
View the K8s Cost Spend by Cluster widget. This widget shows the cost spend details for clusters during a defined time period.

In the Group By drop-down list, select an option to apply to the widget and the details in the widget will be displayed accordingly. View the Top Cluster widget that appears on the right side of the K8s Cost Spend by Cluster widget. This widget shows the total cloud spend and the highest cost spend by a cluster.
Note: Hover the mouse pointer over the “I” symbol to view a summary of cloud spend and click the “I” symbol to view drilldown details.
K8s Cost Spend by Department Widget
View the K8s Cost Spend by Department widget. This widget shows the cost spend for a time-period as per the department.

In the K8s Cost Spend by Department widget, in the Group By drop-down list, click to select an option. The widget will show details as per the selected option. The Top Department widget that appears on the right side of the K8s Cost Spend by Department widget shows the department having highest cost spend along with the total cost spend of the department.
Note: Hover the mouse pointer over the “I” symbol to view a summary of cloud spend and click the “I” symbol to view drilldown details.
K8s Cost Spend by Pod Widget
View K8s Cost Spend by Pod widget. This widget shows the cost spend by pods over a time period.

In the Group By drop-down list, click to select an option that will be applied to the widget and details will be displayed accordingly. View the Top Pod widget on the right side of the K8s Cost Spend by Pod widget. This widget shows the total cloud spend over a time period, along with the top cost spend by a pod.
Note: Hover the mouse pointer over the “I” symbol to view a summary of cloud spend and click the “I” symbol to view drilldown details.
K8s Cost Spend by Namespace Widget
View the details in the K8s Cost Spend by Namespace widget. This widget shows the cost spend details over a time period as per namespace.

In the K8s Cost Spend by Namespace widget, in the Group By drop-down list, click to select an option. The widget will show details as per the selected options. View the Top Namespace widget on the right side of the K8s Cost Spend by Namespace widget. This widget shows the total cloud spend for the selected days, along with the top cost spend by the namespace.
Note: Hover the mouse pointer over the “I” symbol to view a summary of cloud spend and click the “I” symbol to view drilldown details.
K8s Cost Spend by Workload Type Widget
View the K8s Cost Spend by Workload Type widget. This widget shows the cost spend for different workload types over a time period.

In the Group By drop-down list, click to select an option as per which you would like to view the details in the widget. The widget will show details as per the selected options. View the Top Workload Type widget on the right side of the K8s Cost Spend by Workload Type widget. This widget shows the total cloud spend and the cost spend for the top workload type.
Note: Hover the mouse pointer over the “I” symbol to view a summary of cloud spend and click the “I” symbol to view drilldown details.
K8s Cost Spend by Utilization Type Widget
View the K8s Cost Spend by Utilization Type widget. This widget shows the cost utilization for a time period.

In the Group By drop-down list, click to select an option as per which details will be displayed in the widget. The Top Utilization Type widget appears on the right side of the K8s Cost Spend by Utilization Type widget. This widget shows the total cloud spend and the cost spend by top utilization type.
Note: Hover the mouse pointer over the “I” symbol to view a summary of cloud spend and click the “I” symbol to view drilldown details.
K8s Cost Spend by Resource Type Widget
View the K8s Cost Spend by Resource Type widget. This widget shows the cost spend over a time period as per different resource types.

In the Group By drop-down list, click to select an option as per which details will be displayed in the widget. The Top Resource Type widget appears on the right side of the K8s Cost Spend by Resource Type widget. This widget shows the total cloud spend and the cost spend by top resource type.
Note: Hover the mouse pointer over the “I” symbol to view a summary of cloud spend and click the “I” symbol to view drilldown details.
K8s Cost Summary Widget
The Cost Summary widget appears at the top of both the Full and Simplified dashboards. It shows the total K8s cost for the current period alongside the prior period cost, variance amount, variance percentage, and a directional trend indicator.
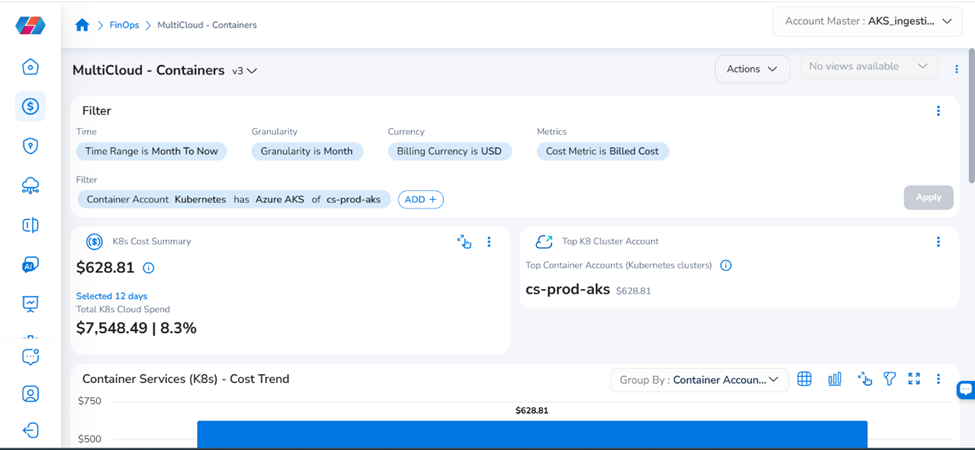
In the Metrics drop-down list, select Billed, Amortized, or Effective to recalculate the summary. Hover over the total cost value to view the EKS vs. AKS cost breakdown in a tooltip.
Note: If no prior period data exists, the widget shows “N/A” for prior period and variance fields. When total cost exceeds $1M, values are abbreviated (e.g., “$1.2M”).
K8s Cost Spend by Dimension Widget
The Cost Spend by Dimension widget provides a unified cost breakdown by a selected dimension. It consolidates the individual cluster, namespace, pod, and other cost spend widgets into a single view. This widget is available on both the Full and Simplified dashboards.
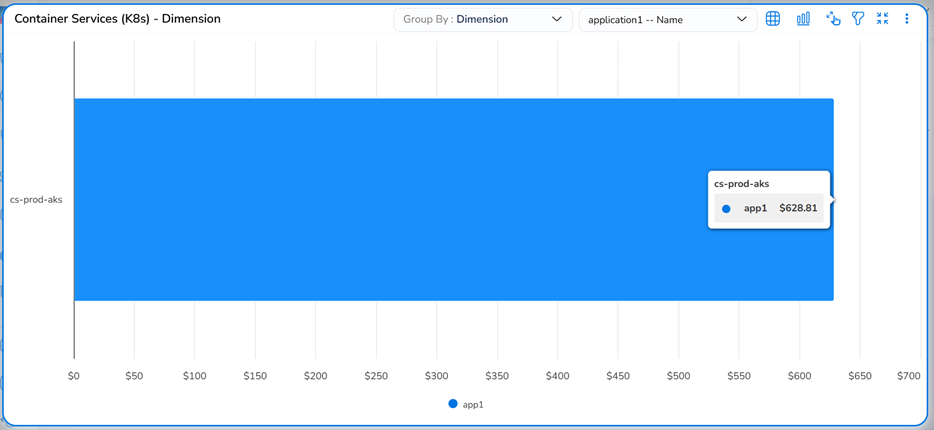
In the dimension selector drop-down, choose an option: Cluster, Namespace, Node Pool, Deployment, Service, or Label. The widget recalculates and renders the cost allocation chart for the selected dimension. The default dimension is Namespace.
Note: Hover over the "I" symbol to view a cloud spend summary. Click the "I" symbol to view drilldown details. If AKS pods have no labels applied, the Label dimension displays “No label data available.”
Additional Actions on Widgets
All K8s widgets support the following common actions through the toolbar icons and ellipsis menu
Table View and Chart View
Click the Table View icon to view the widget in tabular format. Click the Chart View icon to return to graphical format
View Drilldown Details
Click a data point in any widget to view drilldown details. The drilldown screen opens and shows the cost breakdown. Click additional data points to drill down further — details appear below each other on the pop-up screen.
In the drilldown screen, click the Group By drop-down list to change the chart grouping. Click the maximize icon to enlarge the chart. Click it again to return to normal view.
Widget Filters
Click the Filter icon on any widget to view pre-defined and custom filters. Use ADD+ to add custom filters. Global filters cannot be removed from individual widgets, but their values can be changed. Custom filters can be added and removed.
Menu Actions
Click the ellipsis on any widget to access the following actions:
| Action | Description |
|---|---|
| Swap Axis | Interchange details on the vertical and horizontal axis. |
| View As | Change the widget to a different chart type. |
| Limit Data | Control how many data points display: All Data, Top 5, Top 5 plus others, Top 10, Top 10 plus others, Bottom 5, Bottom 5 plus others. |
| Configure Widget | Modify widget configuration. Navigate to the step to change, then click Finish. |
| Subscribe | Manage widget subscription and notification settings. |
| Export Config | Download the widget configuration details. |
| Download as CSV | Download widget data in CSV format. |
| Download as PNG | Download the widget as a PNG image. |
| Cut | Cut the widget for repositioning. |
| Copy | Copy the widget to another dashboard location. |
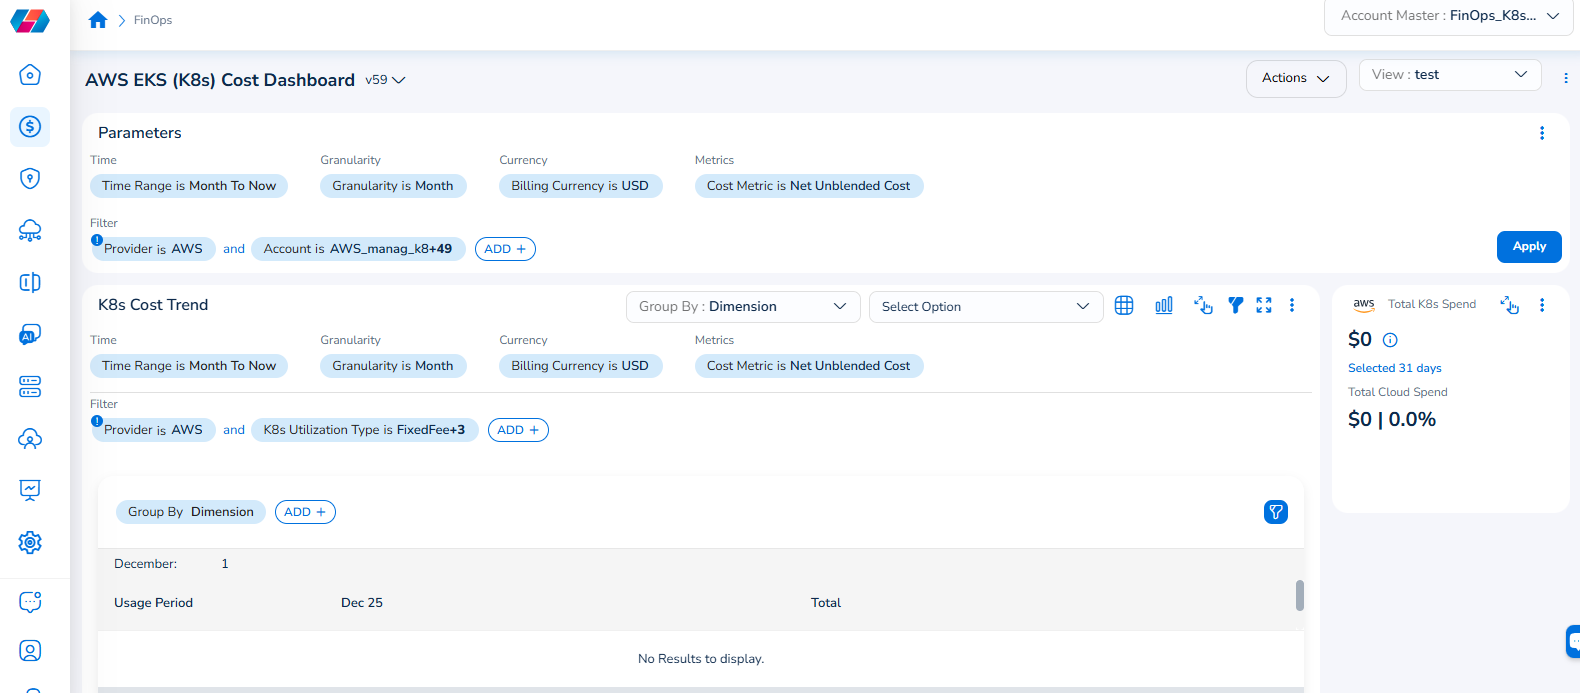
Note that the Cloud Account filter has been renamed to Account, and the Cloud Provider filter has been renamed to Provider.
For example, if you see the dashboard shown in the screenshot below, the Parameters > Filter section shows the Provider filter for which the value selected is AWS.
To add the Account filter, users can click ADD+ and select Account. In the drop-down list that appears, users can select all applicable values, and click Ok. Details will be displayed in widgets as per the selected filter(s).
In every widget that is available within a dashboard, users can click the Filter icon that appears on the top-right side of the widget and view the pre-defined filters. The Provider filter appears as a pre-defined filter. Users can use the ADD+ option to add custom filters and they have the option to add the Account filter from here.
Frequently Asked Questions
Can I see AWS EKS and Azure AKS costs side by side?
Yes. Set the Provider filter to All (the default). All widgets display aggregated multi-cloud K8s cost. Hover over the Cost Summary widget’s total to see the per-cloud breakdown (EKS vs. AKS) in a tooltip.
Q: What cost metrics are available, and which should I use?
Three metrics are available: Billed (on-demand list price), Amortized (spreads upfront reservation costs over the term), and Effective (net cost after all discounts). Finance teams typically use Amortized for chargeback. Engineering teams often use Billed for real-time spend tracking.
Q: Why is my AKS namespace cost data missing or incomplete?
Azure Cost Management does not natively provide namespace-level cost breakdown. CoreStack computes namespace cost by distributing node costs based on pod resource requests and limits. If pods lack resource requests, namespace cost allocation may be inaccurate. Ensure all AKS pods have resource requests defined.
Q: What happens when cluster names are the same across cloud providers?
CoreStack prefixes cluster names with the provider to prevent collisions. For example, clusters display as “AKS: prod-cluster” and “EKS: prod-cluster” in filters and widgets.
Q: How do I export data for monthly chargeback?
Open the Cost Spend by Dimension widget, select Namespace (or your preferred dimension), switch to Table View, and click the ellipsis menu > Download as CSV. The export includes Dimension Name, Current Cost, % of Total, Prior Cost, and Change %.
Troubleshooting
No data appears on the K8s dashboard
Cause: The CoreStack K8s agent is not installed on your clusters, or the agent has not completed its first data sync.
Solution:
- Confirm the CoreStack K8s agent is deployed on your EKS and/or AKS clusters.
- Verify the agent is running by checking the agent status in CoreStack.
- For newly onboarded AKS clusters, allow up to 24 hours for cost data to appear due to Azure Cost Management API lag.
- If the issue persists, contact CoreStack support with your tenant ID, cluster name(s), cloud provider, and agent deployment date.
AKS cost data shows but namespace breakdown is missing
Cause: Azure Cost Management does not provide native namespace-level cost data. CoreStack computes namespace cost using pod resource requests and limits. If pods lack resource requests, namespace allocation cannot be calculated.
Solution:
- Verify that your AKS pods have CPU and memory resource requests defined in their deployment manifests.
- After updating resource requests, allow 24–48 hours for updated cost allocation to appear.
- Check the Cost Spend by Dimension widget with dimension set to Cluster — if cluster-level data appears but namespace does not, this confirms the resource requests issue.
- If the issue persists, contact CoreStack support with your tenant ID, affected cluster name, and a sample pod manifest showing the resource requests configuration.
Filter changes do not update all widgets
Cause: Dashboard widgets should respond to global filter changes within 3 seconds. Delays typically indicate a large dataset or network latency.
Solution:
- Wait 5–10 seconds for all widgets to finish loading.
- Refresh the browser page and reapply filters.
- Narrow the date range in the Time filter to reduce the dataset size.
- If widgets consistently fail to update, contact CoreStack support with browser console error screenshots, your tenant ID, and the filters applied.
Updated about 1 month ago