

Infrastructure Resources: By Resource Category
This user guide provides users with step-by-step instructions to monitor, filter, and analyze resource changes in CoreStack's Infrastructure Dashboard.
Feature Overview
The Resource Changes Over Time view is a multi-view dashboard within CoreStack's Graphion module that tracks how cloud resources have changed — added, modified, or deleted — across categories such as Compute, Databases, Network, Storage, Identity, and more. This view is most useful for identifying configuration drift, investigating unexpected resource additions or deletions, and correlating infrastructure changes with security findings over a 30-day window.
This view is most valuable to DevOps Engineers investigating configuration changes and Security Analysts who need to correlate resource-level changes with vulnerabilities or compliance gaps. It surfaces historical change data captured during scheduled scans and is not intended as a real-time drift detection tool.
From the resource details table, users can now drill into any individual resource to open the Resource Detail View — a full-page investigation page covering the resource's identity, configuration, change history, and security findings.
Note: The Infrastructure Resources: By Resource Category widget is visible only if your organization has the appropriate product bundle and you have been assigned the appropriate roles and permissions. If the widget does not appear on the Cloud Security Dashboard, contact your Tenant Admin to confirm bundle activation and role assignment.
How It Works
CoreStack scans onboarded cloud accounts on a scheduled basis and records the state of each resource at the time of each scan. The Resource Changes Over Time view compares resource states across scan timestamps and surfaces additions, modifications, deletions, and unchanged resources in a stacked bar chart grouped by resource category. From the category overview chart, users can navigate into a specific category to see how change types break down over time, then go further into a detailed table listing every individual resource that changed. The dashboard retains data upto 90 days.
Clicking any resource ID in the resource details table opens the Resource Detail View, organized into four tabs: Overview, Configuration, Resource Activity, and Security & Compliance. Change Events within the Resource Detail View are retained for a configurable window of up to 180 days.
Prerequisites
Before getting started, ensure the following:
- Roles and Permissions: You have the necessary roles and permissions assigned in assigned in CoreStack under the appropriate bundles.
- Cloud Accounts: At least one cloud account (AWS, Azure, GCP, or OCI) has been onboarded and scanned in CoreStack. Security issues appear only after at least one completed scan.
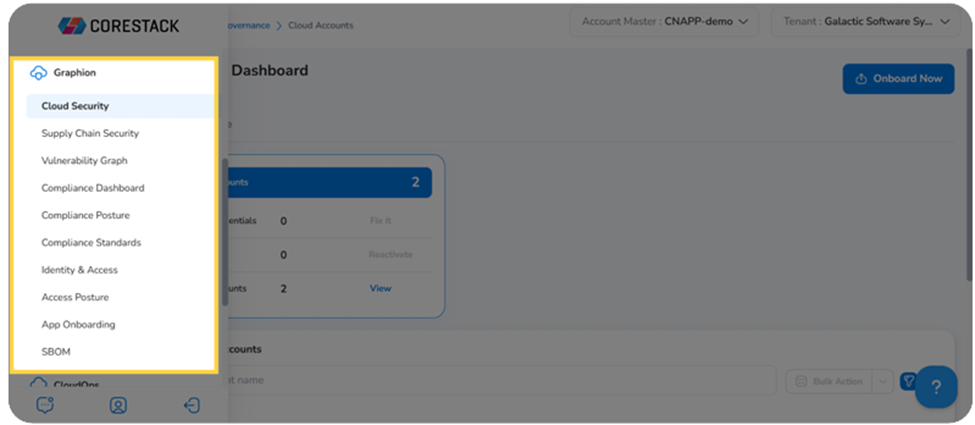
- Access: You can navigate to Graphion > Cloud Security > Cloud Security Dashboard using the CoreStack left navigation sidebar.
Using the Cloud Security Dashboard: Resource Changes Over Time
Step 1: Access the Cloud Security Dashboard
Navigate to Graphion> Dashboard > Cloud Security Dashboard using the left navigation sidebar.
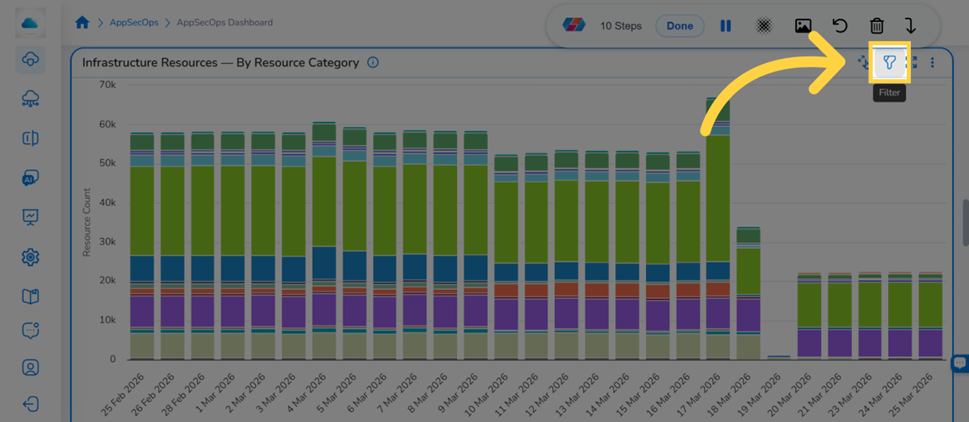
Once the Infrastructure Dashboard loads, scroll down to locate the Infrastructure Resources – By Resource Category widget. The stacked bar chart displays how infrastructure resource counts have changed over time, grouped by resource category. Each bar on the X-axis represents a scan date, and the Y-axis shows the resource count.
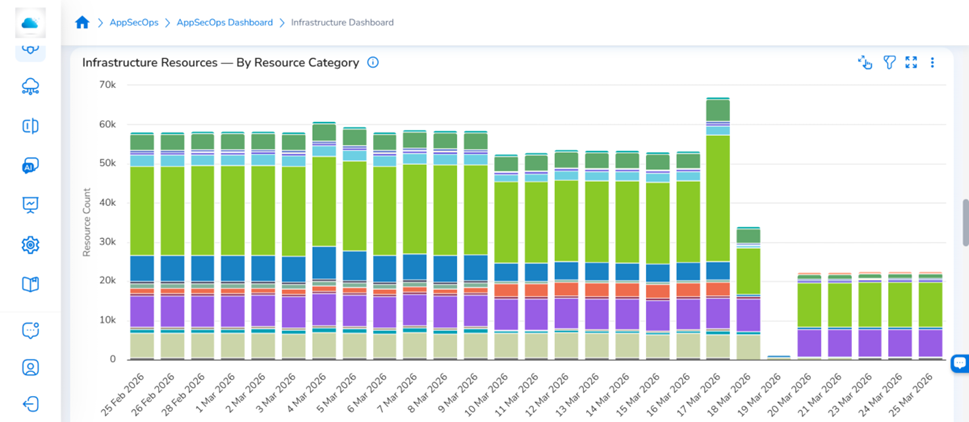
stacked bar chart grouped by resource category
Step 2: View Resource Totals by Category
Hover over any bar in the chart. A tooltip appears showing the scan date, the total resource count, and a breakdown by resource category (such as Analytics, Compute, Databases, Identity, Network, Storage, and more).
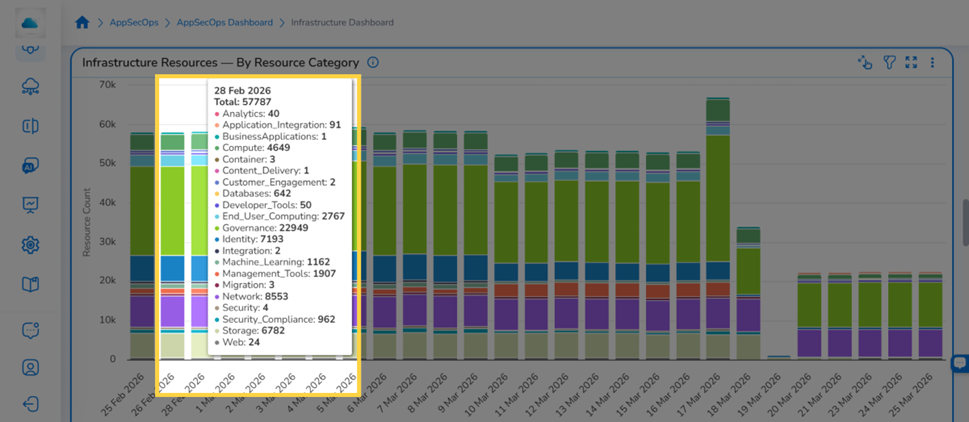
Hovering over a bar shows the total resource count and a per-category breakdown for that scan date
Step 3: Explore Resources Within a Category
Click on any bar in the chart. A menu appears listing all available resource categories. Select a category (for example, Compute) to open the resource change chart for that category.
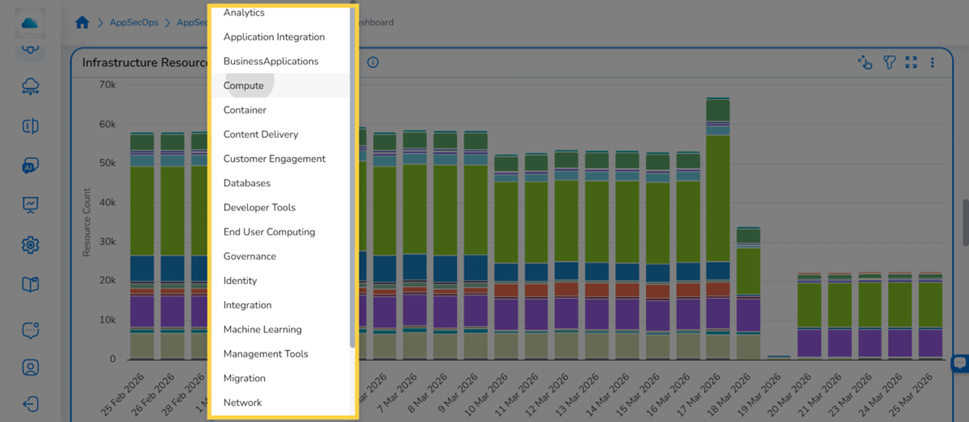
Clicking a bar opens a dropdown to select a resource category
After selecting a category, the view changes to a chart titled [Category] – Resource Changes By Change Type, showing how resources in that category changed over time, broken down by change type: New, Unchanged, Modified, and Deleted.
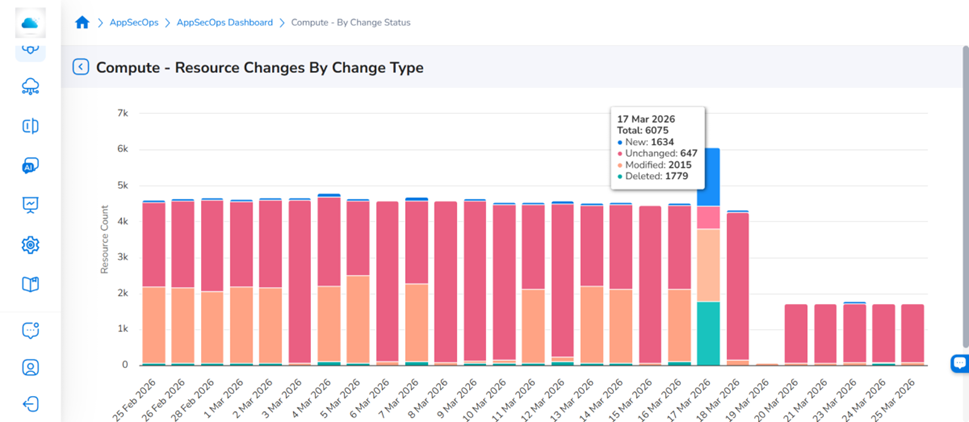
Change Type chart shows New, Unchanged, Modified, and Deleted resources for the selected category
Step 4: View the Change Type Breakdown
Hover over any bar in the change type chart to see the breakdown of resource changes for that scan date. The tooltip shows the total resource count and the count for each change type: New, Unchanged, Modified, and Deleted.
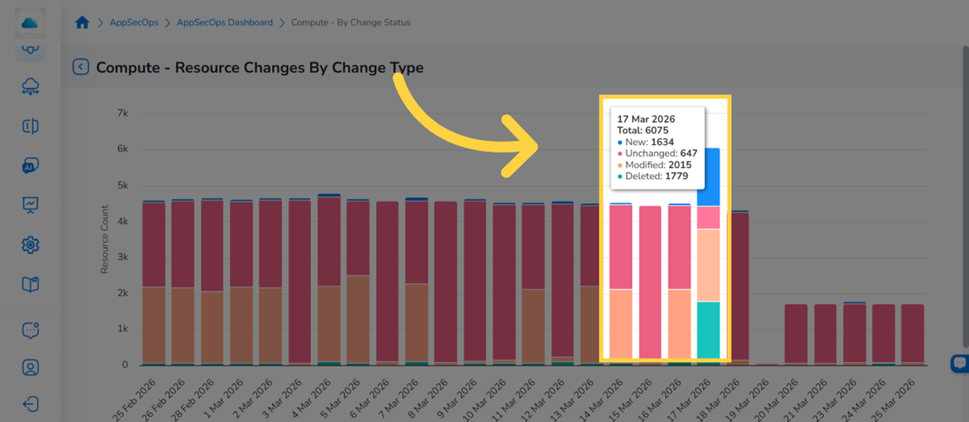
Hovering over a bar reveals the change type breakdown for that scan date
Step 5: Open the Resource Details Table
Click on a specific bar in the change type chart. A dropdown appears with the change types: New, Unchanged, Modified, and Deleted. Select a change type to open the resource details table for that combination of category, scan date, and change type.
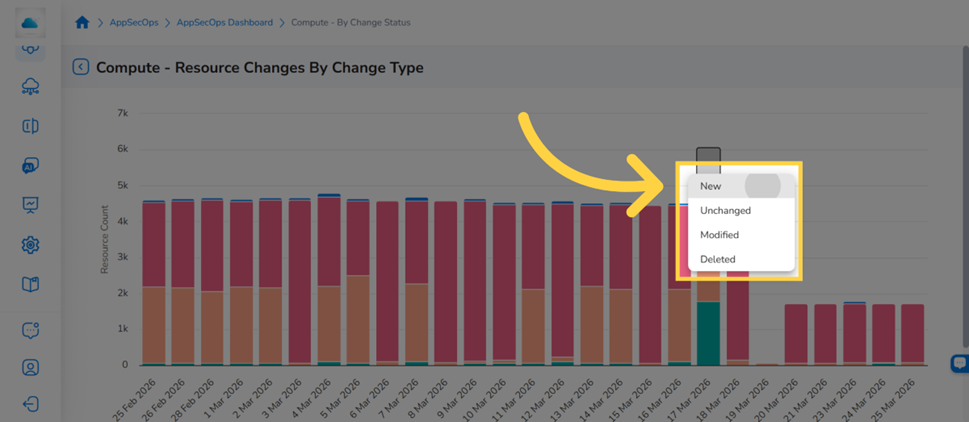
Clicking a bar opens a dropdown to select a change type
The resource details table lists every individual resource matching the selected criteria. For example, selecting New under Compute opens the Compute – Resources Added Over Time table. Users can search by Resource Category, Resource Type, Resource ID, or Resource Name using the search bar at the top of the table.
The table includes the following columns:
- Resource Category
- Resource Type
- Resource
- Resource ID
- Resource Name
- Cloud Account
- Cloud Provider
- Region
- Added at (or equivalent timestamp column based on the selected change type)
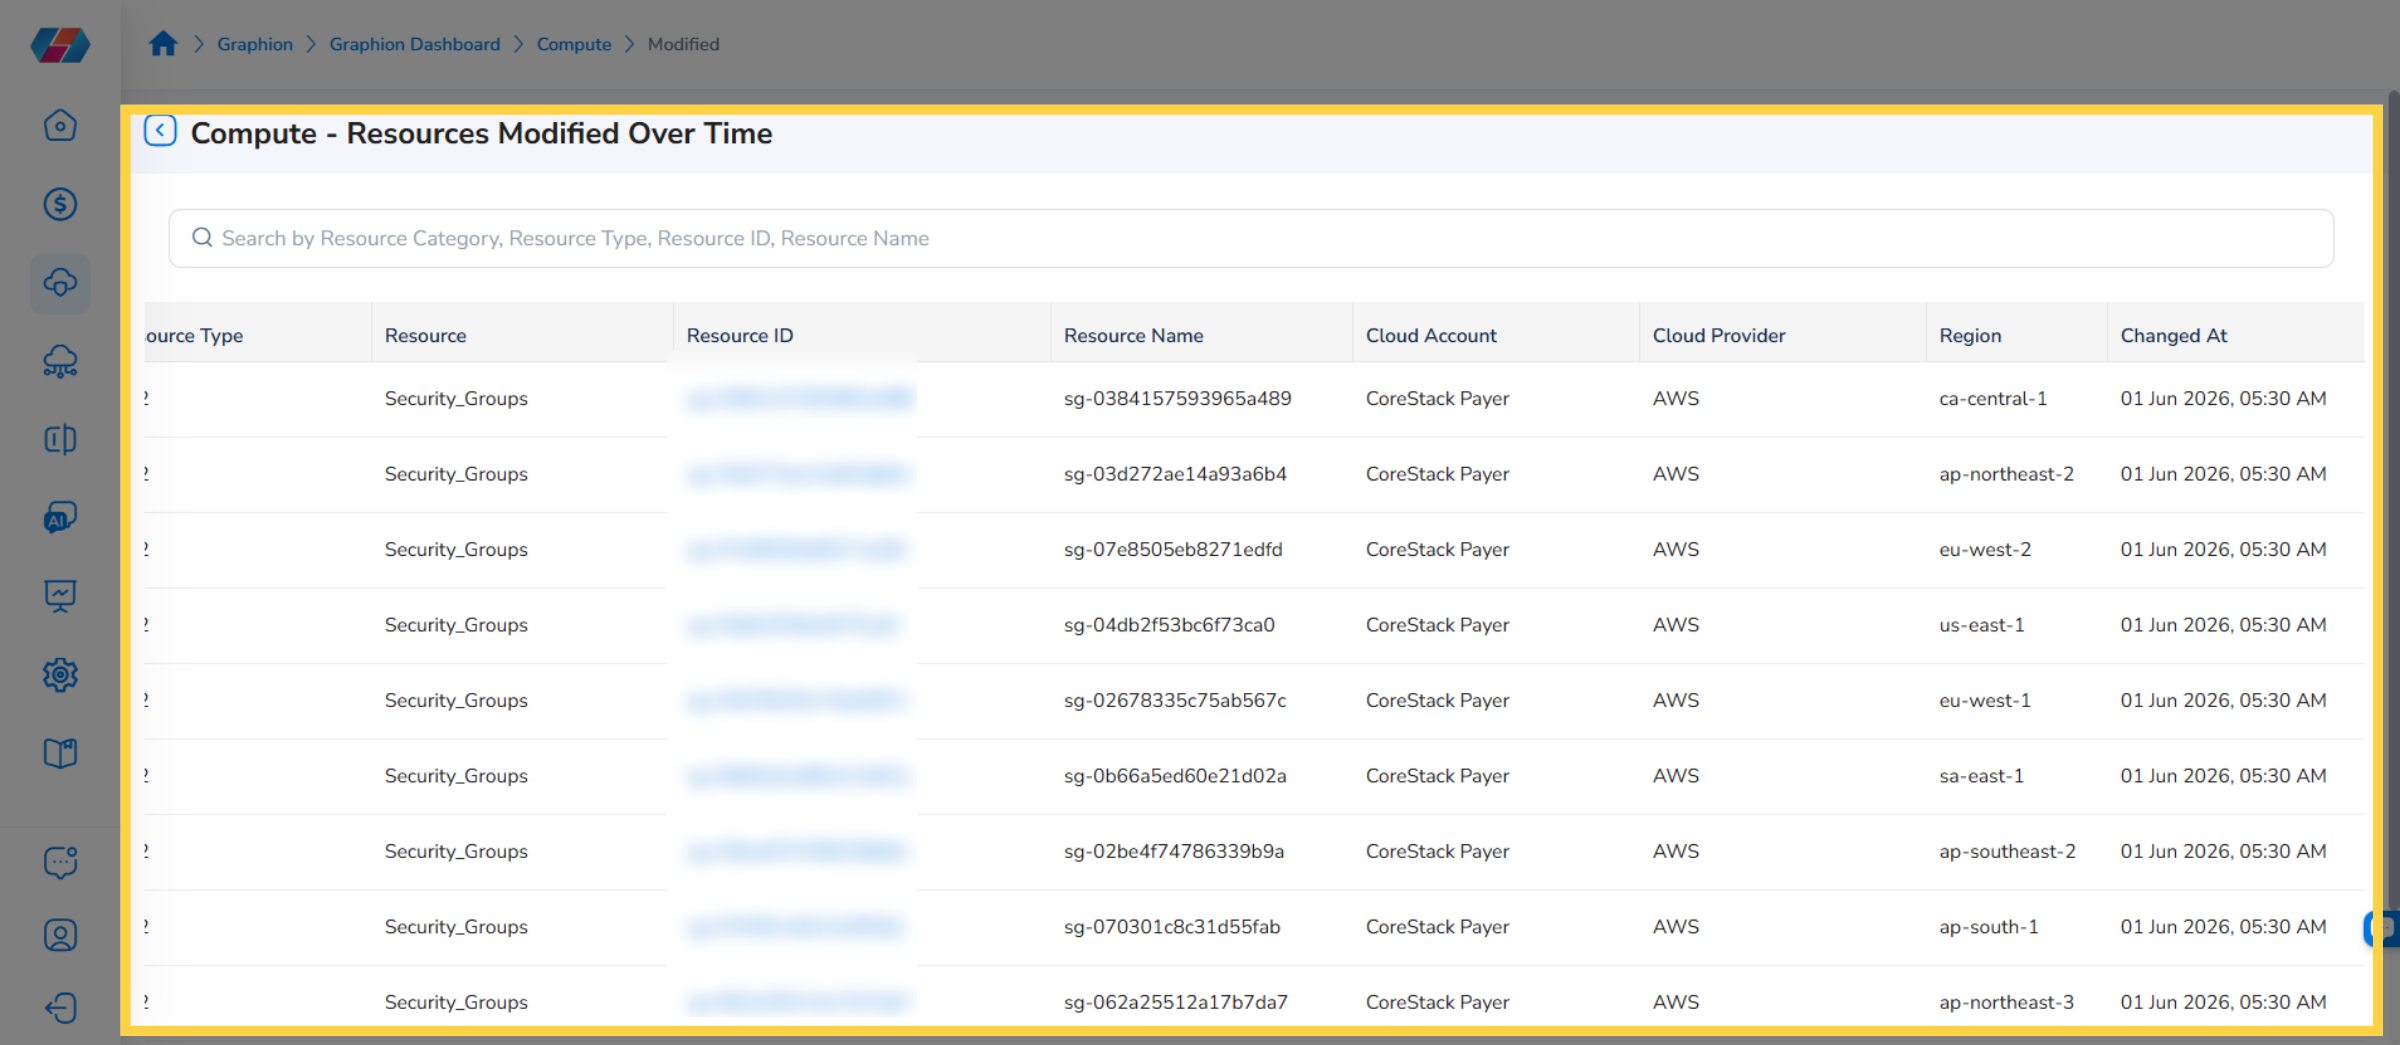
The resource details table lists all resources matching the selected category, change type, and scan date
Step 6: Open the Resource Detail View
Click the resource ID link in the Resource ID column of the resource details table. The Resource Detail View opens as a full page for that resource, organized into four tabs: Overview, Configuration, Resource Activity, and Security & Compliance.
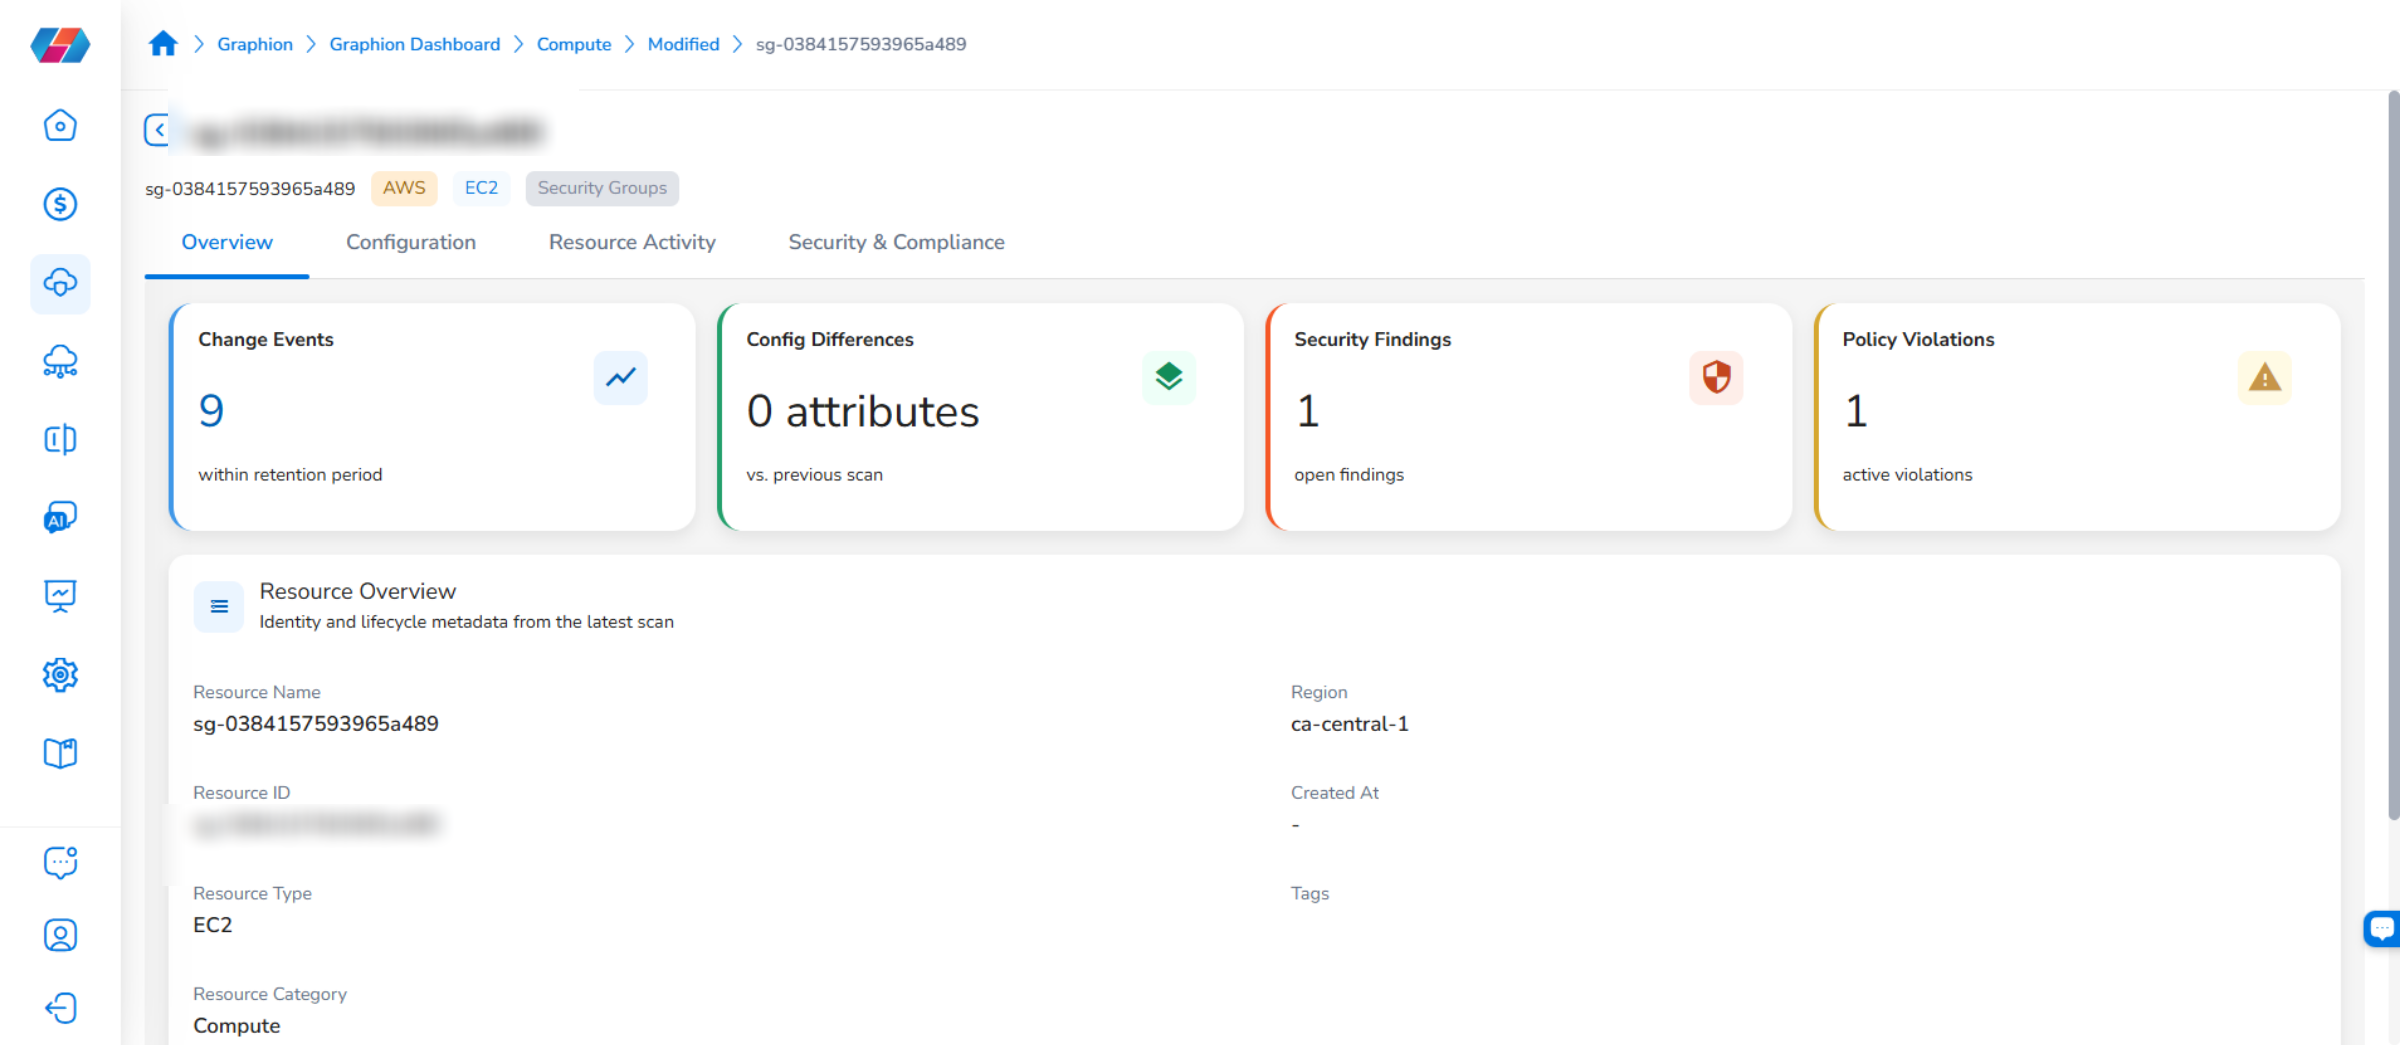
Resource Detail View page showing the four summary widgets and the four tabs
Step 7: Review the Resource Overview
The Overviewtab loads automatically, showing four summary widgets: Change Events, Config Differences, Security Findings, and Policy Violations. The Resource Overview section below displays the resource's identity fields — including Resource Name, Region, Resource ID, Resource Type, Resource Category, Cloud Account, Cloud Provider, and Tags — populated from the most recent scan.
Step 8: View the Configuration Detail
Click the Configuration tab. The Configuration Detail section displays the resource's current attributes from the most recent scan. Fields vary by resource type. Expand Raw Configuration to view the full JSON.
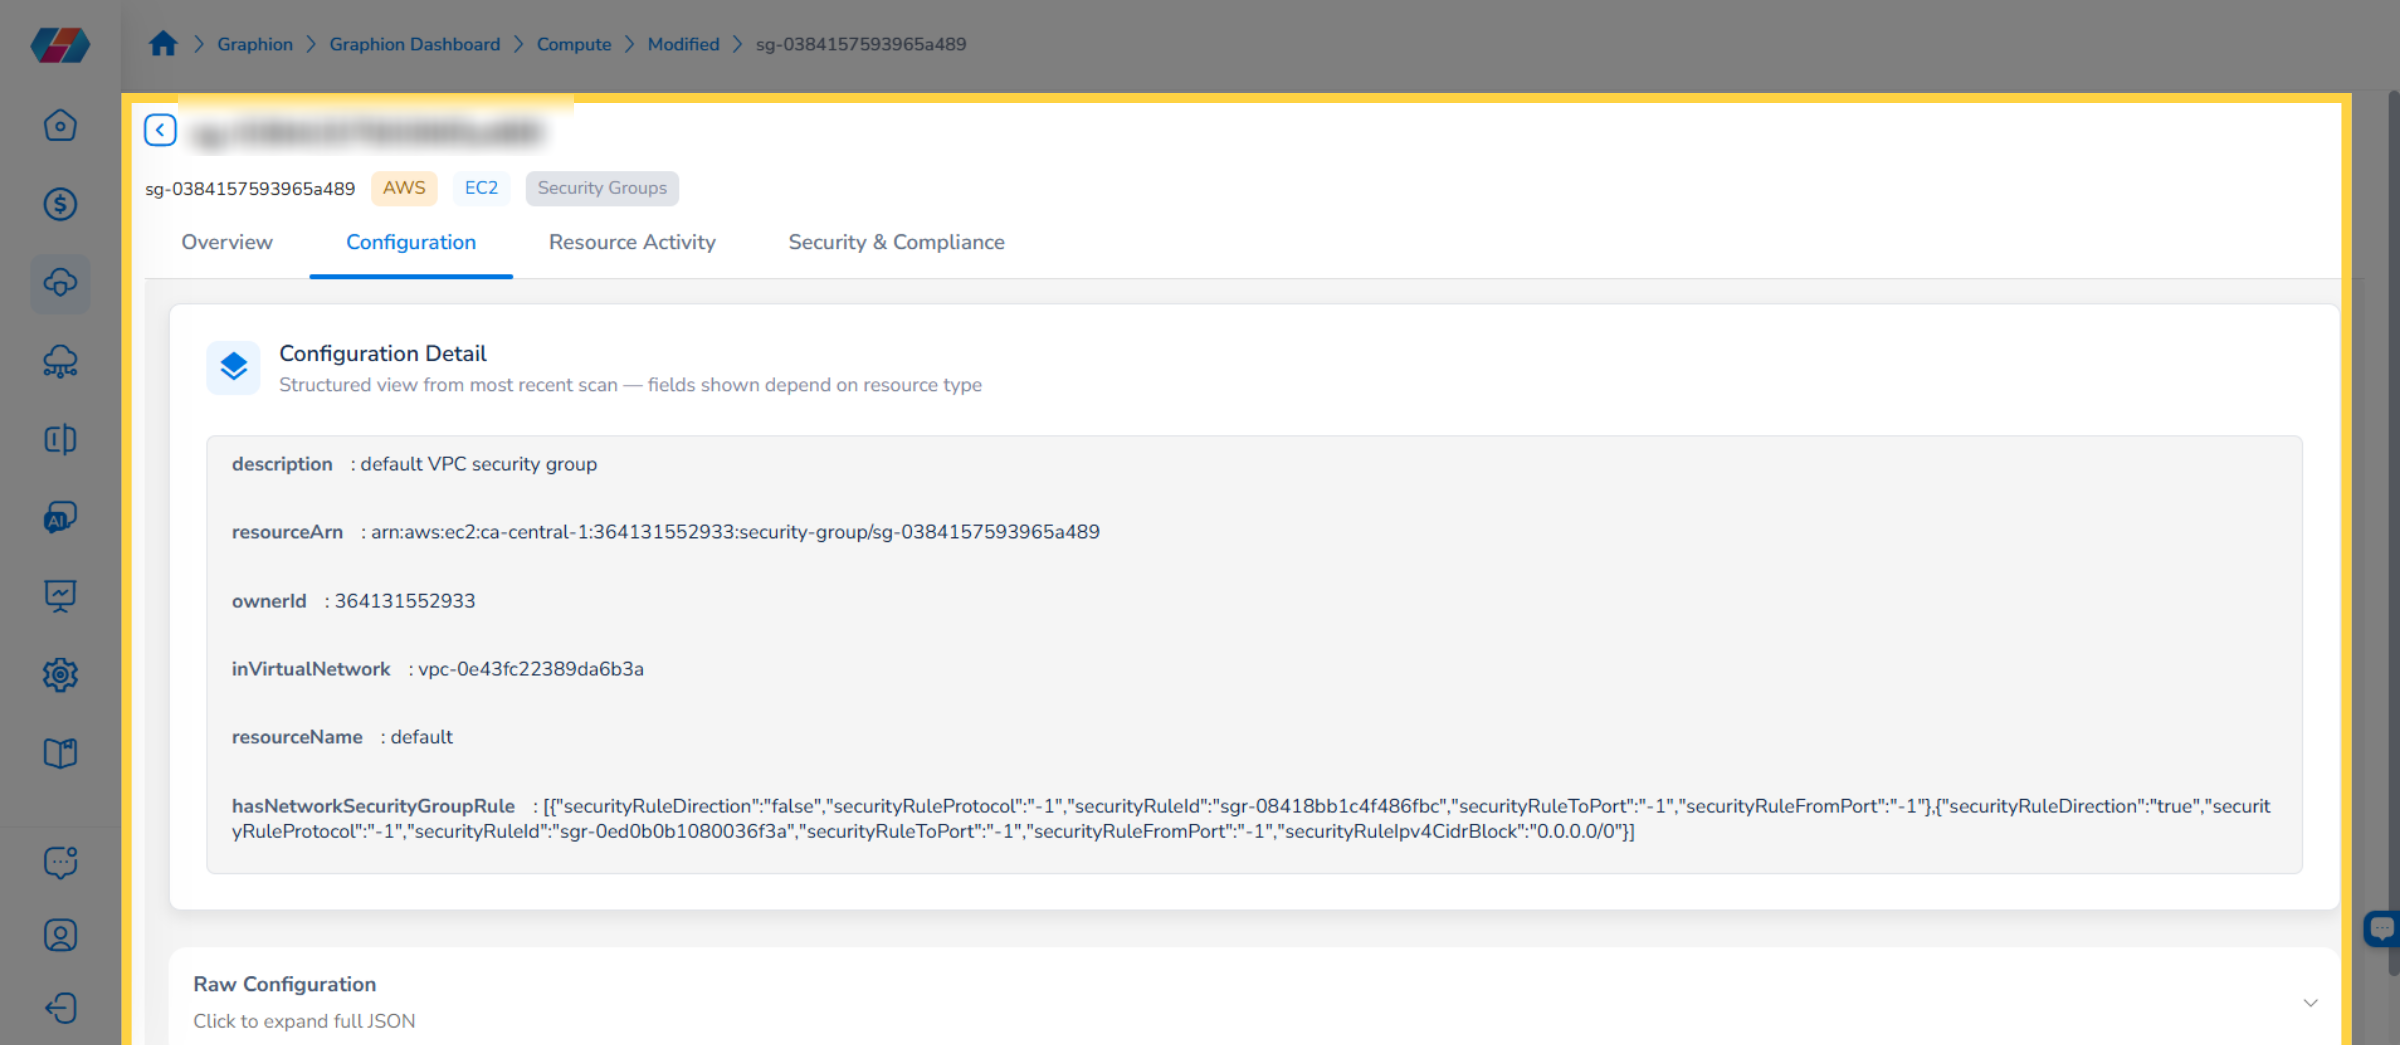
Configuration tab showing the Configuration Detail section and the collapsed Raw Configuration section
Step 9: Review Change Events
Click the Resource Activity tab. The Change Events section lists all state changes for this resource in chronological order, retained for a configurable window of up to 180 days. Each entry shows the timestamp and change type.
Use the filter buttons — All, Added, Unchanged, Modified, Deleted — to narrow the list. Click View Diff on any Modified event to see a before/after comparison of what attributes changed between scans.
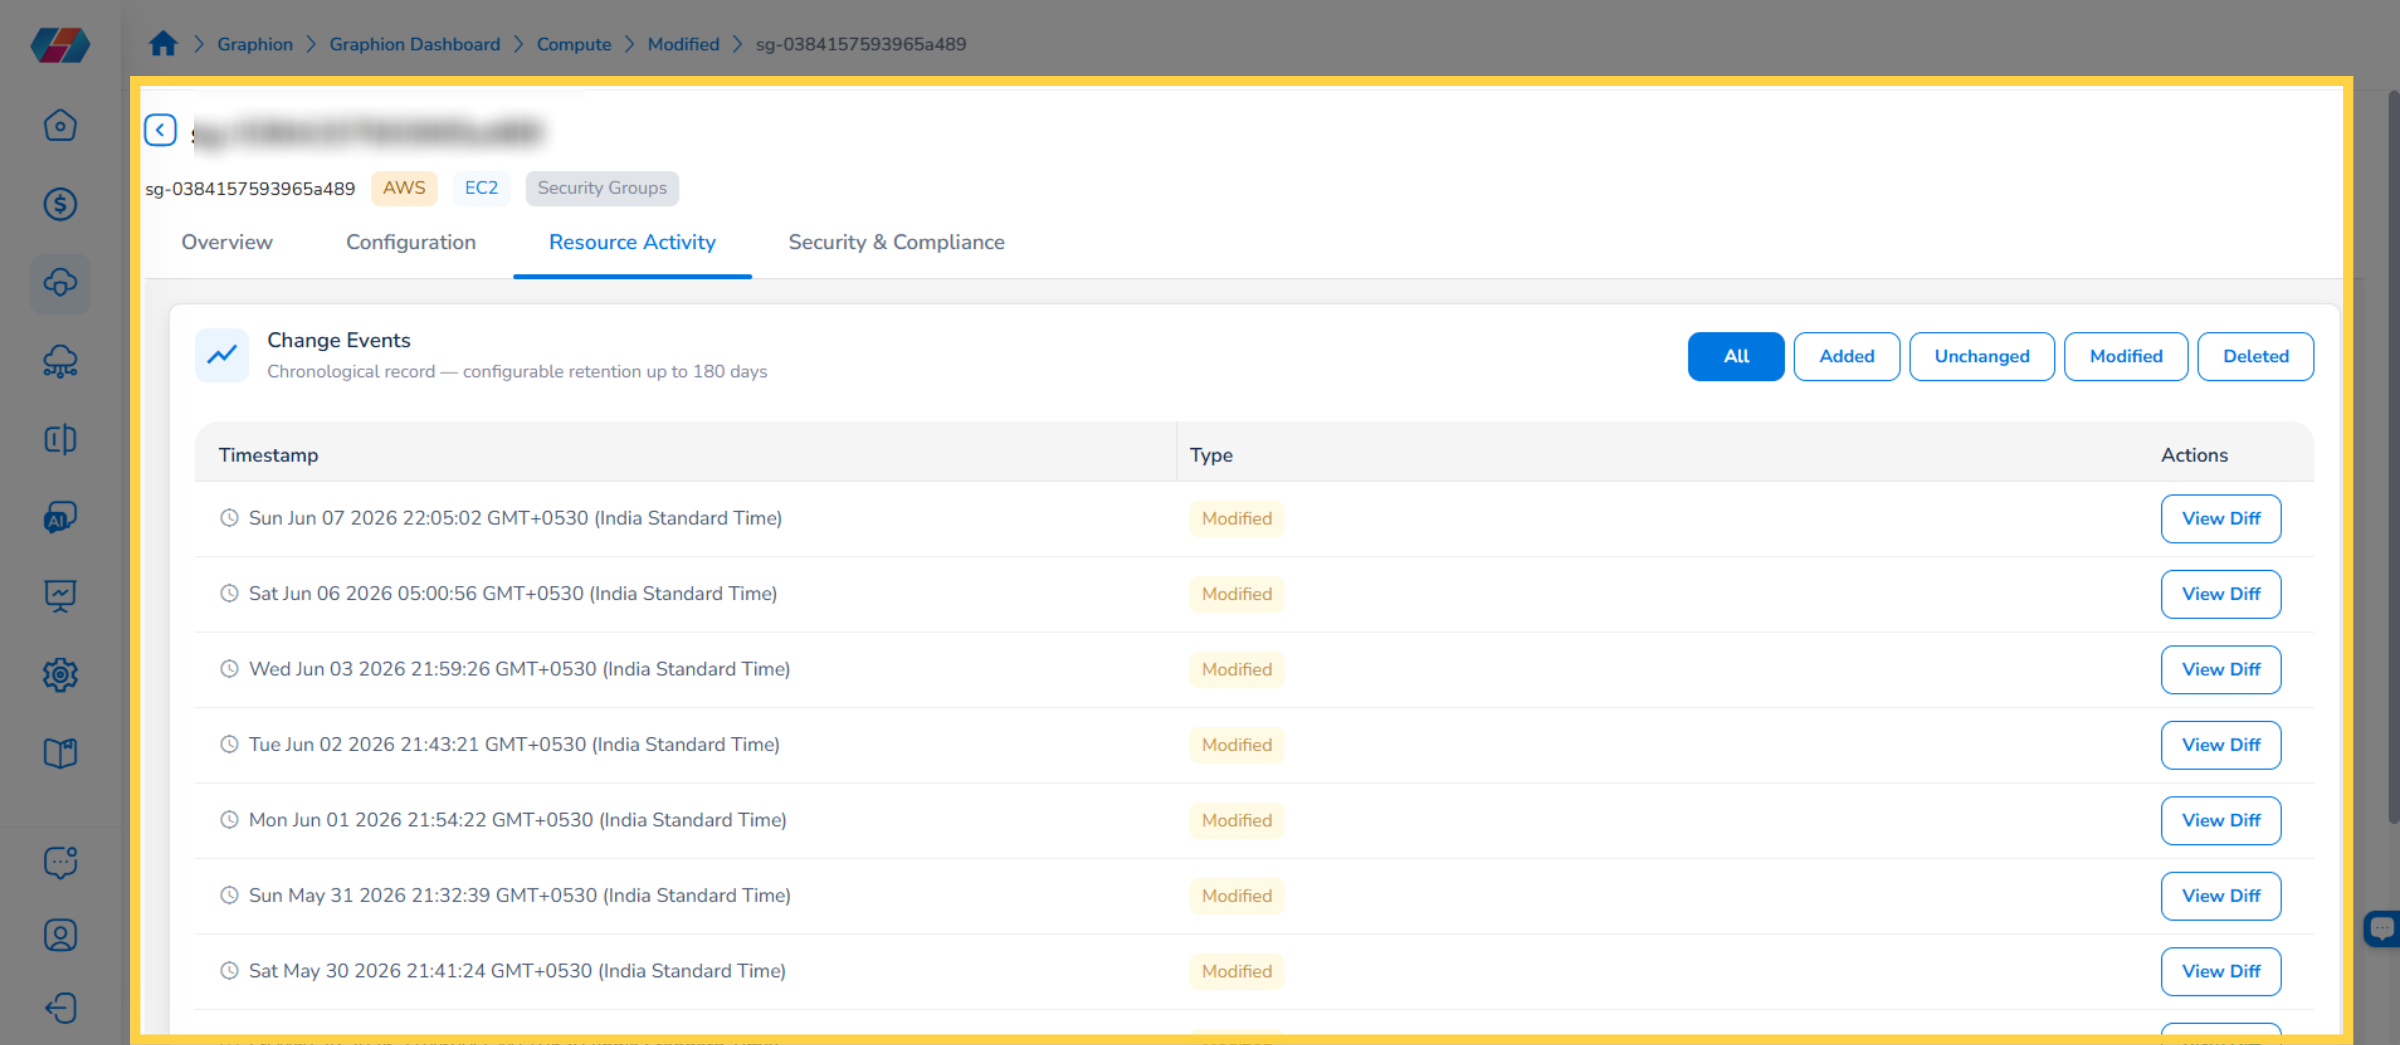
Resource Activity tab showing the Change Events section with filter buttons and View Diff option
Step 10: View Security and Compliance Context
Click the Security & Compliance tab to review all vulnerabilities, misconfigurations and threats associated with this resource, grouped by severity. Use the Open Vulnerability Explorer, Open Misconfiguration Explorer or Open Threats Explorer links to investigate findings in detail.
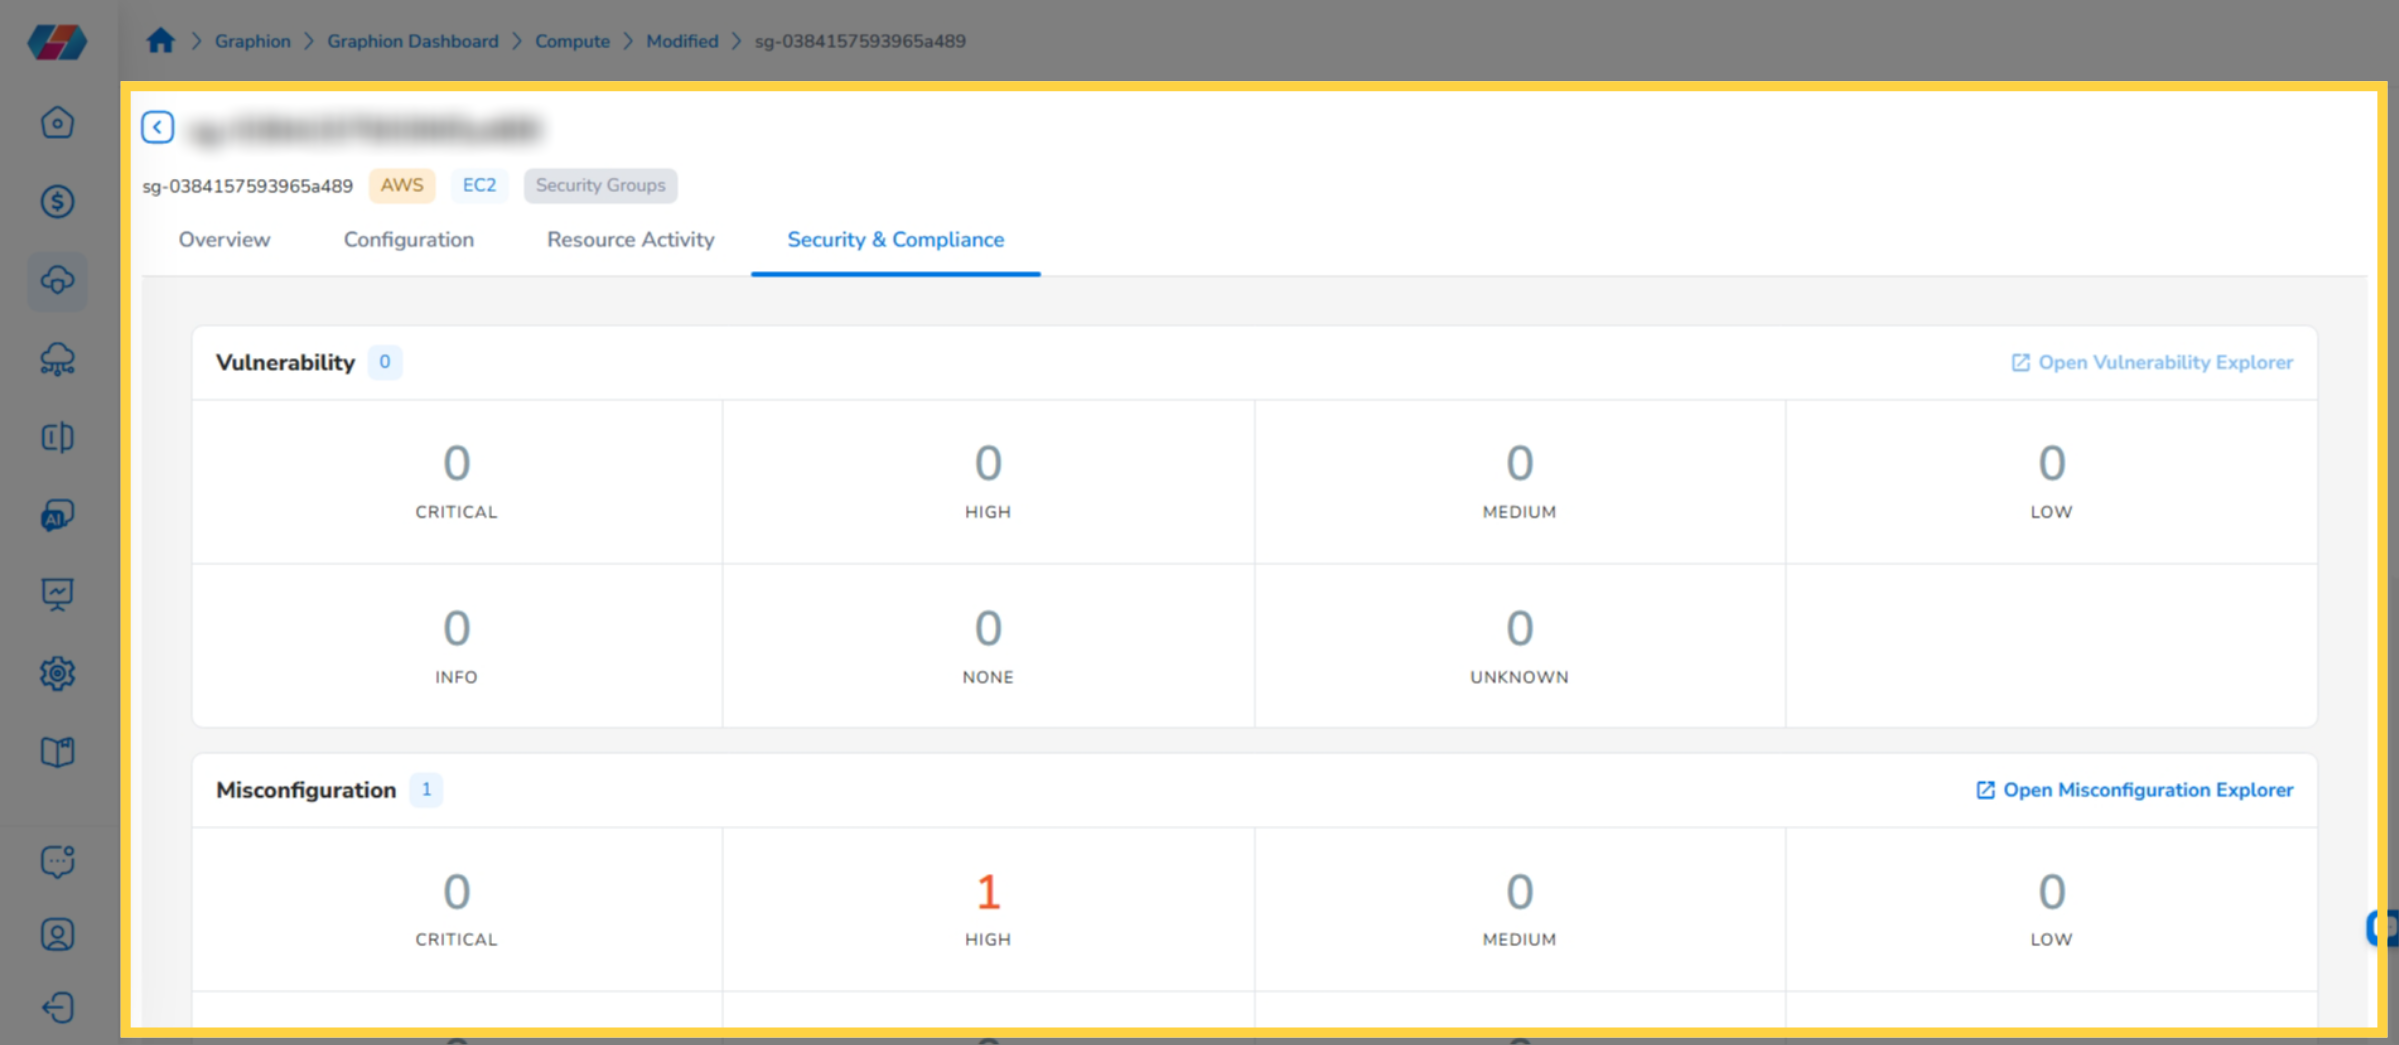
Security & Compliance tab showing Vulnerability and Misconfiguration sections with Explorer links
Widget Actions
Each widget in the Infrastructure Dashboard has a set of options accessible from the widget toolbar at the top right. These options allow users to filter, expand, and take further actions on any chart.
Filter
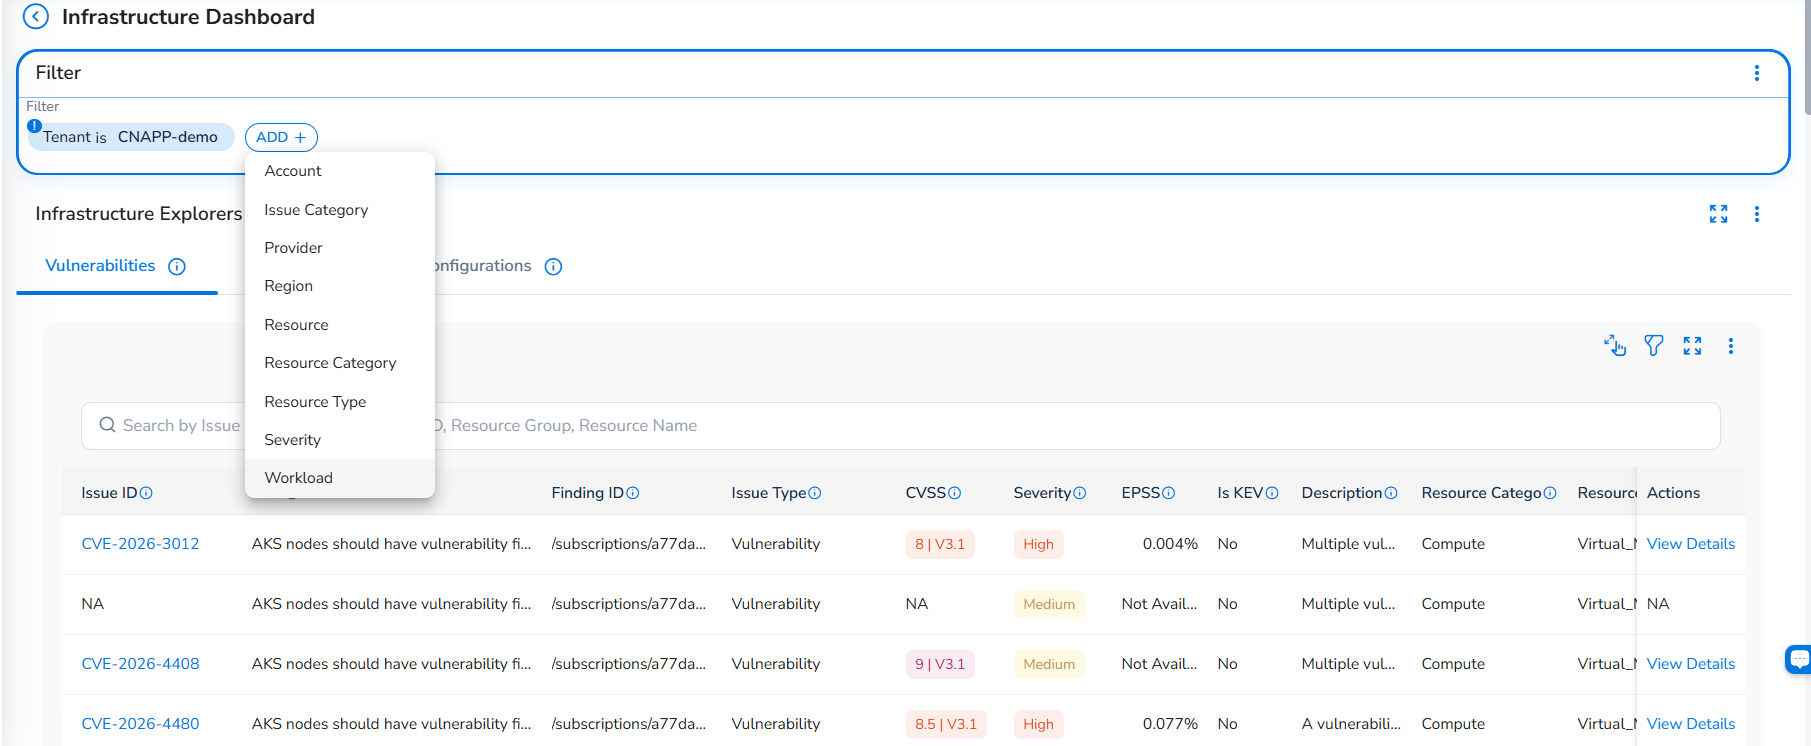
Click the Filter icon in the widget toolbar to open or hide the filter panel. The filter panel shows any active filters and lets you add custom filters.
- To add a filter: Click ADD+, select the filter type from the dropdown, then select the values to filter by.
- To remove a filter: Click the filter chip to deselect it or clear it from the panel.
- To hide the filter panel: Click the Filter icon again.
Click the Filter icon in the widget toolbar to open the filter panel
Note: The Workload Filter is available as a widget-level filter on the Infrastructure Resources – By Resource Category widget. Each workload in CoreStack corresponds to an onboarded cloud account and is created automatically — no manual setup is required. Applying a Workload filter scopes the stacked bar chart to display only the resource counts and change history associated with the selected cloud account.
Use the Workload filter when you need to:
- Track how resources across categories — such as Compute, Storage, or Network — have changed over time for a specific cloud account
- Investigate whether unexpected resource additions, modifications, or deletions are isolated to a particular account
- Compare resource change patterns across cloud accounts by applying different Workload filters independently
To apply the filter, click the Filter icon on the widget, select Workload from the filter attribute dropdown, choose the workload from the value list, and click Ok. The chart refreshes immediately to reflect only the resource change data for the selected workload. This scoping carries through when you drill down into a resource category or open the resource details table.
Expand View
Click the Expand View icon in the widget toolbar to open the widget in full-screen mode. This is useful for reading dense charts with many data points. Click the icon again to return to the standard dashboard view.
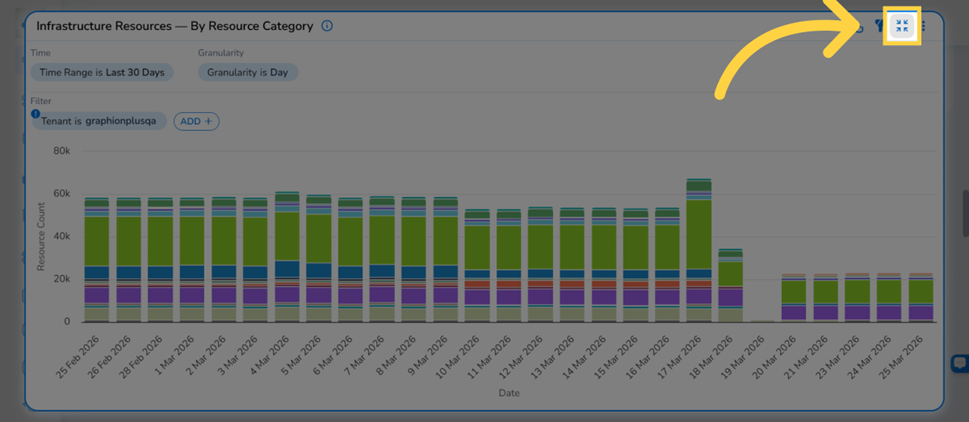
Expanded view shows the chart full-screen with active filters visible above
Actions
Click the ellipsis icon in the widget toolbar to open the Actions menu. The following actions are available:
- Export config: Export the current widget configuration.
- Swap Axis: Switch the X and Y axes on the chart for an alternative view of the data.
- Subscribe: Set up a subscription for automated delivery of this widget's data.
- Download as CSV: Download the chart data as a CSV file.
- Download as PNG: Save the current chart as a PNG image.
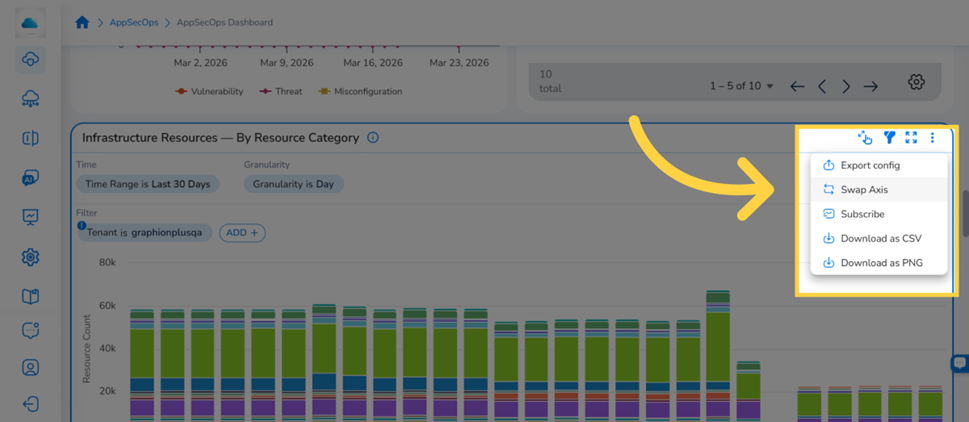
The Actions menu provides options to export, swap axes, subscribe, or download the widget data
Frequently Asked Questions
Q: Why does the chart show no data for some scan dates?
If a scan did not complete successfully for a given date, that timestamp may be missing or show zero resources. Check with the administrator to confirm whether scheduled scans are running. If scans are failing, verify that the cloud account credentials are valid and that CoreStack has the required read permissions.
Q: How far back does this view show data?
The view retains data for the most recent 30 days. Changes older than 30 days are not displayed. For data beyond this window for compliance or audit purposes, contact the CoreStack administrator to discuss available options.
Q: What does "Unchanged" mean in the change type chart?
Unchanged resources are those that existed in both the previous scan and the current scan with no detectable configuration differences. They are included to provide the full picture of the resource inventory at each point in time, not just the resources that changed.
Q: Can I see changes for a specific cloud account only?
Yes. Use the Filter option in the widget toolbar to apply a filter by Cloud Account. The chart and all subsequent views will reflect only the selected accounts.
Q: I cannot click into a bar segment — nothing happens. What's wrong?
Click targets are the coloured bar segments themselves, not the chart background. If a segment is very narrow (few resources in that category), try using the Expand View option to enlarge the chart first.
Q: How far back does the Resource Detail View show Change Events?
The Change Events section in the Resource Activity tab retains data for a configurable window of up to 180 days. The default retention period may vary by organization — contact your Tenant Admin to confirm or adjust the configured window.
Troubleshooting
The Cloud Security Dashboard is not visible in the navigation
Cause: The user account may not have Graphion module access, or the module may not be enabled for the organization.
Solution:
- Confirm with your CoreStack administrator that the account has access to the appropriate bundle.
- Ask the administrator to verify that the appropriate module is enabled for the organization.
- Log out and back in to refresh the session after any access changes.
- If the module is enabled and access is confirmed but the navigation item is still missing, contact CoreStack support with the account ID and current assigned role.
The Resource Changes Over Time chart shows no data
Cause: The most common causes are: (1) fewer than two scans have completed so there is no change comparison data, or (2) no cloud accounts are onboarded.
Solution:
- Confirm that at least two scans have completed successfully for the connected cloud accounts.
- If accounts are not yet onboarded, follow the account onboarding guide to connect cloud accounts to CoreStack.
- If scans have completed and data is still missing, check whether active filters are excluding all accounts. Clear all filters and reload the dashboard.
- If the issue persists, contact CoreStack support and include the account ID, cloud provider, and the approximate scan dates expected.
The Resource Activity tab shows no Change Events
Cause: Either the resource has only been scanned once (no change history yet), or all events fall outside the configured retention window.
Solution:
- Check the Overview tab to confirm the Change Events summary widget shows a count greater than zero. If it shows zero, no change events exist yet for this resource.
- If events appear in the summary widget but not in the Resource Activity tab, verify that no change type filter is active — click All to clear any active filter.
- If the resource was recently added, wait for a second scan to complete. Change history requires at least two scans.
- If the issue persists, contact CoreStack support with the resource ID and the expected event date range.
Updated about 2 months ago